Category: Your Money

Macro Update 25.04.2015

US Treasuries vs. Gilt Spread

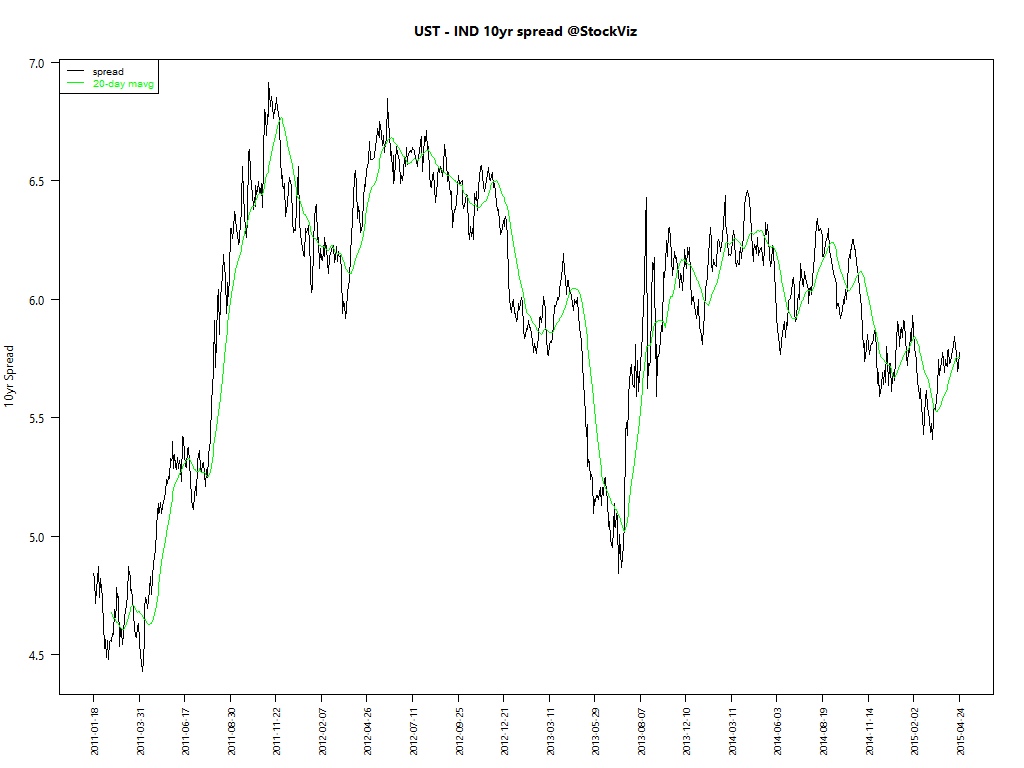
The spread between 10yr US Treasuries and Indian Gilts have widened over the last couple of months…

ust-ind-10yr-spread.2011-01-18

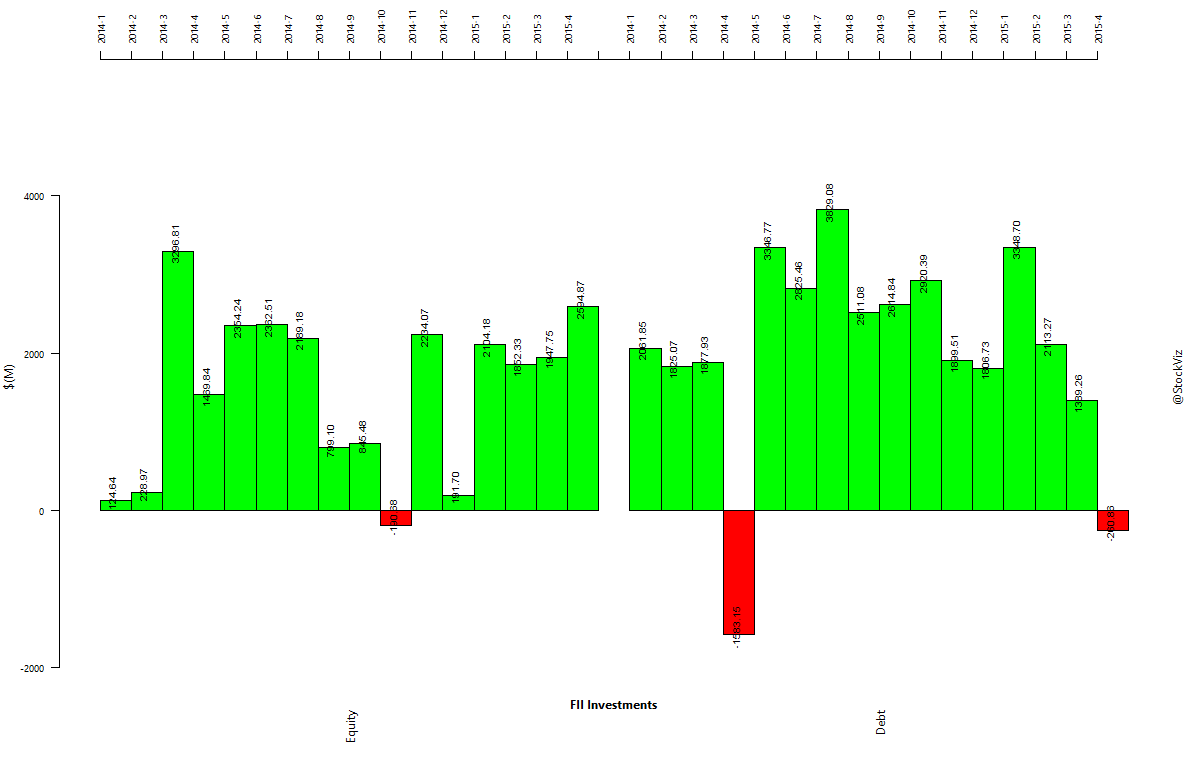
Institutional Investments

… probably because FPIs were net sellers of debt so far this month. But foreign flows had slowed down in April last year as well, so not sure if this is a seasonal thing.

fii-investments

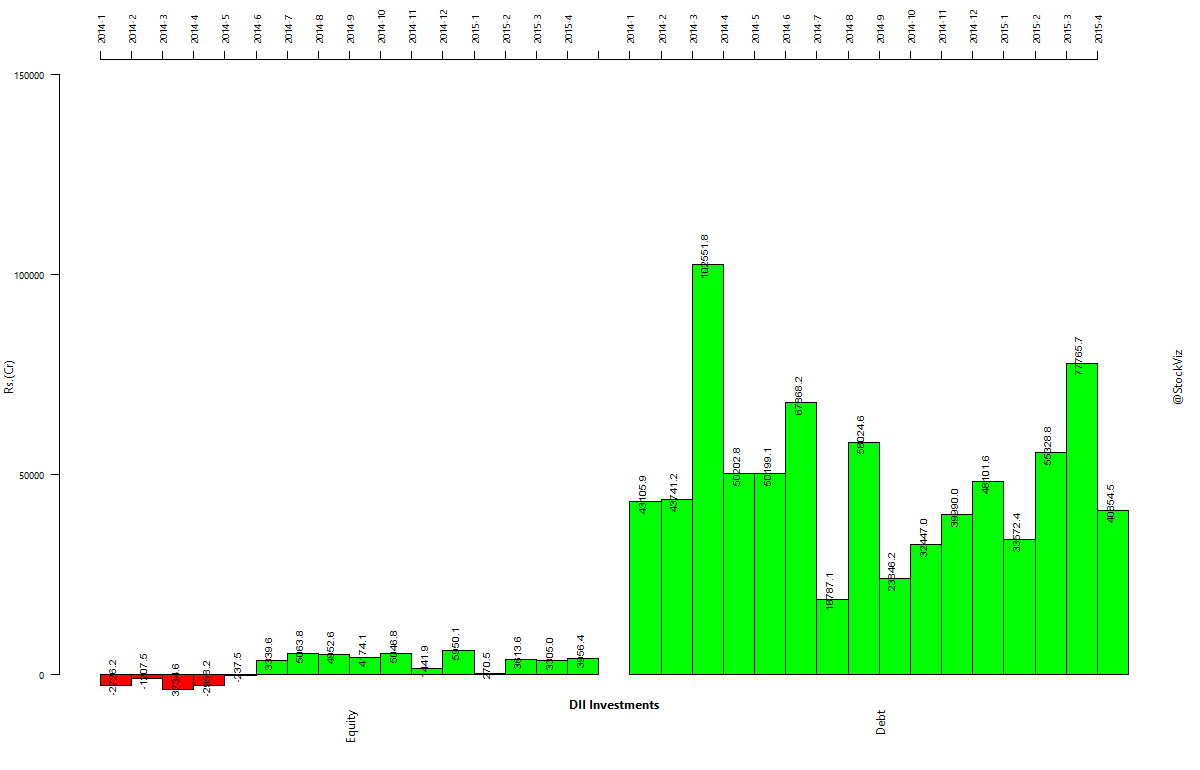
But Domestic institutional investors are in position to pick up the slack if the April swoon leads to a longer lull.

dii-investments

Oil

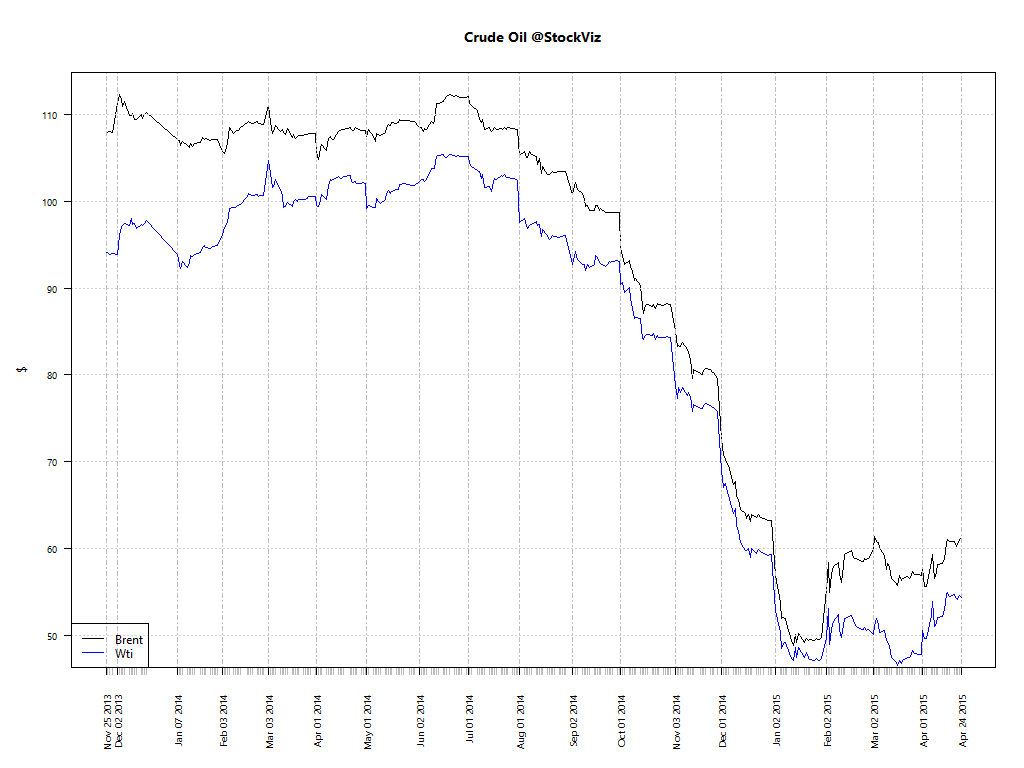
Fall in global oil prices were a tail-wind last year. But is the tide about to turn? Oil has been inching up since its January lows.

wti-brent crude oil

Gold

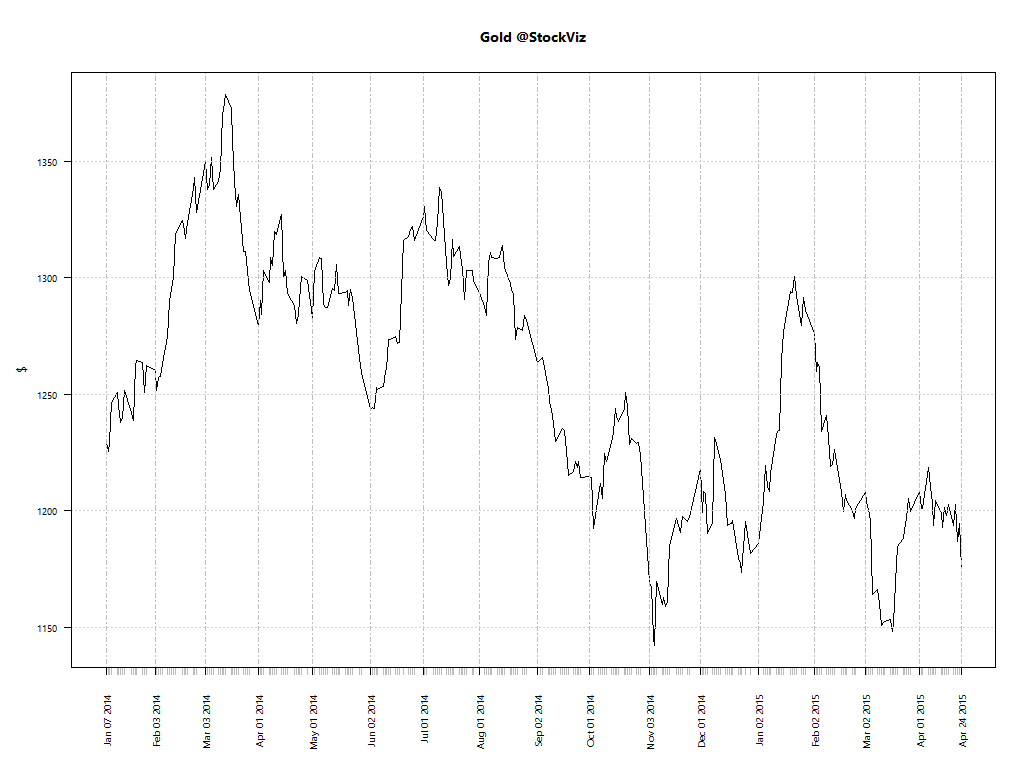
The fate of Gold is going to be decided by Janet Yellen. Rising rates are no friends of precious metals.

gold.usd

And Gold in Indian Rupees are back at Jan 2013 levels.

USDINR

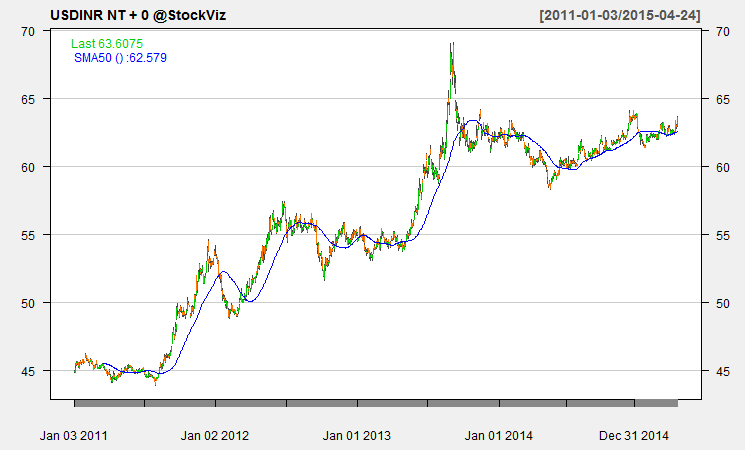
If US rates go up, will the Rupee see 64? INR has been steadily losing ground to the dollar over the last year.

USDINRFutures

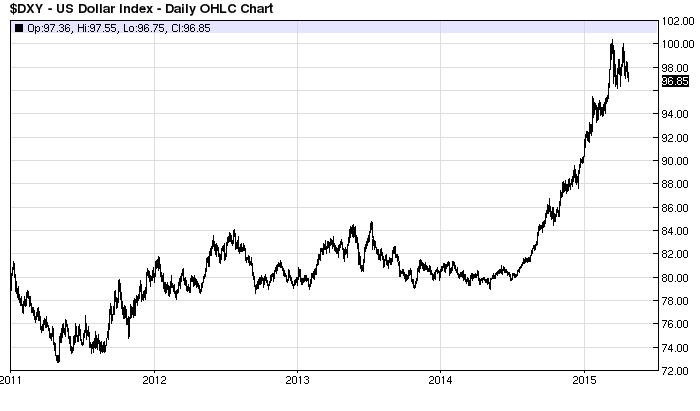
The Dollar Index (DXY) has shot up like a rocket this year. One can argue that INR has actually appreciated against other currencies.

DXY - Dollar Index

Outlook

Rising oil prices and the US dollar, combined with a sense of disappointment on the reforms front could flat-line markets. Poor monsoons could put further pressure on the inflation front, and not to mention the government balance-sheet as it would be forced to provide relief to drought-stricken farmers. Bulls do not have much to go on at this point given that valuations are stretched and the current earnings season has been a disappointment so far.

Weekly Recap: Paradox of Thrift

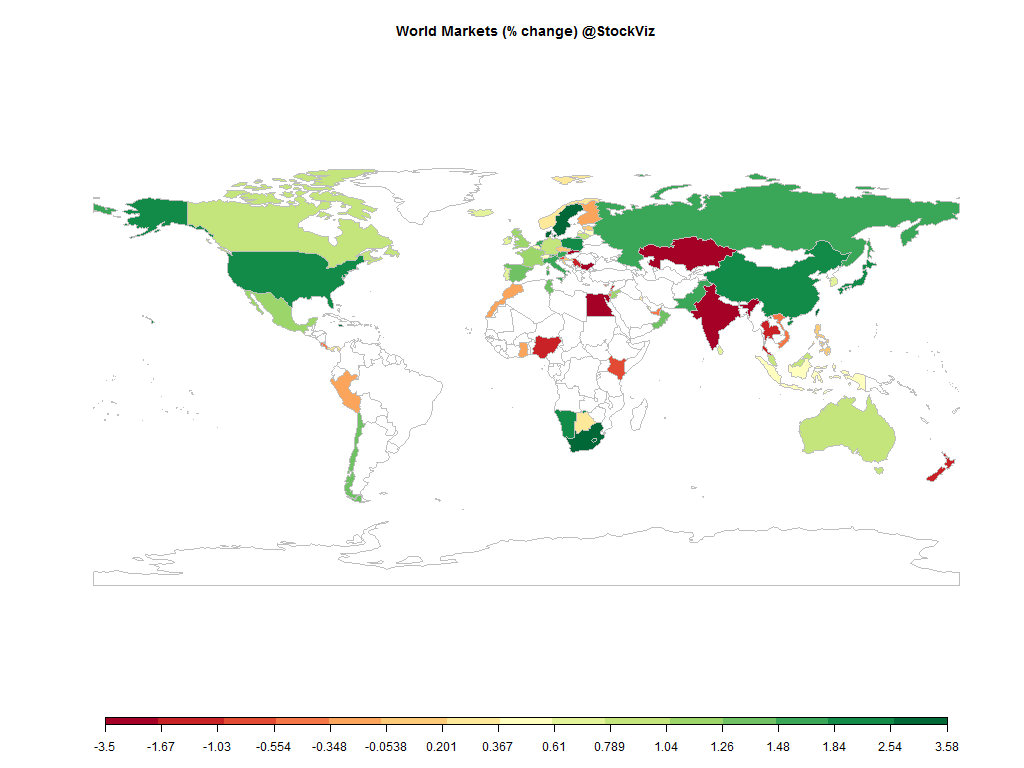
world.2015-4-17.2015-4-24

Equities

Major
DAX(DEU) +1.05%
CAC(FRA) +1.13%
UKX(GBR) +1.09%
NKY(JPN) +1.87%
SPX(USA) +2.18%
MINTs
JCI(IDN) +0.46%
INMEX(MEX) +1.18%
NGSEINDX(NGA) -1.48%
XU030(TUR) +3.81%
BRICS
IBOV(BRA) +4.90%
SHCOMP(CHN) +2.48%
NIFTY(IND) -3.49%
INDEXCF(RUS) +1.58%
TOP40(ZAF) +3.10%

Commodities

Energy
Heating Oil +2.53%
RBOB Gasoline +4.33%
Brent Crude Oil +2.97%
Ethanol -1.12%
Natural Gas -4.16%
WTI Crude Oil +3.44%
Metals
Copper -1.08%
Palladium -1.66%
Gold 100oz -2.15%
Silver 5000oz -3.07%
Platinum -3.70%

Currencies

USDEUR:-0.78% USDJPY:+0.13%

MINTs
USDIDR(IDN) +0.56%
USDMXN(MEX) +0.16%
USDNGN(NGA) -0.25%
USDTRY(TUR) +1.08%
BRICS
USDBRL(BRA) -3.55%
USDCNY(CHN) -0.05%
USDINR(IND) +1.92%
USDRUB(RUS) -2.42%
USDZAR(ZAF) +0.35%
Agricultural
Corn -4.14%
Cotton +5.64%
Feeder Cattle +1.27%
Wheat -1.57%
Soybean Meal -0.10%
Sugar #11 +0.00%
Coffee (Robusta) -0.22%
White Sugar +0.78%
Cattle +2.17%
Cocoa +1.29%
Coffee (Arabica) +1.83%
Lean Hogs +1.58%
Lumber +3.72%
Orange Juice -1.00%
Soybeans +0.03%

Credit Indices

Index Change
Markit CDX EM +0.02%
Markit CDX NA HY +0.02%
Markit CDX NA IG +0.08%
Markit iTraxx Asia ex-Japan IG +0.29%
Markit iTraxx Australia +2.10%
Markit iTraxx Europe +2.28%
Markit iTraxx Europe Crossover -0.19%
Markit iTraxx Japan -0.15%
Markit iTraxx SovX Western Europe +2.70%
Markit LCDX (Loan CDS) +0.00%
Markit MCDX (Municipal CDS) -1.28%
With the Opposition (Congress, mostly) blocking pretty much every reform measure, the Modi magic is dead by a thousand cuts.
A weak Monsoon could stoke inflation and dampen rate-cut expectations.
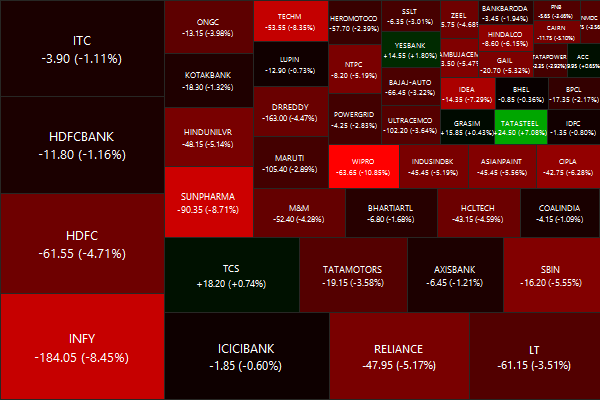
Indian equity markets were a aberration in a sea of green…

Nifty Heatmap

CNX NIFTY.2015-4-17.2015-4-24

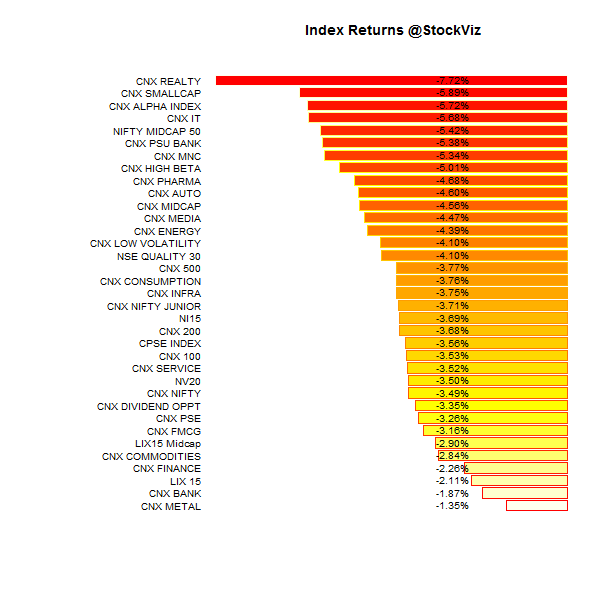
Index Returns

For a deeper dive into indices, check out our weekly Index Update.
index performance.2015-4-17.2015-4-24

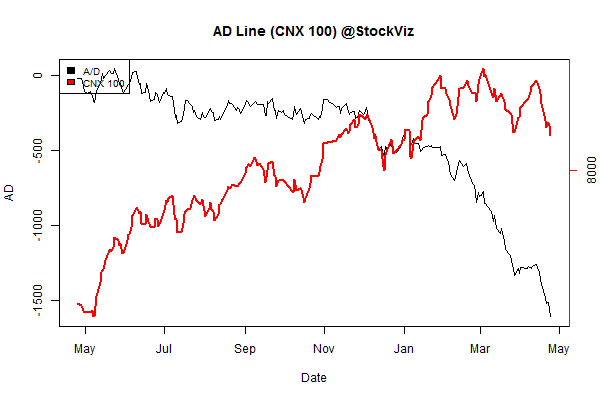
Advance Decline

advance.decline.line2.2015-4-17.2015-4-24

Market Cap Decile Performance

Decile Mkt. Cap. Adv/Decl
1 (micro) -3.87% 70/63
2 -2.51% 63/70
3 -2.25% 60/73
4 -3.61% 58/74
5 -3.80% 61/72
6 -3.02% 58/75
7 -3.28% 58/74
8 -3.48% 58/75
9 -3.61% 62/71
10 (mega) -3.65% 65/68
A clean vertical slice…

Top Winners and Losers

GLENMARK +3.61%
M&MFIN +5.70%
TATASTEEL +7.08%
BOSCHLTD -14.14%
MCDOWELL-N -11.16%
WIPRO -10.85%
Who would’ve thunk that Bosch can collapse like a mid-cap momentum stock?

ETF Performance

GOLDBEES +0.65%
INFRABEES -0.93%
BANKBEES -1.95%
JUNIORBEES -2.00%
CPSEETF -3.58%
NIFTYBEES -3.87%
PSUBNKBEES -5.98%
Gold held steady because the rupee collapsed…

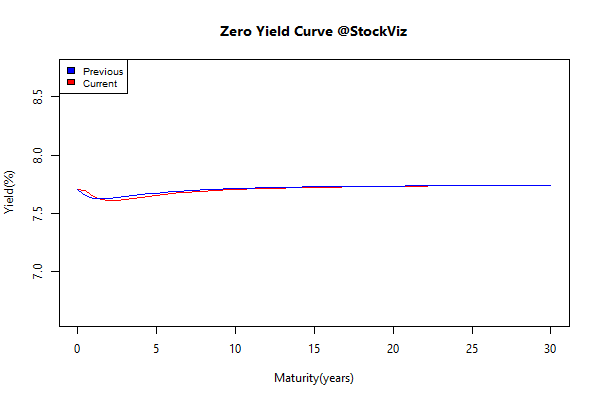
Yield Curve

yield Curve.2015-4-17.2015-4-24

Bond Indices

Sub Index Change in YTM Total Return(%)
GSEC TB +0.08 +0.12%
GSEC SUB 1-3 -0.07 +0.03%
GSEC SUB 3-8 +0.02 -0.02%
GSEC SUB 8 +0.03 +0.05%
The curve barely budged…

Investment Theme Performance

Equity Mutual Funds

Bond Mutual Funds

Thought for the weekend

When governments introduce austerity measures, they are trying to reduce their net borrowing – in effect, they are raising their savings rate. Such attempts to increase saving actually lead to lower, not higher, investment – and since saving equals investment, actual savings fall. So what we have here is an empirical confirmation of the existence of the paradox of thrift!

Source: Crowding In and the Paradox of Thrift

Index Update 25.04.2015

MOMENTUM

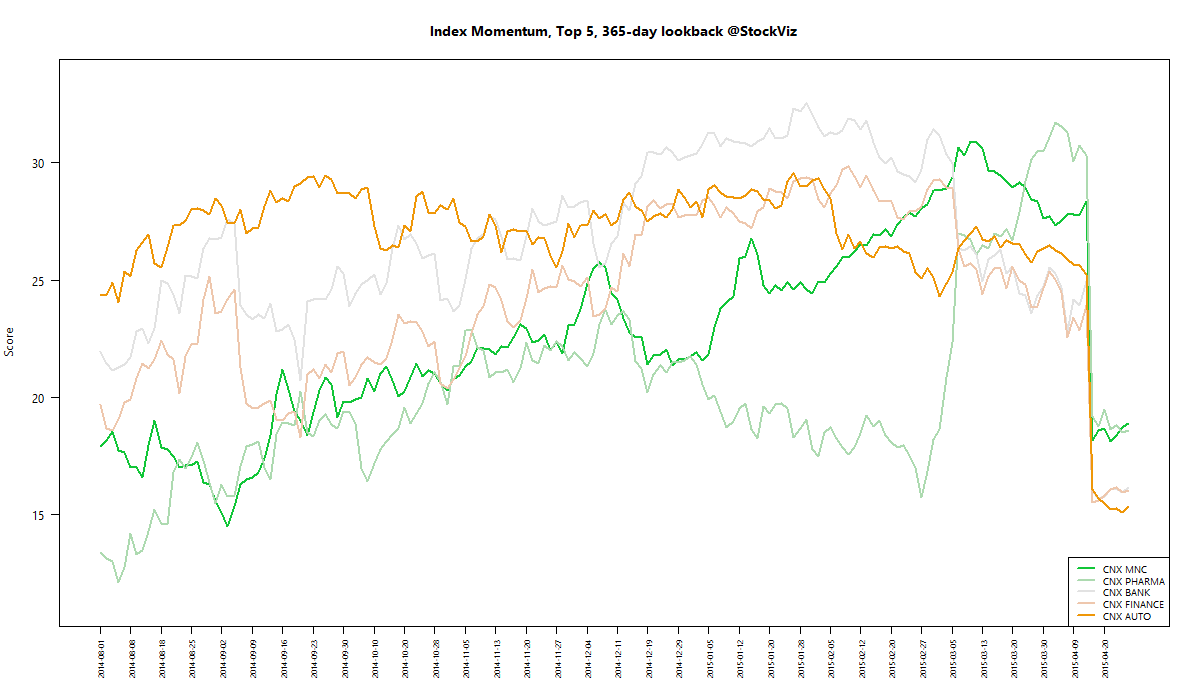
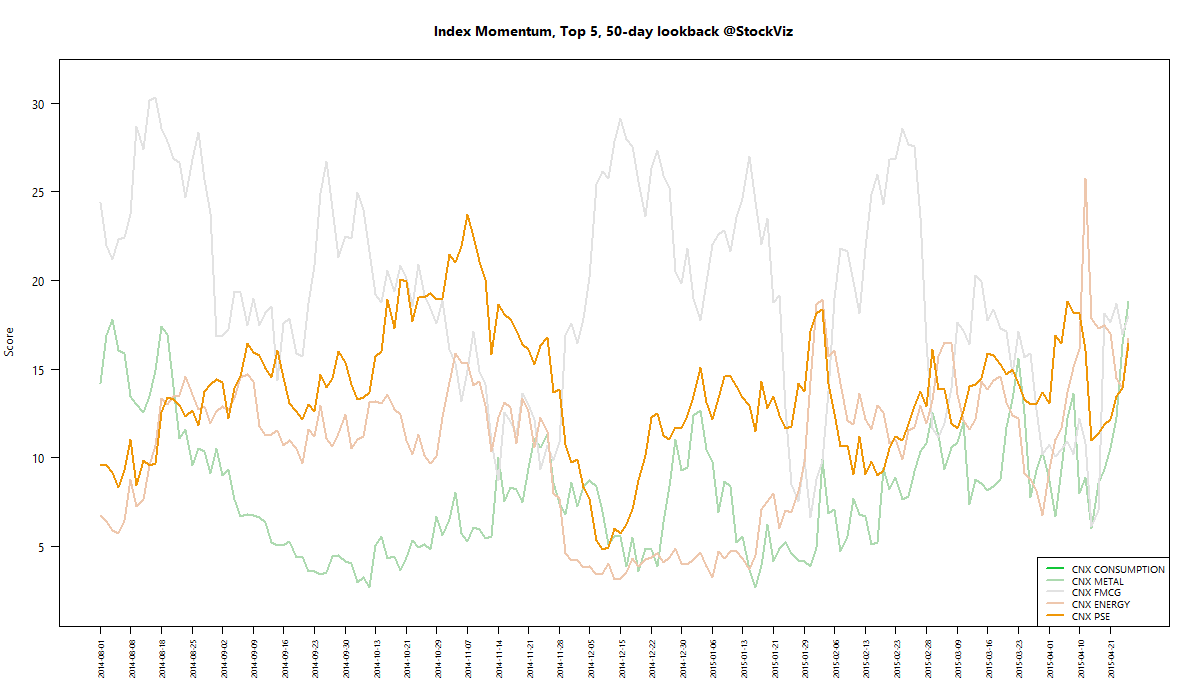
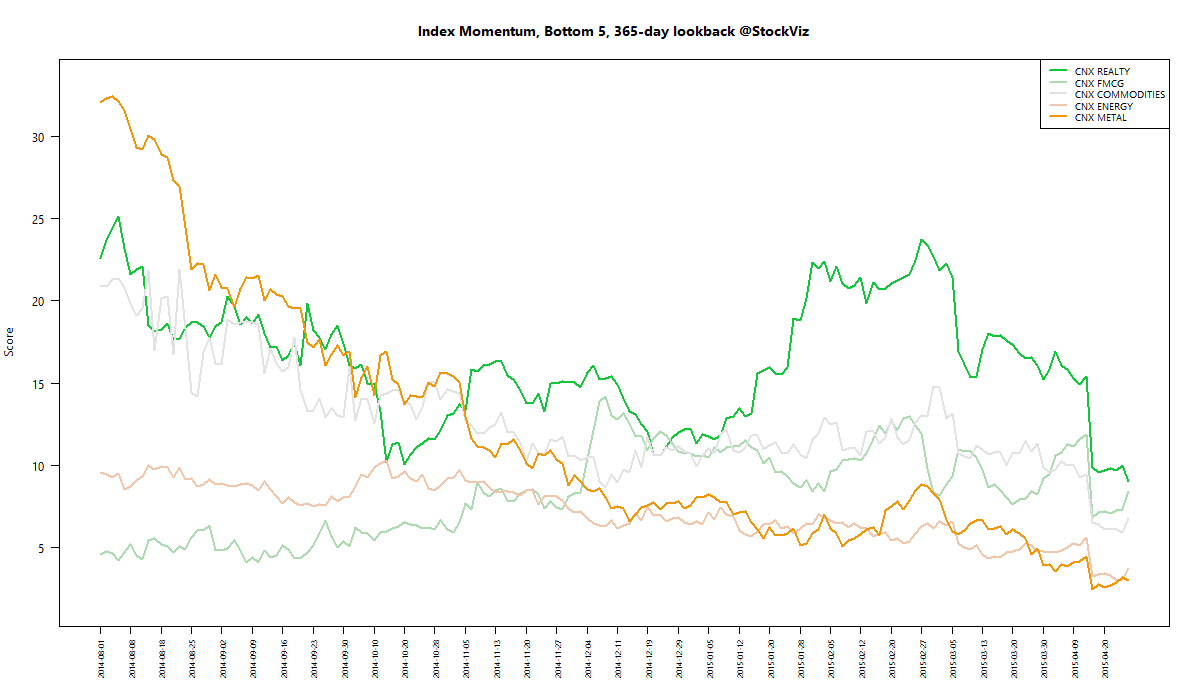
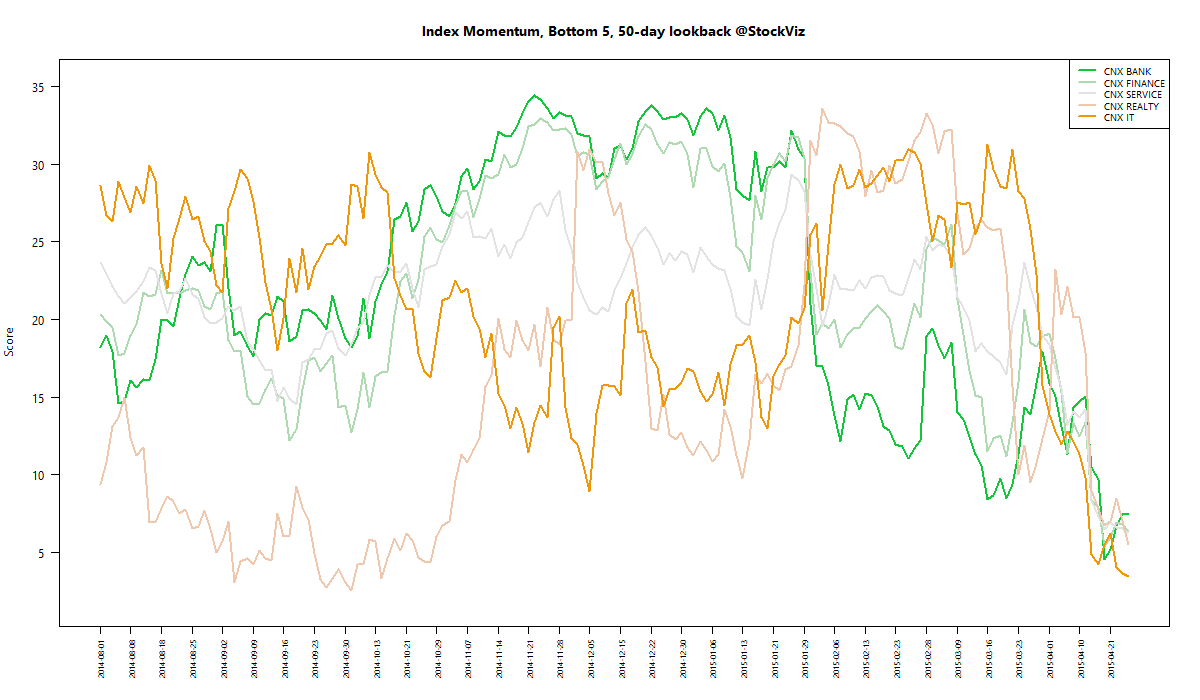
We run our proprietary momentum scoring algorithm on indices just like we do on stocks. You can use the momentum scores of sub-indices to get a sense for which sectors have the wind on their backs and those that are facing headwinds.

Traders can pick their longs in sectors with high short-term momentum and their shorts in sectors with low momentum. Investors can use the longer lookback scores to position themselves using our re-factored index Themes.

You can see how the momentum algorithm has performed on individual stocks here.

Here are the best and the worst sub-indices:

index momentum best 365 2015-04-24 png

index momentum best 50 2015-04-24 png

index momentum worst 365 2015-04-24 png

index momentum worst 50 2015-04-24 png

Refactored Index Performance

50-day performance, from February 10, 2015 through April 24, 2015:

Trend Model Summary

Index Signal % From Peak Day of Peak
CNX AUTO SHORT
10.28
2015-Jan-27
CNX BANK SHORT
12.42
2015-Jan-27
CNX ENERGY SHORT
29.16
2008-Jan-14
CNX FMCG SHORT
7.58
2015-Feb-25
CNX INFRA SHORT
48.62
2008-Jan-09
CNX MEDIA SHORT
28.84
2008-Jan-04
CNX METAL SHORT
55.32
2008-Jan-04
CNX MNC SHORT
6.69
2015-Mar-12
CNX NIFTY SHORT
7.68
2015-Mar-03
CNX PHARMA SHORT
11.72
2015-Apr-08
CNX PSE SHORT
25.79
2008-Jan-04
ENERGY, INFRA, MEDIA, METAL and PSE sub-indices are well below their 2008 boom-era heights. Banks and Pharma have been badly hit this year. Will MNCs provide cover?
Our trend model is short on all indices right now, probably indicating that the market is over-sold…

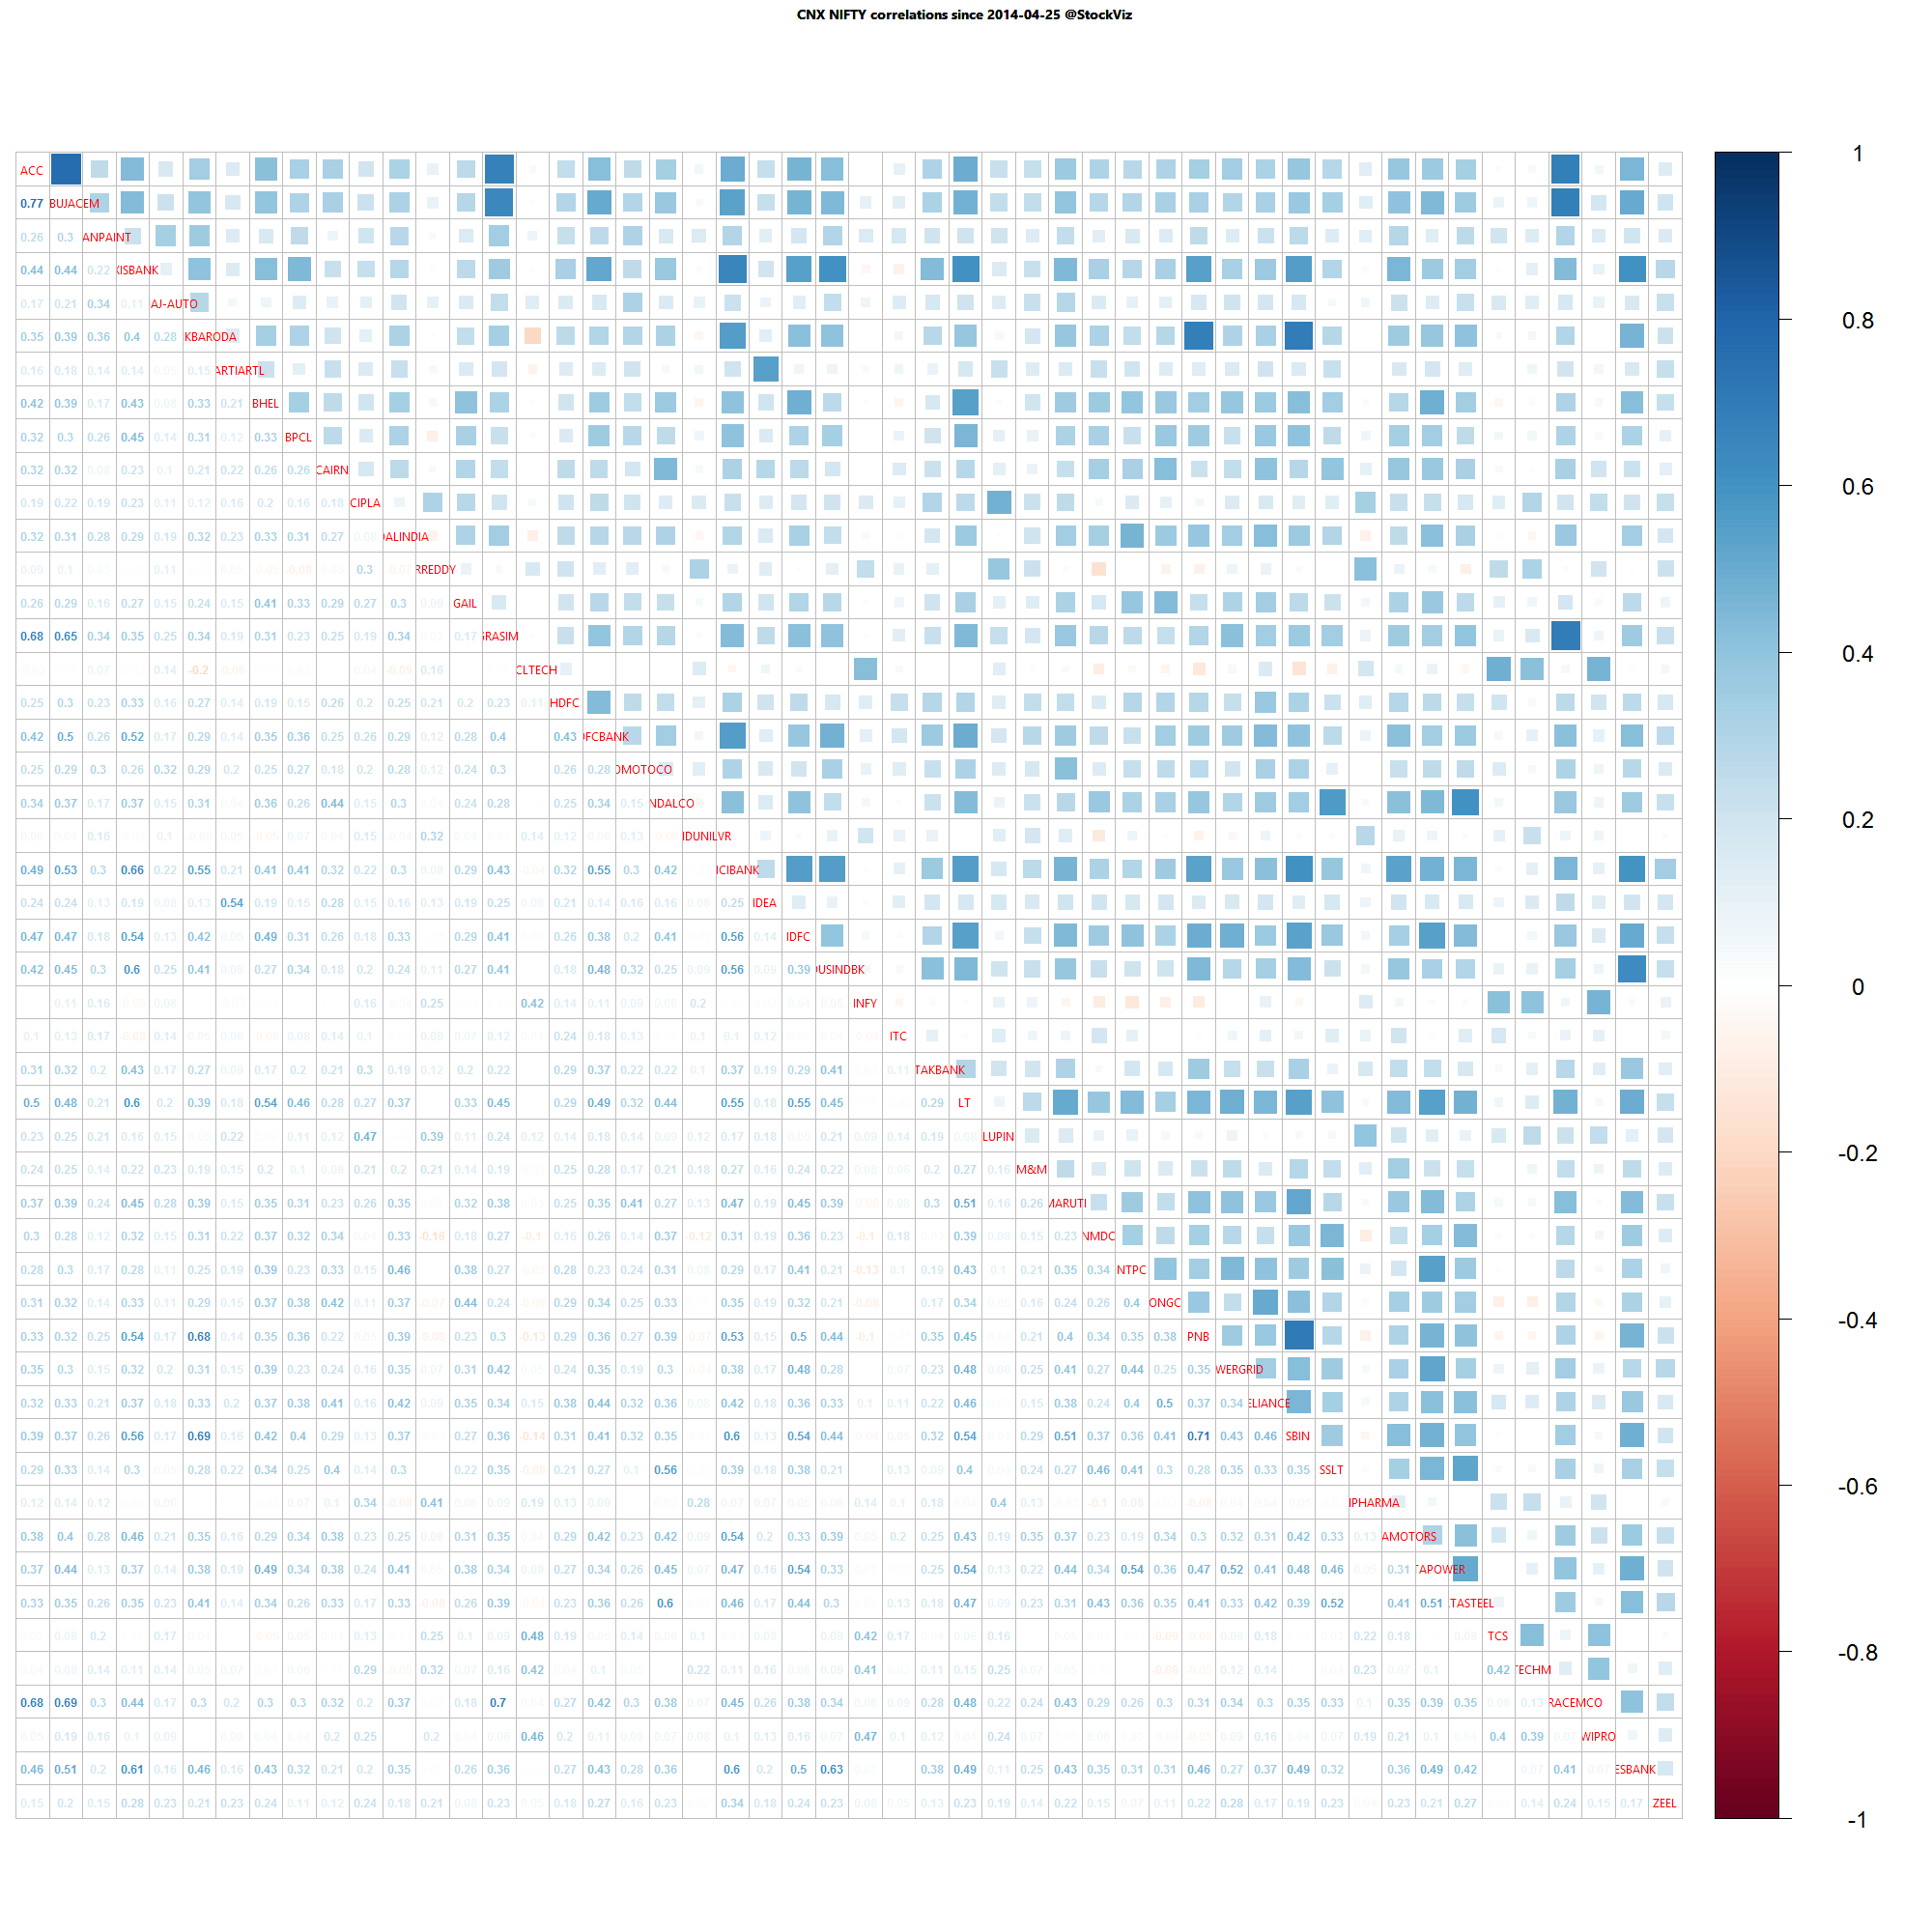
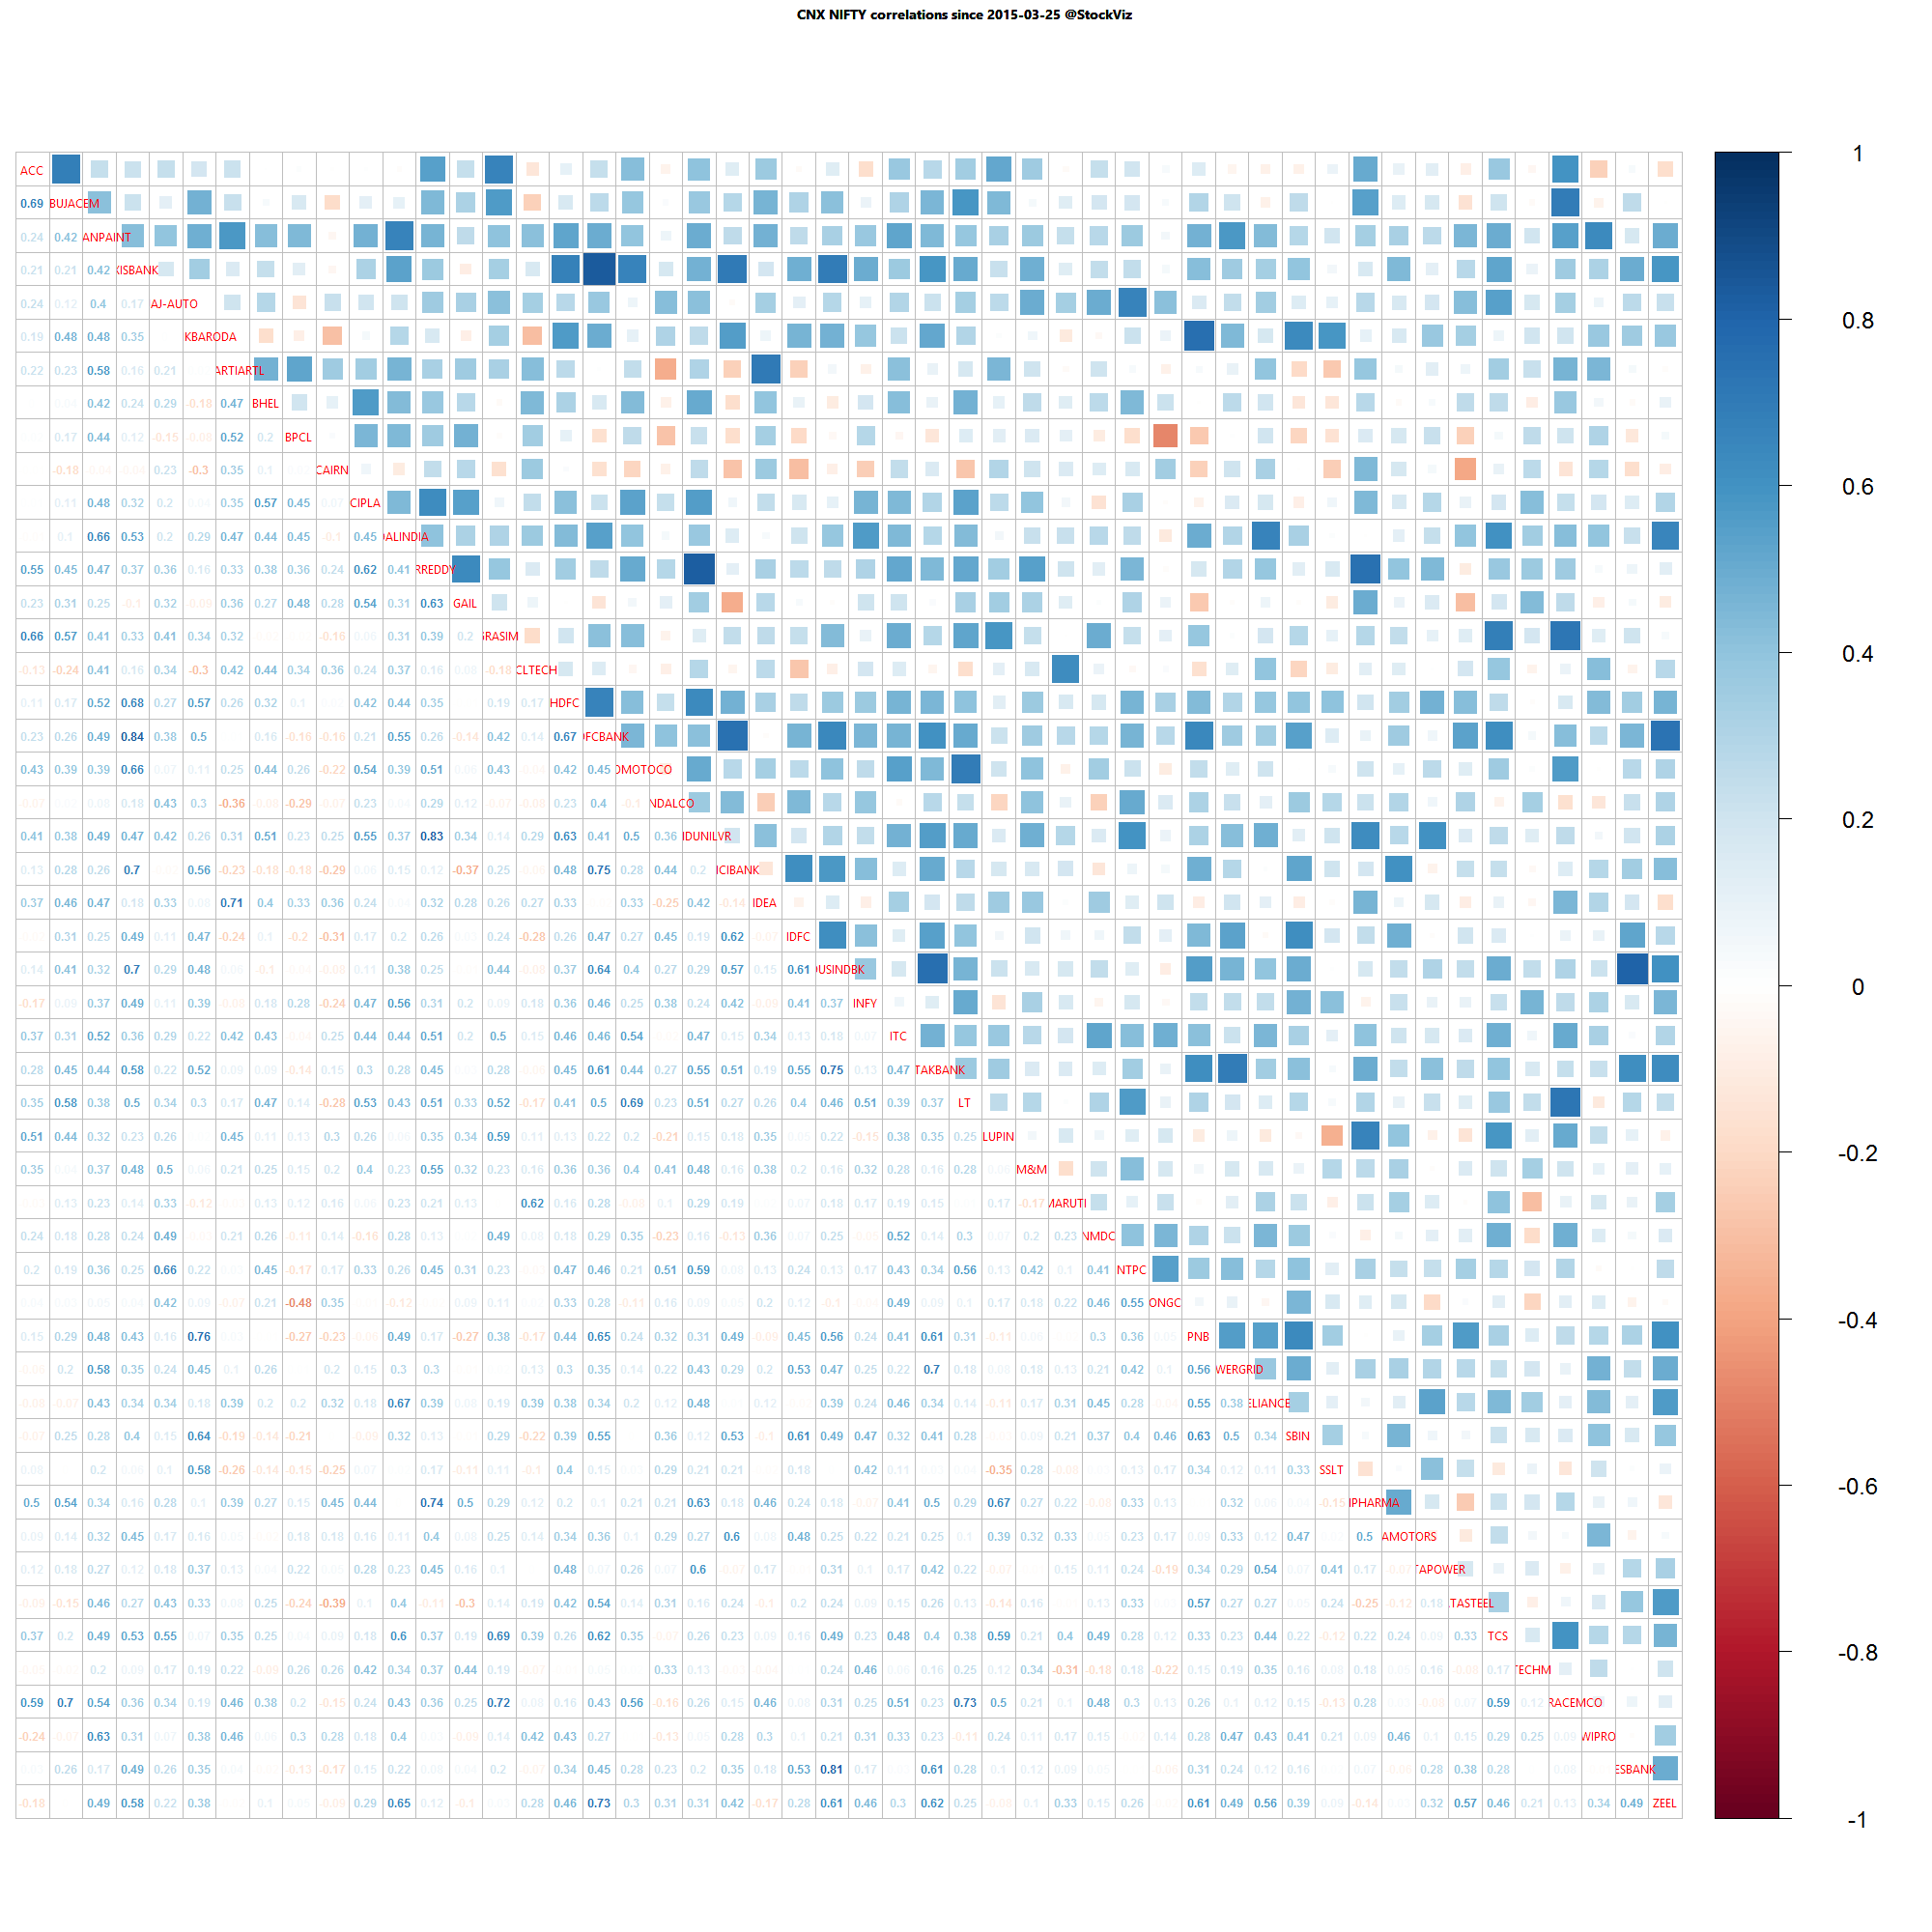
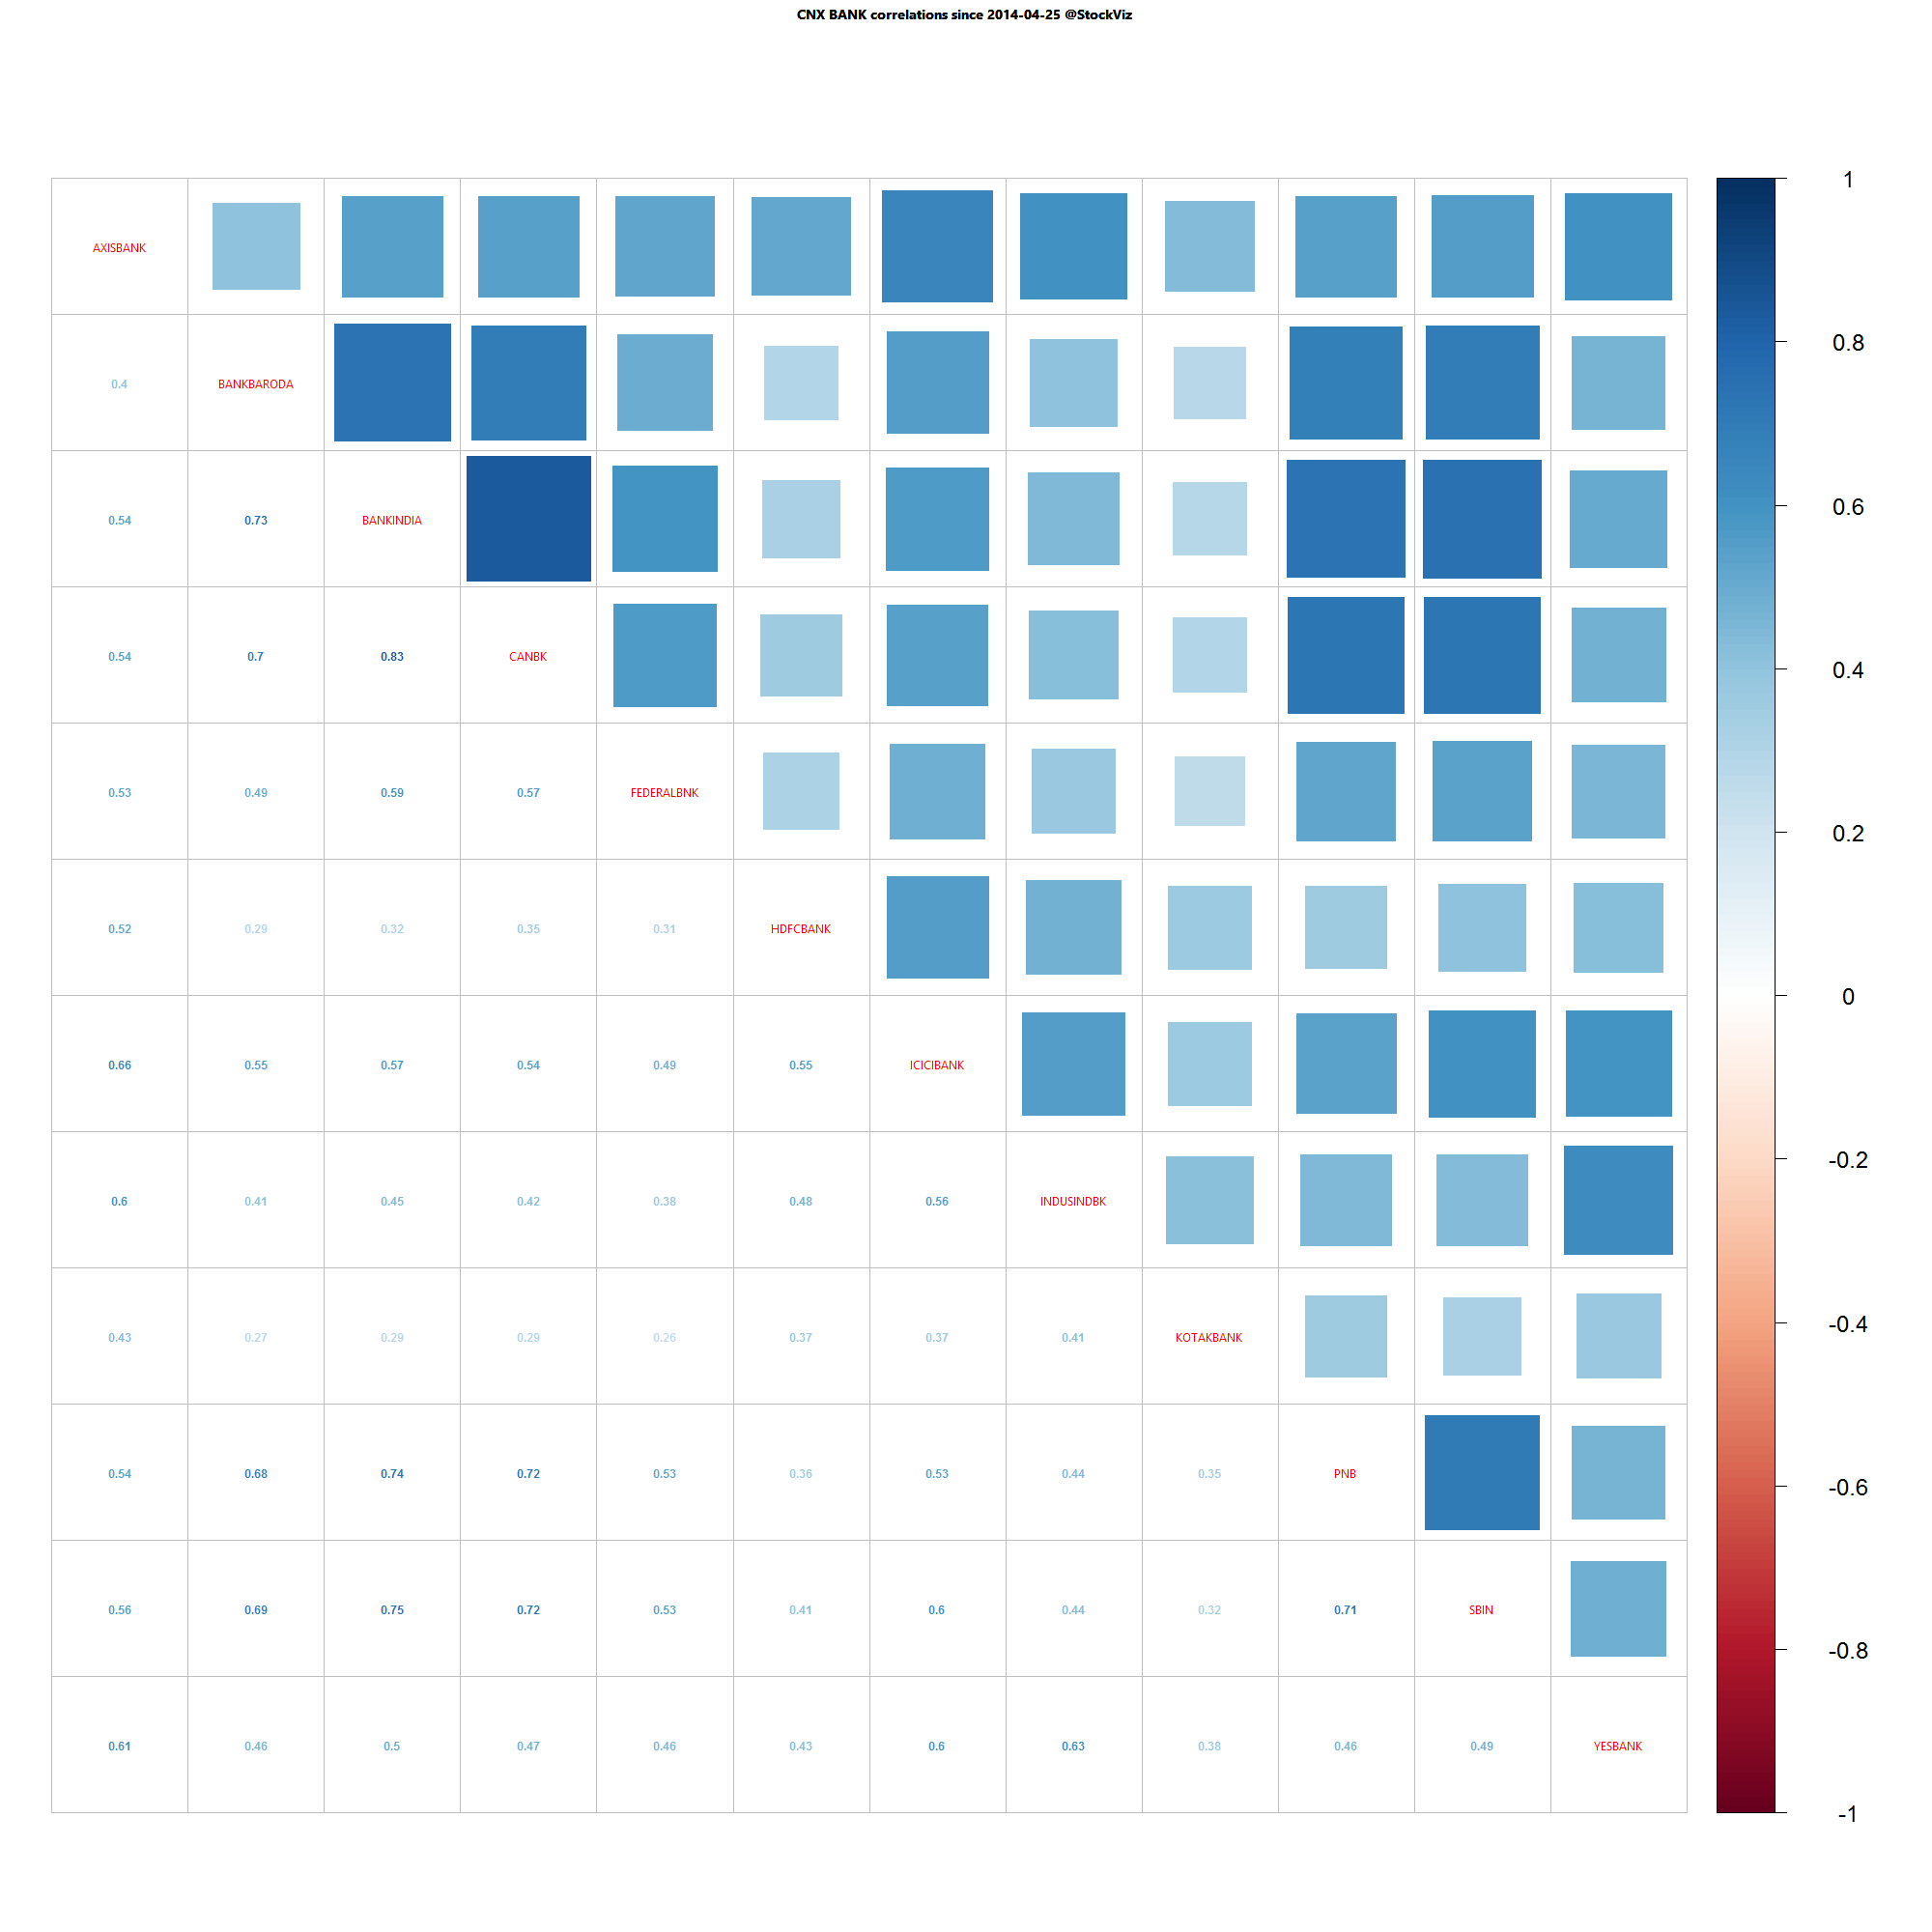
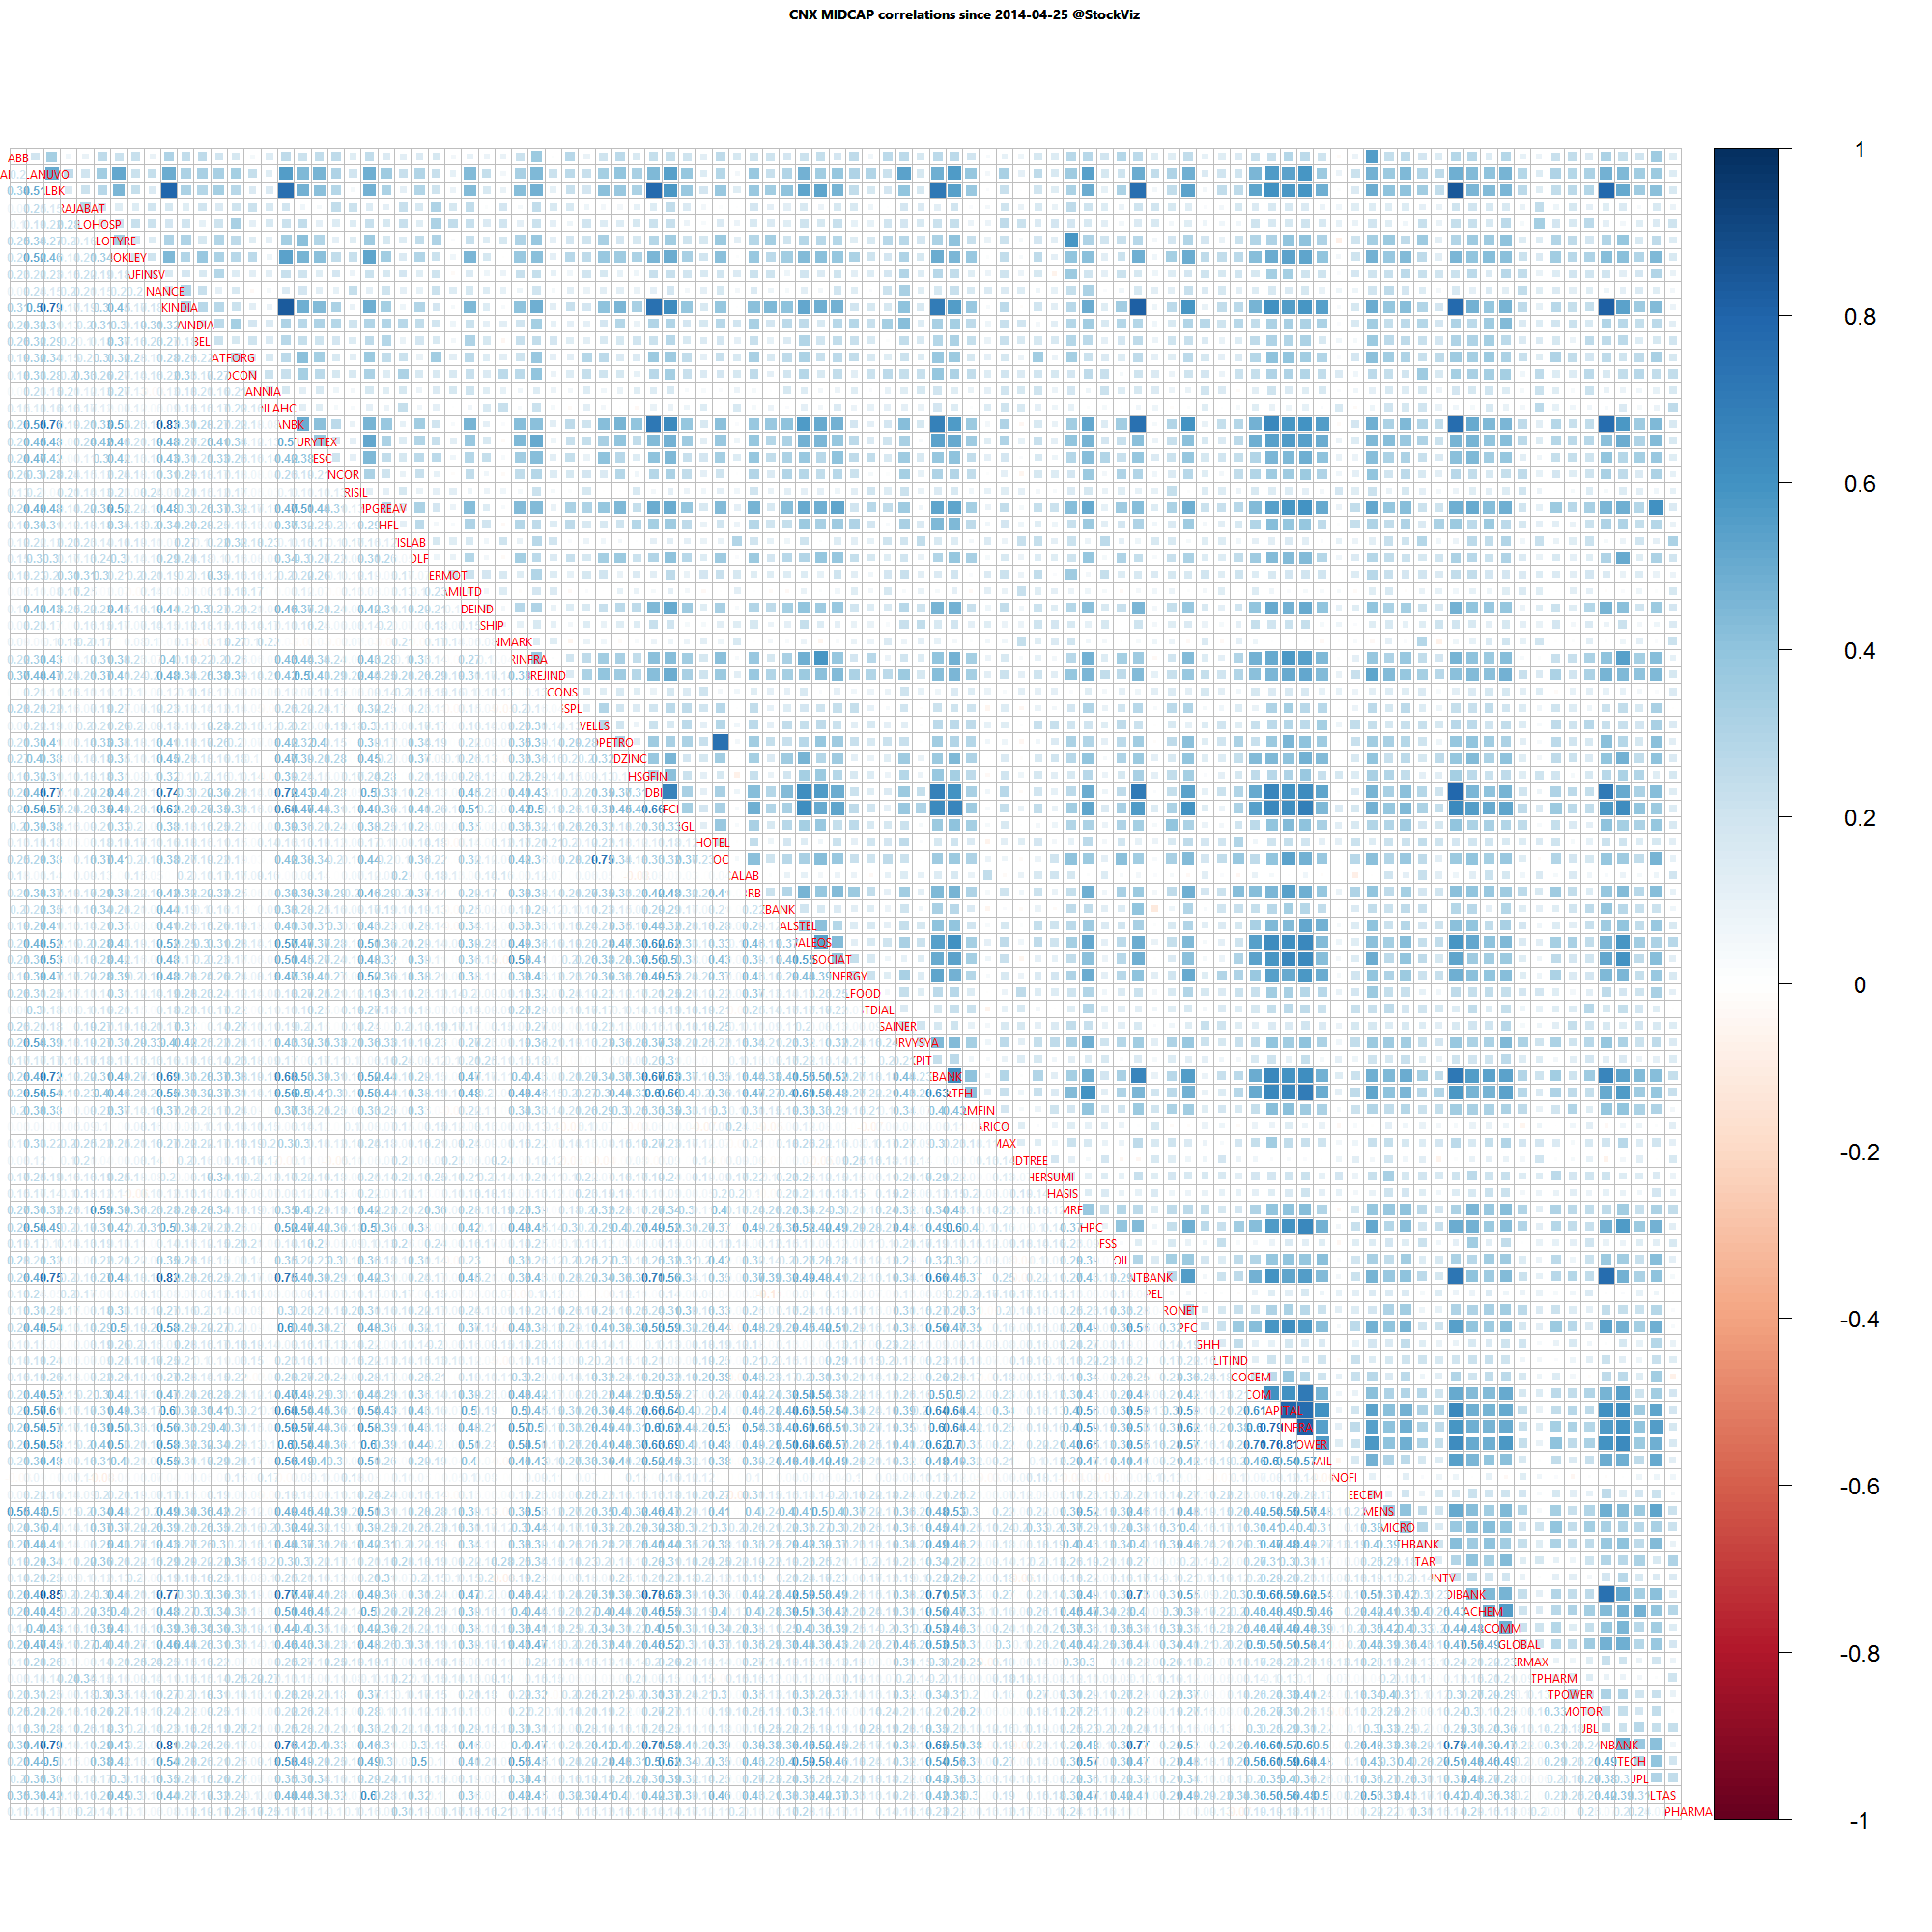
Correlation Update 25.04.2015

Nifty one year daily return correlations

Nifty one year daily return correlations

Nifty one month daily return correlations

Nifty one month daily return correlations

Bank Nifty one year daily return correlations

Bank Nifty one year daily return correlations

Bank Nifty one month daily return correlations

Bank Nifty one month daily return correlations

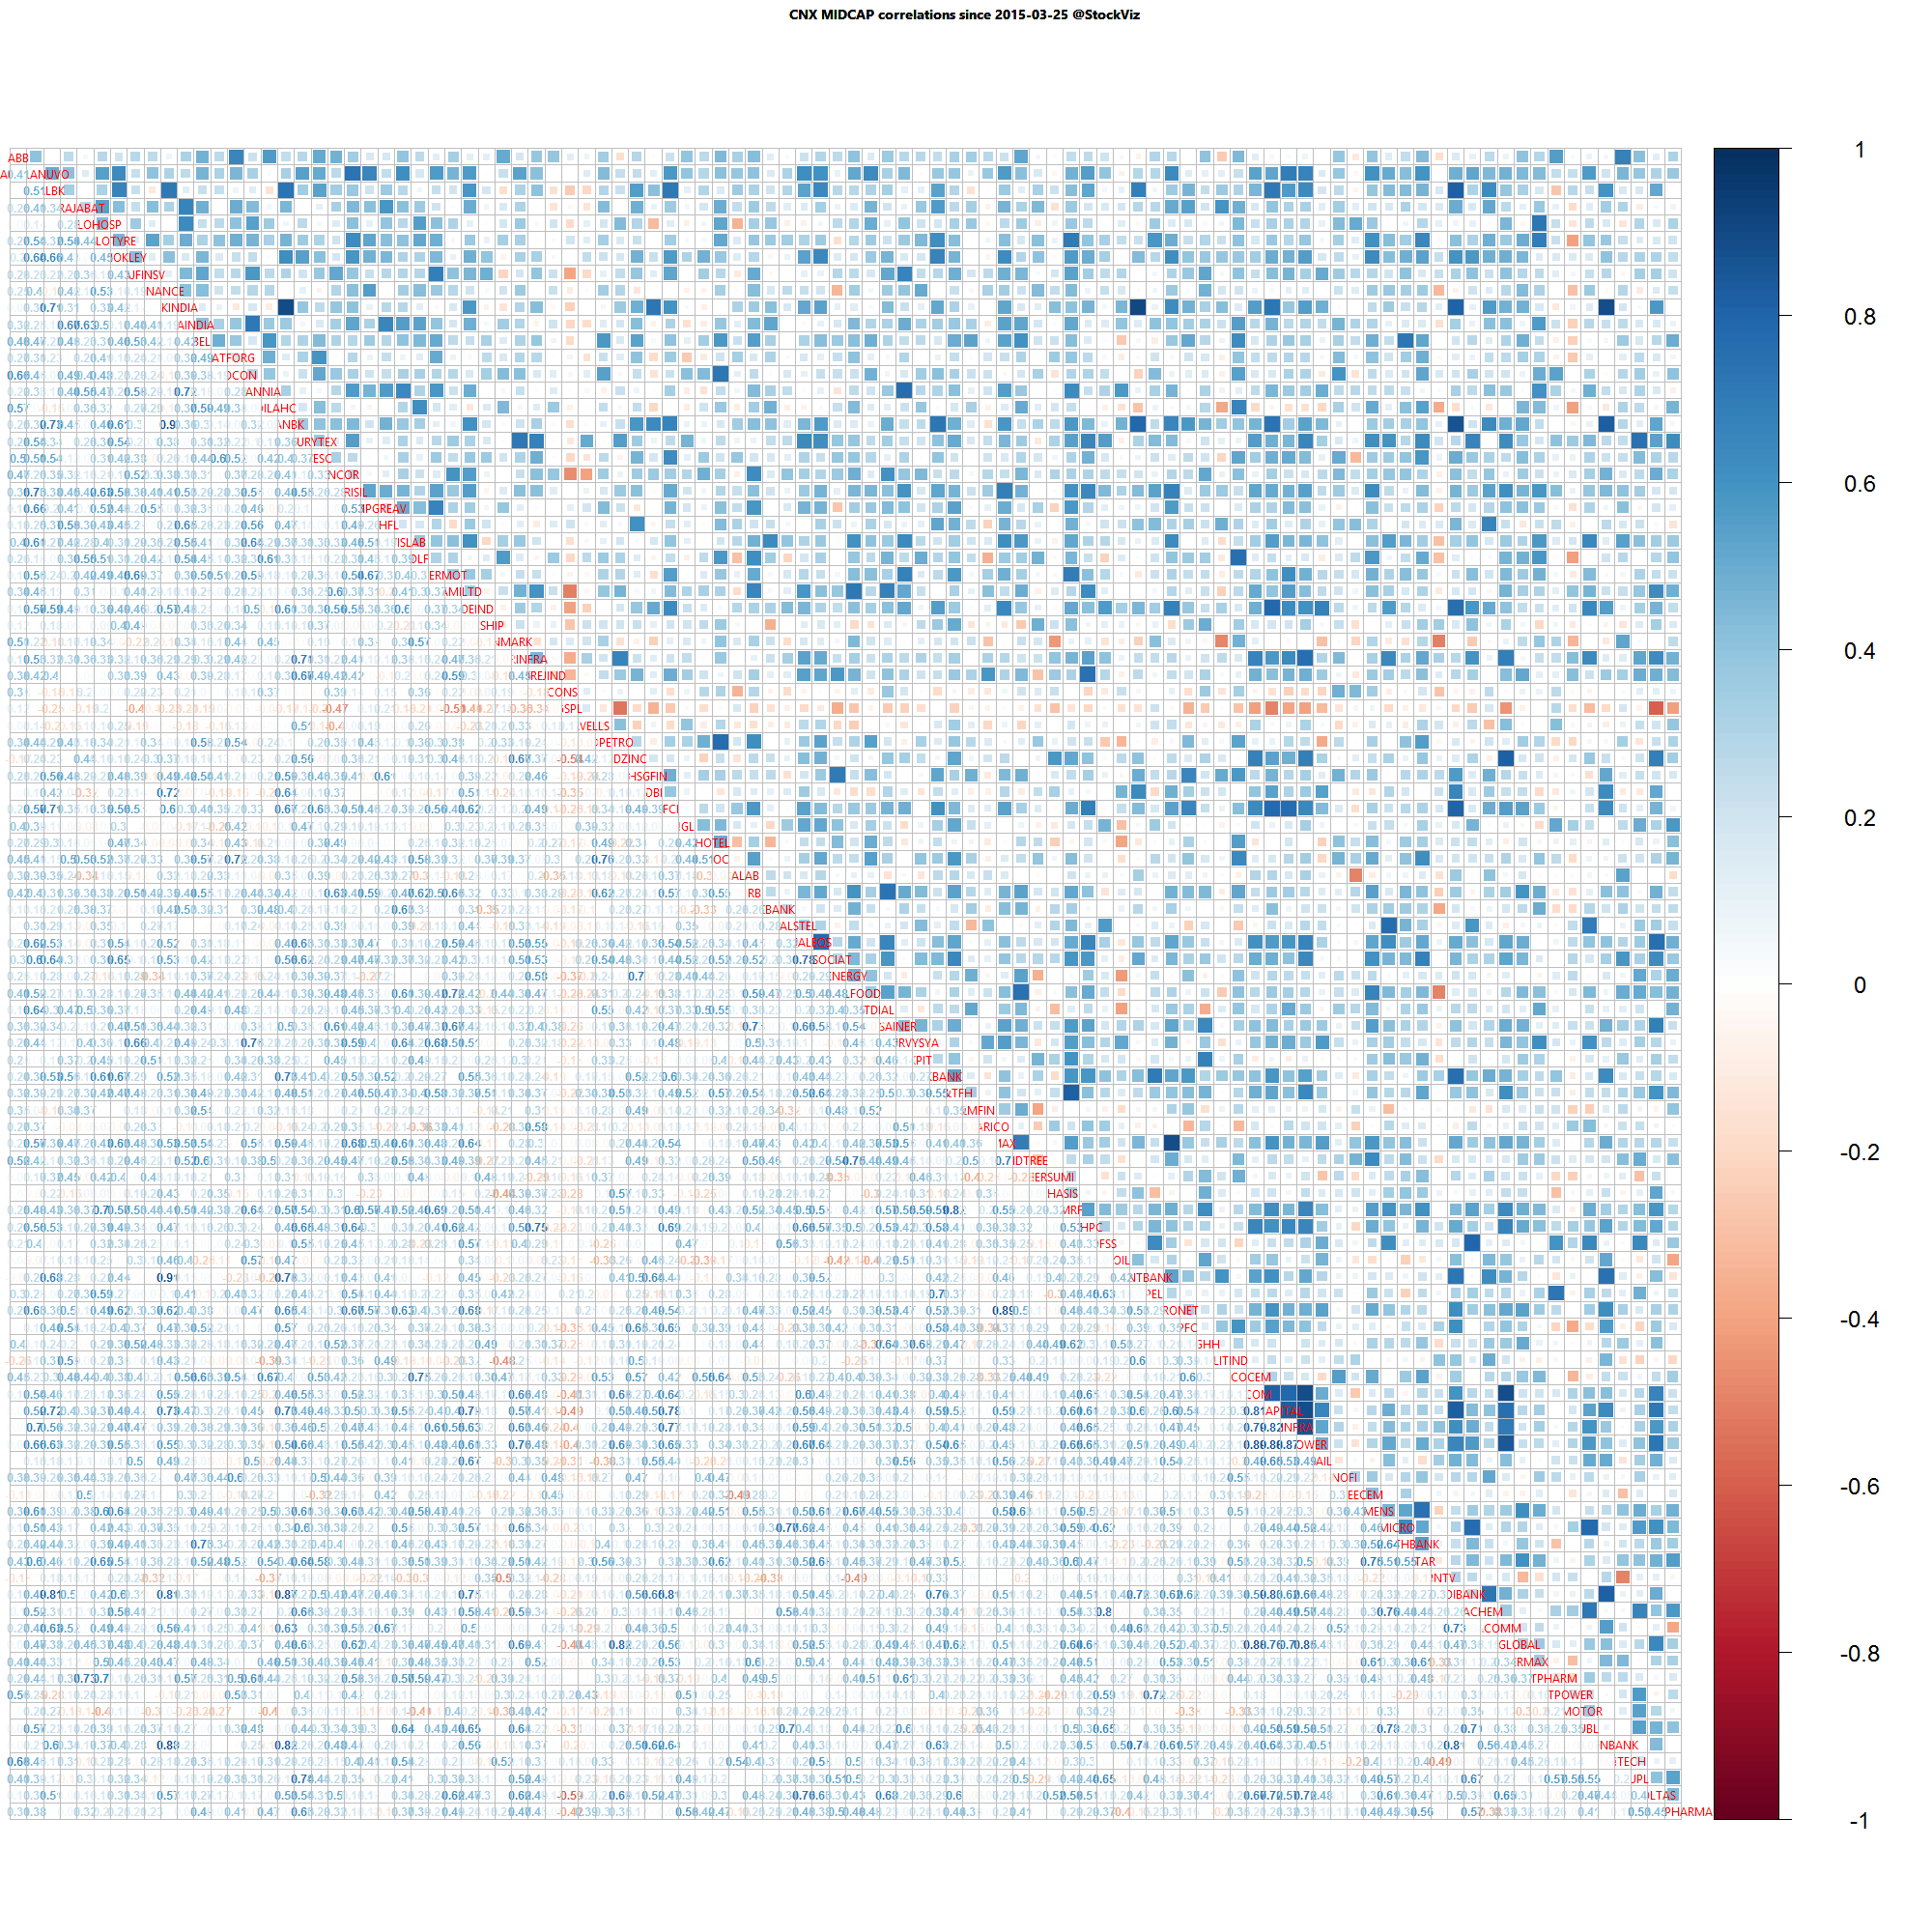
Midcap one year daily return correlations

Midcap one year daily return correlations

Midcap one month daily return correlations

Midcap one month daily return correlations

A lot of thick blue squares mean that positive correlations are high. Red squares mean negative correlations are high. Whites are the doldrums.

Weekly Recap 18.04.2015

world.2015-4-10.2015-4-17

Equities

Major
DAX(DEU) -5.54%
CAC(FRA) -1.85%
UKX(GBR) -1.34%
NKY(JPN) -1.28%
SPX(USA) -0.98%
MINTs
JCI(IDN) -1.47%
INMEX(MEX) +0.21%
NGSEINDX(NGA) +0.22%
XU030(TUR) -0.29%
BRICS
IBOV(BRA) -0.40%
SHCOMP(CHN) +6.27%
NIFTY(IND) -1.99%
INDEXCF(RUS) -0.03%
TOP40(ZAF) +0.76%

Commodities

Energy
Brent Crude Oil +10.29%
RBOB Gasoline +7.53%
WTI Crude Oil +9.18%
Ethanol +3.14%
Natural Gas +5.26%
Heating Oil +7.64%
Metals
Copper +1.82%
Gold 100oz -0.26%
Silver 5000oz +0.62%
Palladium +1.02%
Platinum -0.04%

Currencies

USDEUR:-2.00% USDJPY:-1.11%

MINTs
USDIDR(IDN) -0.60%
USDMXN(MEX) +0.89%
USDNGN(NGA) -0.04%
USDTRY(TUR) +1.81%
BRICS
USDBRL(BRA) -1.57%
USDCNY(CHN) -0.17%
USDINR(IND) +0.07%
USDRUB(RUS) -2.66%
USDZAR(ZAF) +0.76%
Agricultural
Cotton -2.53%
Orange Juice +3.22%
Soybeans +1.79%
Cattle -0.63%
Cocoa -0.05%
Coffee (Robusta) -0.66%
Soybean Meal +1.71%
Corn +0.66%
Lean Hogs +12.76%
Sugar #11 +2.10%
Coffee (Arabica) +3.00%
Feeder Cattle +0.28%
Lumber -7.98%
Wheat -6.23%
White Sugar +1.78%

Credit Indices

Index Change
Markit CDX EM -0.13%
Markit CDX NA HY -0.08%
Markit CDX NA IG +0.10%
Markit iTraxx Asia ex-Japan IG +0.96%
Markit iTraxx Australia +0.03%
Markit iTraxx Europe -0.46%
Markit iTraxx Europe Crossover +1.35%
Markit iTraxx Japan -3.42%
Markit iTraxx SovX Western Europe +0.69%
Markit LCDX (Loan CDS) -0.02%
Markit MCDX (Municipal CDS) -2.29%
Nifty looks benign compared to what hit the broader market. Friday was especially brutal for the German DAX and the negative sentiment might spillover to the Asian markets on Monday. However, the Shanghai Composite seems to be on another planet altogether…

Nifty Heatmap

CNX NIFTY.2015-4-10.2015-4-17

Index Returns

index performance.2015-4-10.2015-4-17

Advance Decline

advance.decline.line2.2015-4-10.2015-4-17

Market Cap Decile Performance

Decile Mkt. Cap. Adv/Decl
1 (micro) -2.71% 76/59
2 +3.43% 71/63
3 +2.70% 74/60
4 +2.47% 69/66
5 +1.37% 70/64
6 +1.34% 66/68
7 +0.36% 66/69
8 +0.41% 73/61
9 -0.36% 69/65
10 (mega) -0.99% 67/68
Large caps got hammered…

Top Winners and Losers

SSLT +4.40%
ONGC +6.54%
OIL +11.39%
BHARATFORG -10.11%
LUPIN -9.88%
SRTRANSFIN -9.75%
Bharat Forge and Lupin got shellacked by downgrades…

ETF Performance

PSUBNKBEES +3.39%
GOLDBEES +0.41%
CPSEETF -0.28%
INFRABEES -0.93%
NIFTYBEES -1.54%
BANKBEES -2.24%
JUNIORBEES -3.26%
Note the divergence between PSU banks and the overall banking sector. Puzzling…

Yield Curve

yield Curve.2015-4-10.2015-4-17

Bond Indices

Sub Index Change in YTM Total Return(%)
GSEC TB -0.01 +0.15%
GSEC SUB 1-3 -0.63 -0.31%
GSEC SUB 3-8 -0.06 -0.04%
GSEC SUB 8 +0.01 +0.24%
The long-end caught a bid…

Investment Theme Performance

Equity Mutual Funds

Bond Mutual Funds

Trying to make up your mind about StockViz?

Check this video out:
https://youtu.be/kDTmvWDseMY