Category: Your Money

Replacing Mutual Funds with ETFs

Last month, we took a stab at measuring a fund’s alpha over a basket of ETFs (link.) The rationale was that the index often chosen by the mutual fund is not easily accessible to the investor. We saw how mutual fund alpha varies over time. We then asked the question: What if we just invested in the basket instead of buying the fund?

We did a study of the top 10 equity mutual funds by AUM back in March-2011 and found that 4 out of 10 funds under-performed their ETF baskets and 2 out of 10 funds could be replaced by an ETF basket without compromising too much on returns. That is, only 4 out of 10 fund out-performed the ETF basket setup for them.

The code, inputs and results are on github.

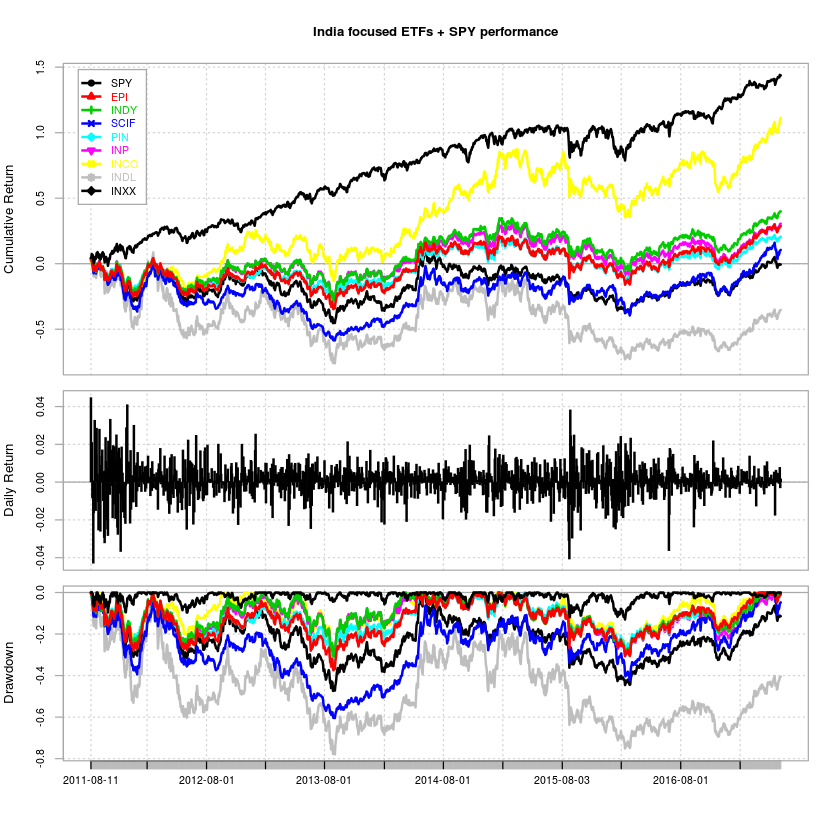
US$ Indian ETFs vs. SPY

Indian bull vs. the US bull since 2012:

SYMBOL Cumulative Returns Annualized Returns
SPY
115.63
15.25
EPI
70.47
10.36
INDY
78.93
11.35
SCIF
74.11
10.79
PIN
50.53
7.85
INP
68.36
10.10
INCO
164.49
19.69
INDL
20.98
3.58
INXX
38.16
6.15

Investing in the Indian story has been a drag on returns for US$ ETF investors.

The code is on github.

IPOs: An Update

Retail news outlets are once again gaga over phenomenal listing day returns of IPOs. Investors will do well to take a step back and take in the scene:

  • Median listing day returns since 2010 has been 1.22%
  • The best year (since 2010) was 2014 with median returns of 1.435%; the worst being 2012 with -2.76%
  • Picking winners over a large sample size (the listed universe) is easier than picking from a smaller lot of IPOs
    • The code and data is on github.

Fund Alpha Over ETF Baskets

A fund’s alpha – returns over a benchmark – is often quoted and widely misunderstood. The root of the misunderstanding comes from investors assuming that alpha is a constant – which it is not – and the funds using benchmarks that the investors cannot actually invest in. Even if an investor decides to go “passive,” there is still an active choice that needs to be made regarding the basket of ETFs he needs to invest in. Let’s answer the first question: What exactly is the active manager’s value add?

Alpha over a basket of ETFs

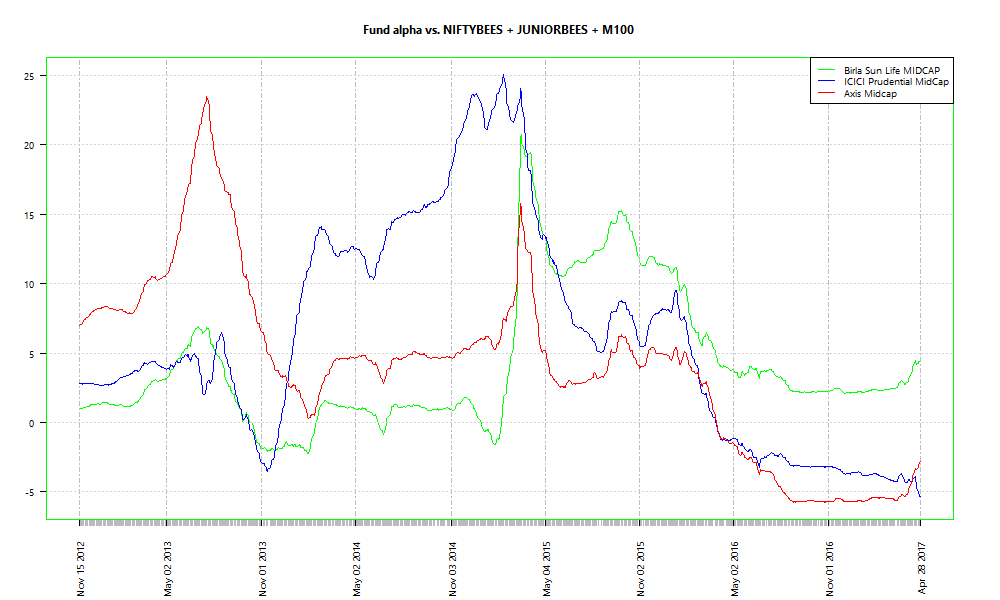
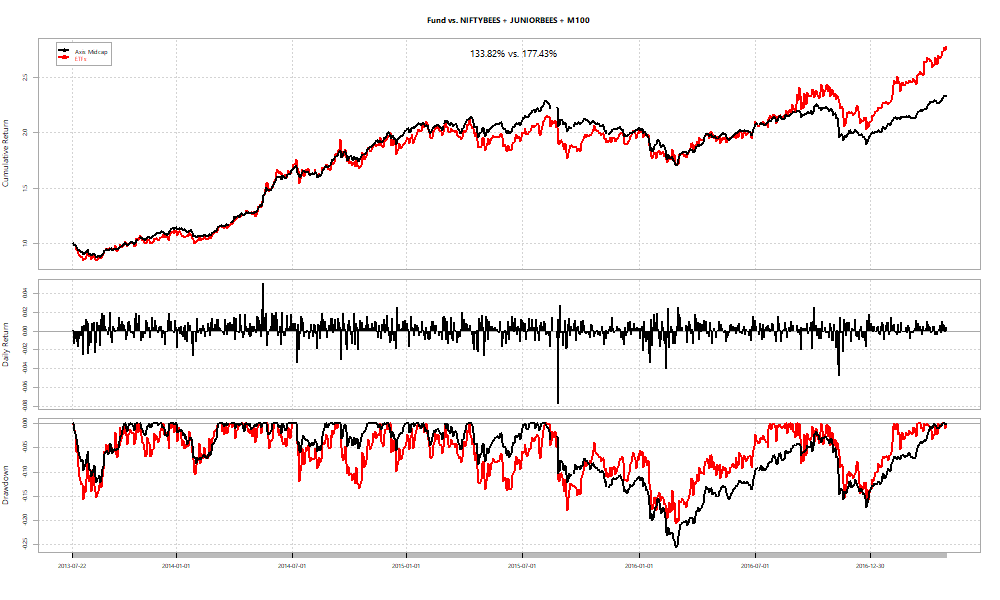
We select three ETFs, NIFTYBEES, JUNIORBEES and M100, since they are popular and span a fairly decent spectrum of traded stocks in the market. Then, we do a rolling (window of 200) linear regression of returns over 200 days of a few midcap funds (selected at random.) The intercept is the alpha of the fund vs. the ETFs. Here’s how the alpha varies over a period of time:

Two out of the three funds have negative alpha over the ETF basket right now. However, that doesn’t mean that they will stay there.

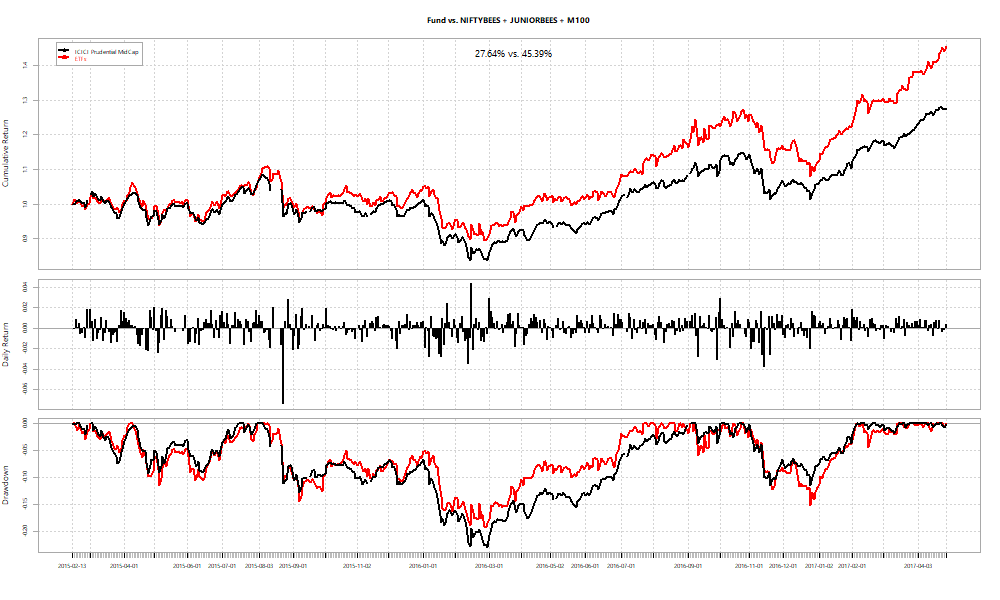
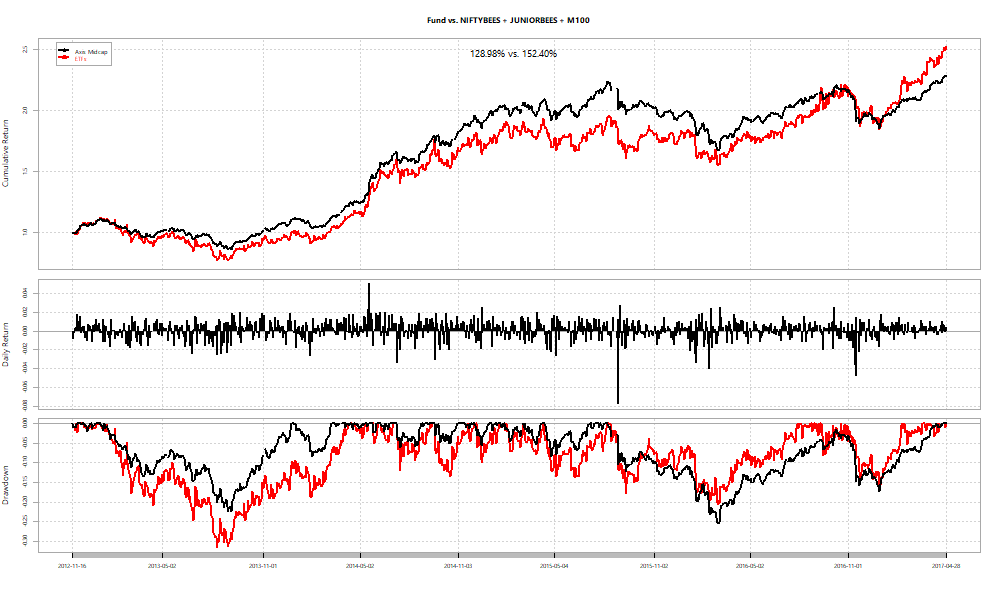
As an investor, you can use the betas obtained by the regression over the ETFs to “replicate” the fund at a point in time. For example, if you set the start date as the date at which each of the funds had peak alpha and just held onto the basket, here’s how the relative performances look:

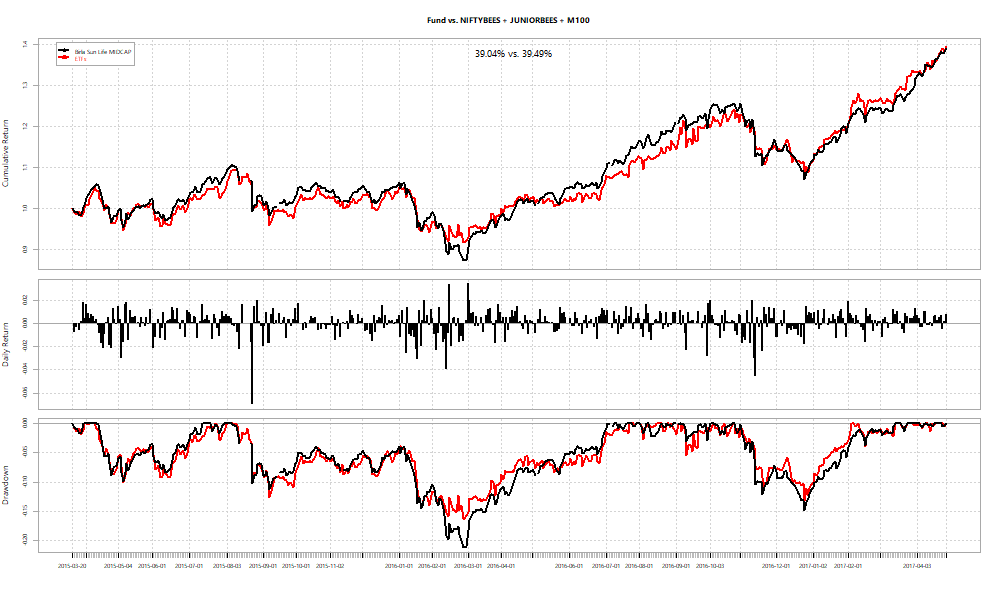
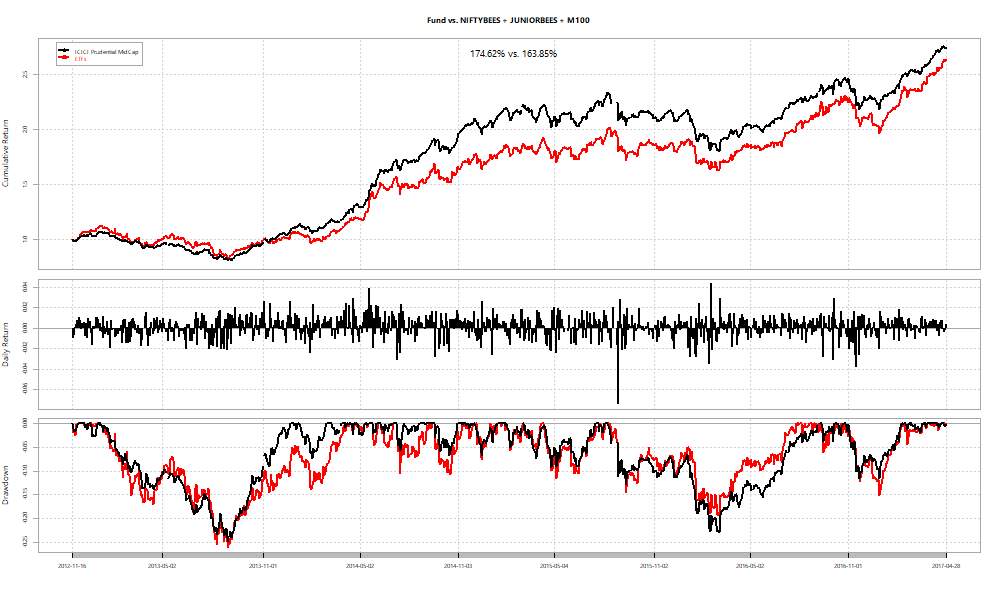
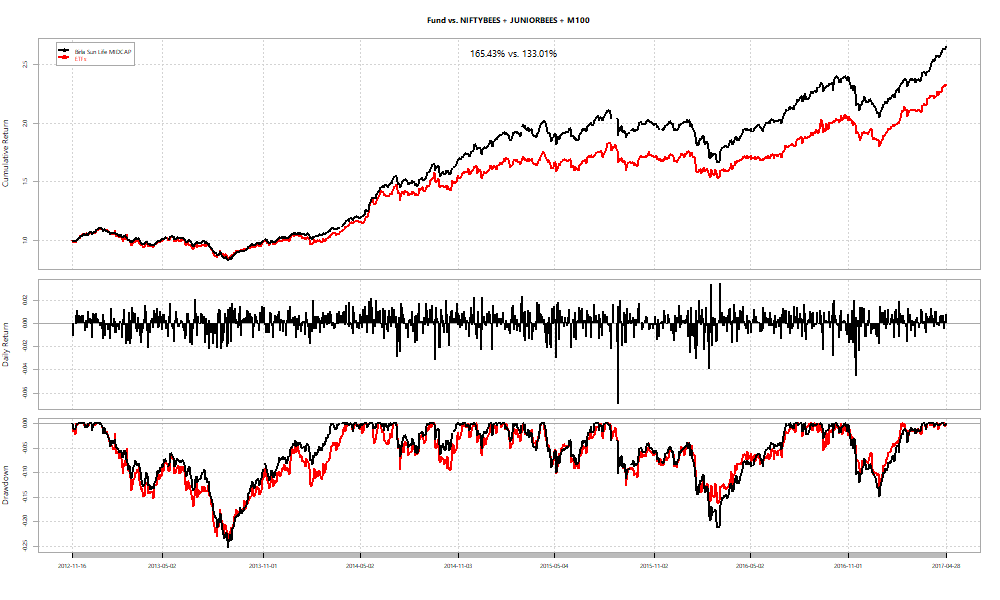
In all cases the basket fixed at the peak performs at par or better than the fund. However, you never really know what the “peak” is when you are living through it. What if you fix the basket right at the beginning?

In two out of three cases, we see funds beat ETF baskets.

Summary

  • We use linear regression to measure a fund’s alpha over a basket of ETFs.
  • Alpha varies over time. Out/under performance is sensitive to begin and end dates.
  • If a fund’s peak alpha can be pegged, then a basket of ETFs with those betas will outperform the fund.

Monthly Recap: April in Paris

Equities

Major
DAX(DEU) +1.02%
CAC(FRA) +2.83%
UKX(GBR) -1.62%
NKY(JPN) +1.98%
SPX(USA) +0.82%
MINTs
JCI(IDN) +2.10%
INMEX(MEX) +1.49%
NGSEINDX(NGA) +0.98%
XU030(TUR) +7.02%
BRICS
IBOV(BRA) -0.01%
SHCOMP(CHN) -2.11%
NIFTY(IND) +1.42%
INDEXCF(RUS) +1.04%
TOP40(ZAF) +4.22%

Commodities

Energy
Brent Crude Oil -1.74%
Ethanol -2.63%
WTI Crude Oil -2.99%
RBOB Gasoline -9.46%
Heating Oil -4.41%
Natural Gas +2.79%
Metals
Platinum -0.92%
Copper -2.26%
Silver 5000oz -5.52%
Palladium +3.04%
Gold 100oz +1.11%

Currencies

USDEUR:-1.89% USDJPY:+0.36%

MINTs
USDIDR(IDN) +0.05%
USDMXN(MEX) +0.55%
USDNGN(NGA) -1.51%
USDTRY(TUR) -2.06%
BRICS
USDBRL(BRA) +1.36%
USDCNY(CHN) +0.09%
USDINR(IND) -0.93%
USDRUB(RUS) +1.21%
USDZAR(ZAF) -0.66%
Agricultural
Coffee (Robusta) -10.25%
Feeder Cattle +11.81%
Lumber -0.68%
Sugar #11 -4.27%
Coffee (Arabica) -5.52%
Soybean Meal +1.17%
White Sugar -4.05%
Cattle +3.42%
Cotton +3.72%
Lean Hogs +2.18%
Wheat +0.18%
Cocoa -16.04%
Corn -0.75%
Orange Juice +2.10%
Soybeans +0.58%

International ETFs (USD)

Nifty Heatmap

Index Returns


More: Sector Dashboard

Market Cap Decile Performance


More: Equal-Weight Deciles, Cap-Weight Deciles

ETF Performance

CPSEETF +6.70%
INFRABEES +6.18%
JUNIORBEES +5.37%
BANKBEES +4.10%
PSUBNKBEES +3.35%
NIFTYBEES +1.24%
PSEs… because this time its different.

Yield Curve

Bond Indices

Sub Index Change in YTM Total Return(%)
0 5 +0.23 -0.11%
5 10 +0.16 -0.31%
10 15 +0.11 -0.40%
15 20 +0.06 +0.07%
20 30 +0.10 -0.45%
Bonds down in spite of increased FII flows…

Investment Theme Performance

Value themes out-performed momentum…

Equity Mutual Funds

Bond Mutual Funds

Institutional flows