Equities
| MINTs | |
|---|---|
| JCI(IDN) | +1.98% |
| INMEX(MEX) | +2.60% |
| NGSEINDX(NGA) | -2.46% |
| XU030(TUR) | -1.54% |
| BRICS | |
|---|---|
| IBOV(BRA) | +3.25% |
| SHCOMP(CHN) | +1.39% |
| NIFTY(IND) | +1.21% |
| INDEXCF(RUS) | +5.70% |
| TOP40(ZAF) | +2.14% |
Commodities
| Energy | |
|---|---|
| Brent Crude Oil | +2.06% |
| Ethanol | +1.35% |
| Heating Oil | -1.43% |
| Natural Gas | -8.15% |
| WTI Crude Oil | +2.45% |
| RBOB Gasoline | +4.01% |
| Metals | |
|---|---|
| Silver 5000oz | +0.00% |
| Gold 100oz | +0.15% |
| Copper | -5.56% |
| Palladium | +4.18% |
| Platinum | -0.94% |
Currencies
| MINTs | |
|---|---|
| USDIDR(IDN) | -0.45% |
| USDMXN(MEX) | -1.02% |
| USDNGN(NGA) | +0.76% |
| USDTRY(TUR) | -1.18% |
| BRICS | |
|---|---|
| USDBRL(BRA) | -3.21% |
| USDCNY(CHN) | +0.17% |
| USDINR(IND) | +0.15% |
| USDRUB(RUS) | -3.26% |
| USDZAR(ZAF) | -3.01% |
| Agricultural | |
|---|---|
| Cattle | -0.80% |
| Lumber | +0.68% |
| Wheat | -1.47% |
| Cocoa | +0.26% |
| Coffee (Robusta) | -0.70% |
| Soybeans | -0.32% |
| Sugar #11 | +1.86% |
| White Sugar | +4.94% |
| Corn | +1.32% |
| Feeder Cattle | -6.95% |
| Soybean Meal | -1.84% |
| Coffee (Arabica) | +9.60% |
| Cotton | -2.69% |
| Lean Hogs | +5.30% |
| Orange Juice | -2.26% |
Credit Indices
| Index | Change |
|---|---|
| Markit CDX EM | +0.61% |
| Markit CDX NA HY | +0.54% |
| Markit CDX NA IG | -1.51% |
| Markit iTraxx Asia ex-Japan IG | +2.39% |
| Markit iTraxx Australia | +2.61% |
| Markit iTraxx Europe | -3.07% |
| Markit iTraxx Europe Crossover | -11.47% |
| Markit iTraxx Japan | +3.63% |
| Markit iTraxx SovX Western Europe | -0.51% |
| Markit LCDX (Loan CDS) | +0.00% |
| Markit MCDX (Municipal CDS) | -0.75% |
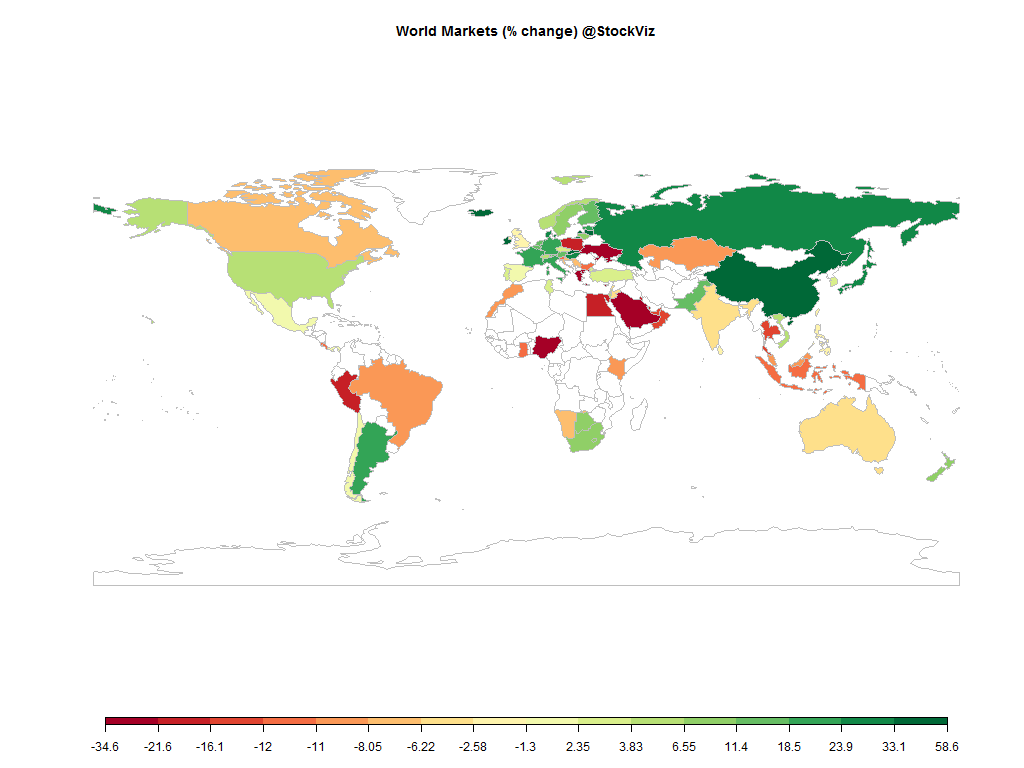
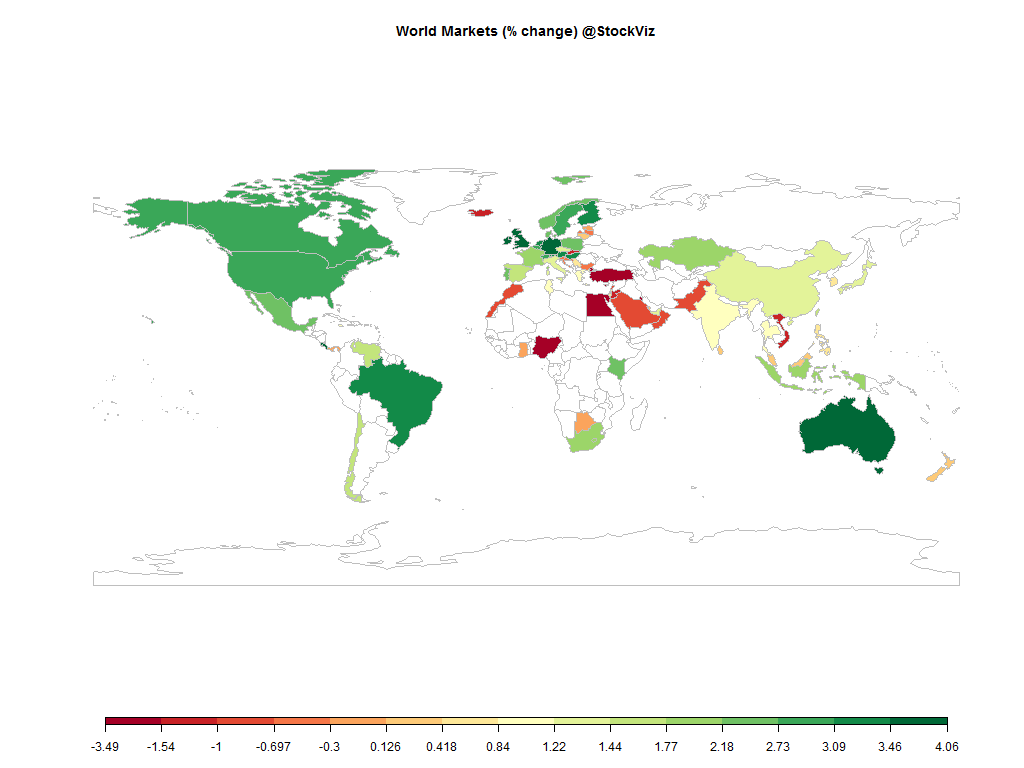
It was a good week for the markets over all. Risk was firmly ON and most markets rallied. The market is expecting a US Fed December liftoff. The USD continued to rally against other major currencies, European bonds dipped in negative-yield territory on rumors of more ECB QE and oil dipped bellow $40 a barrel.
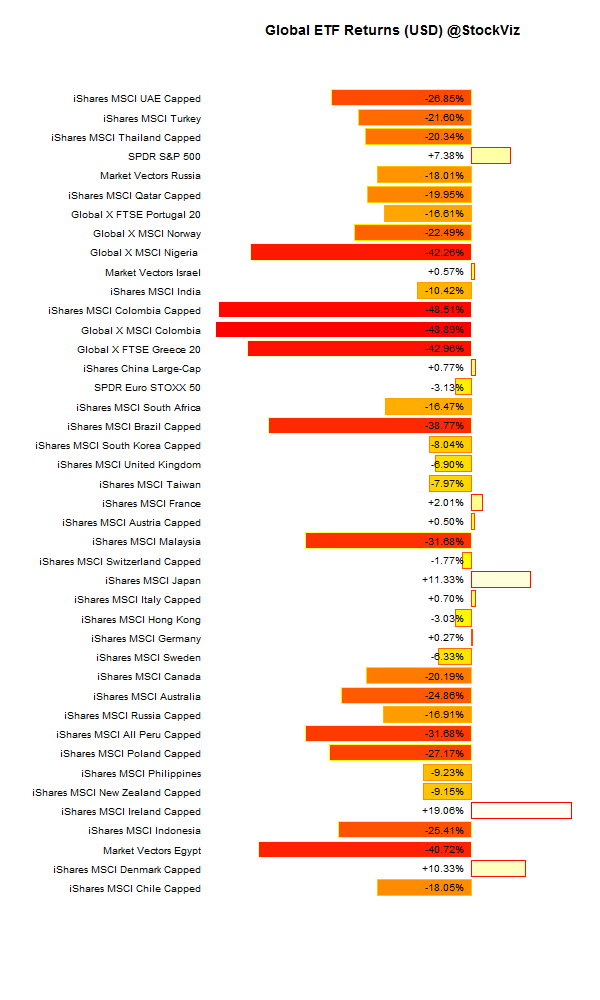
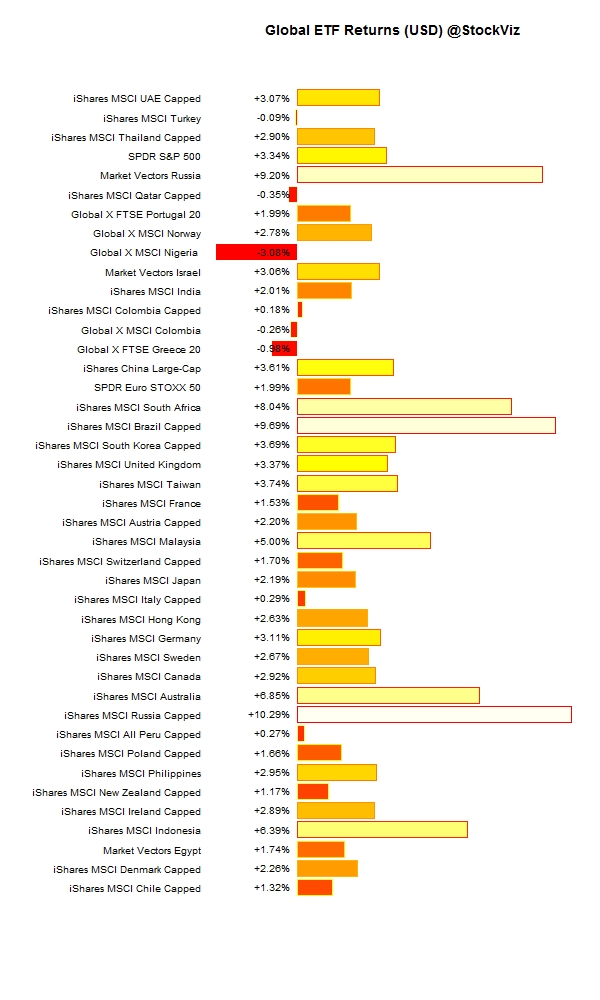
International ETFs (USD)
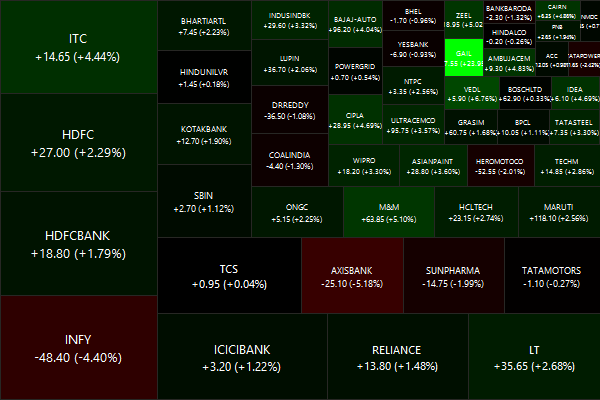
Nifty Heatmap
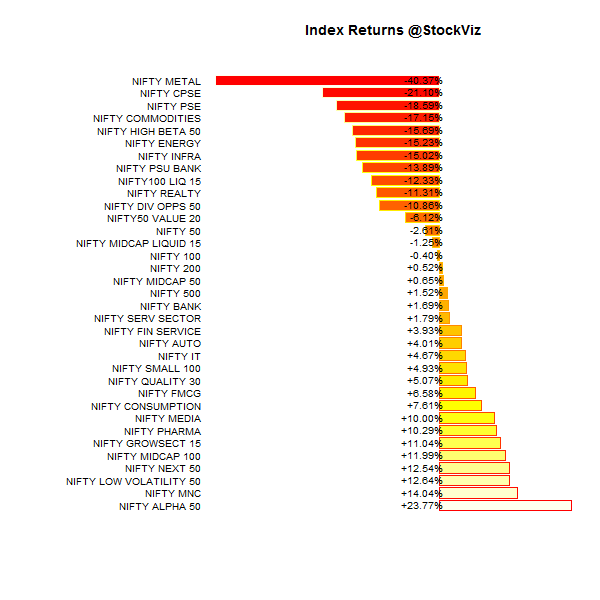
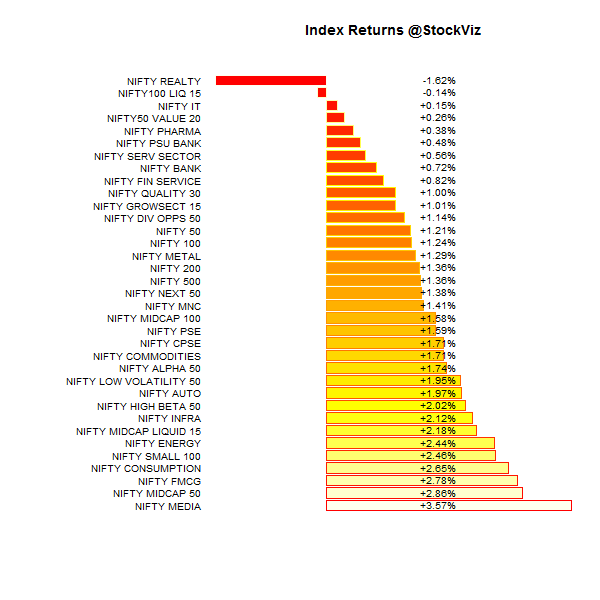
Index Returns
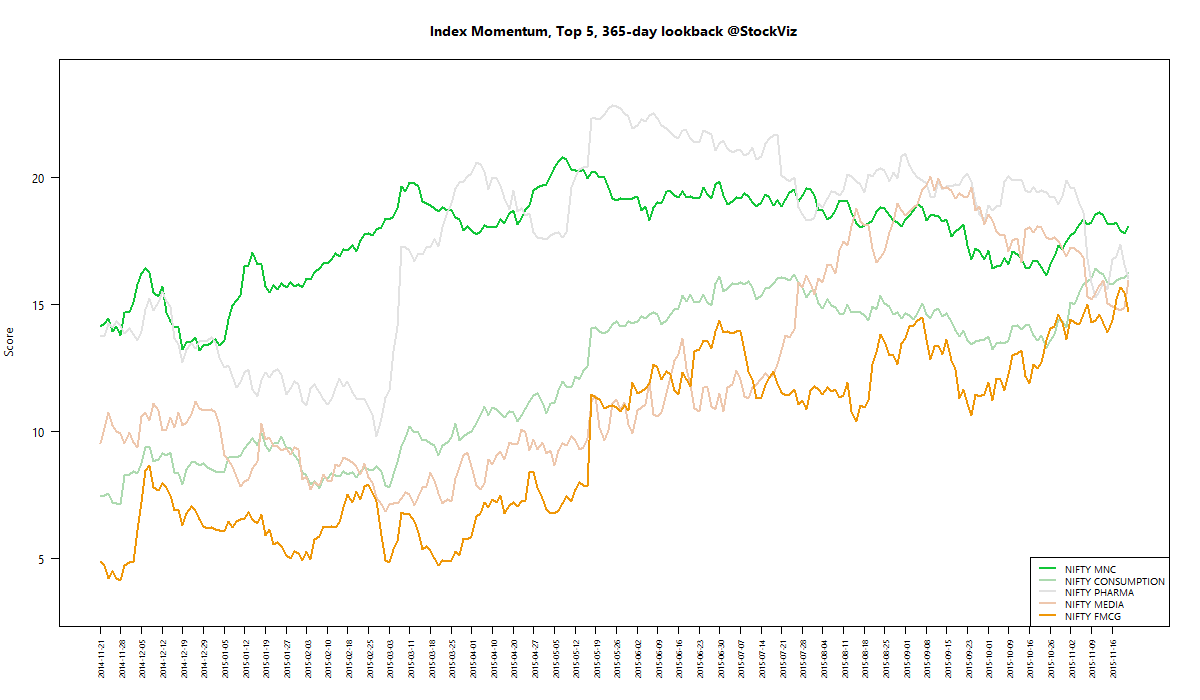
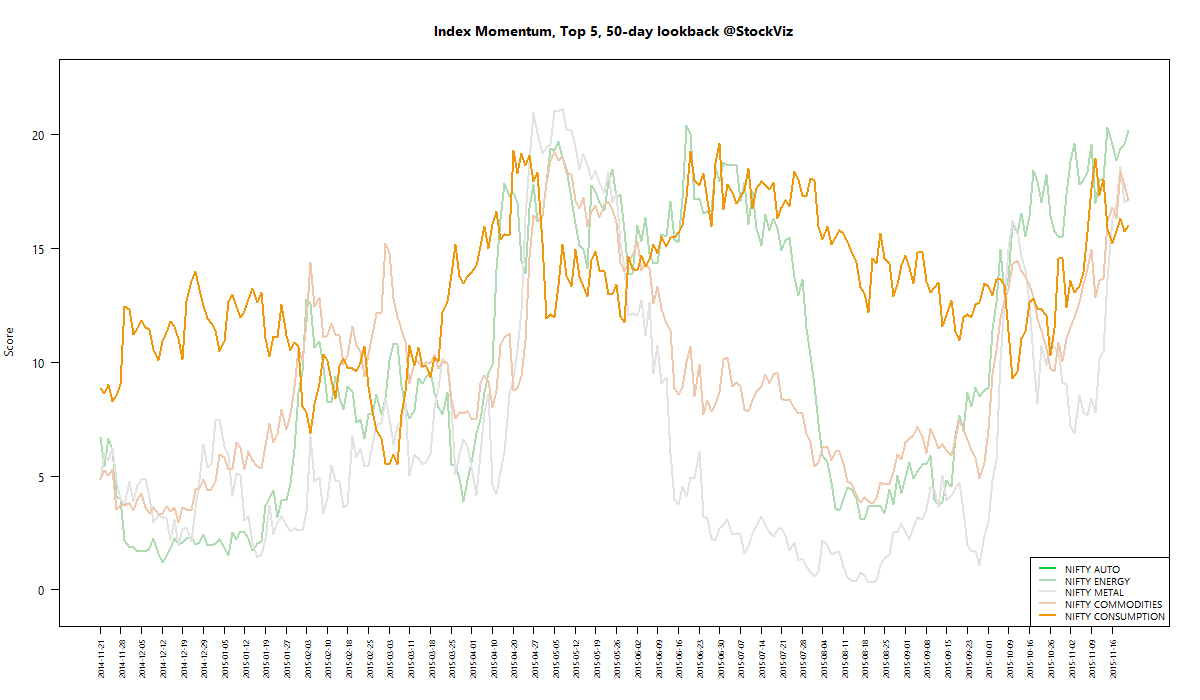
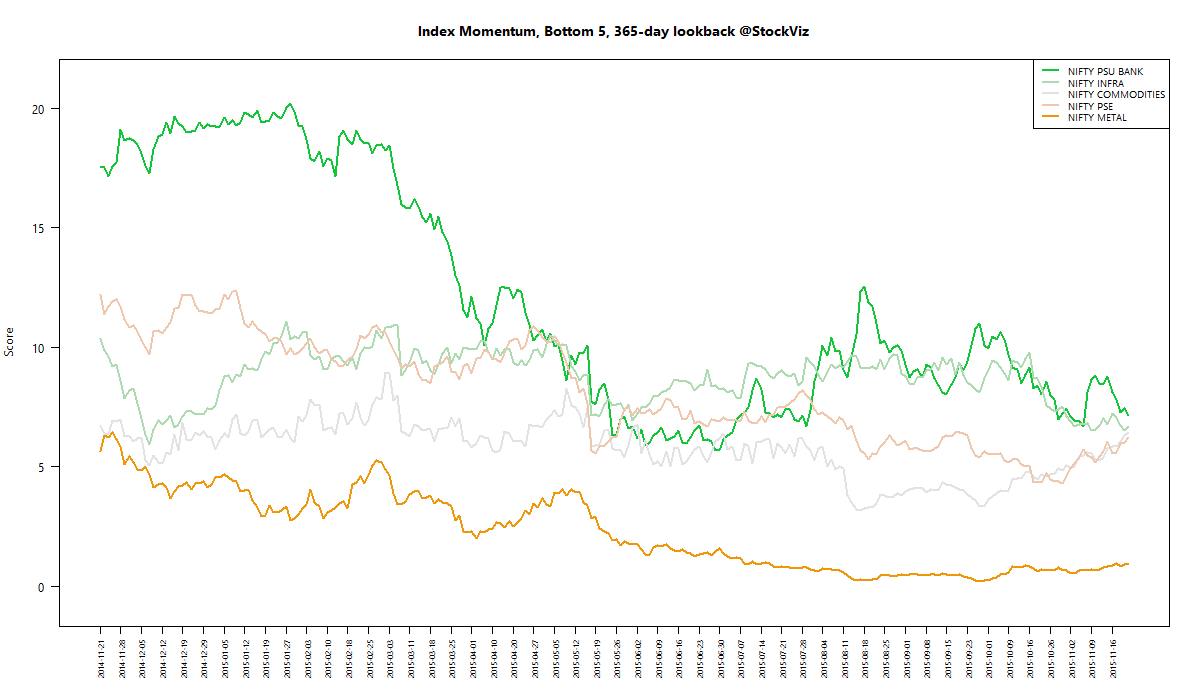
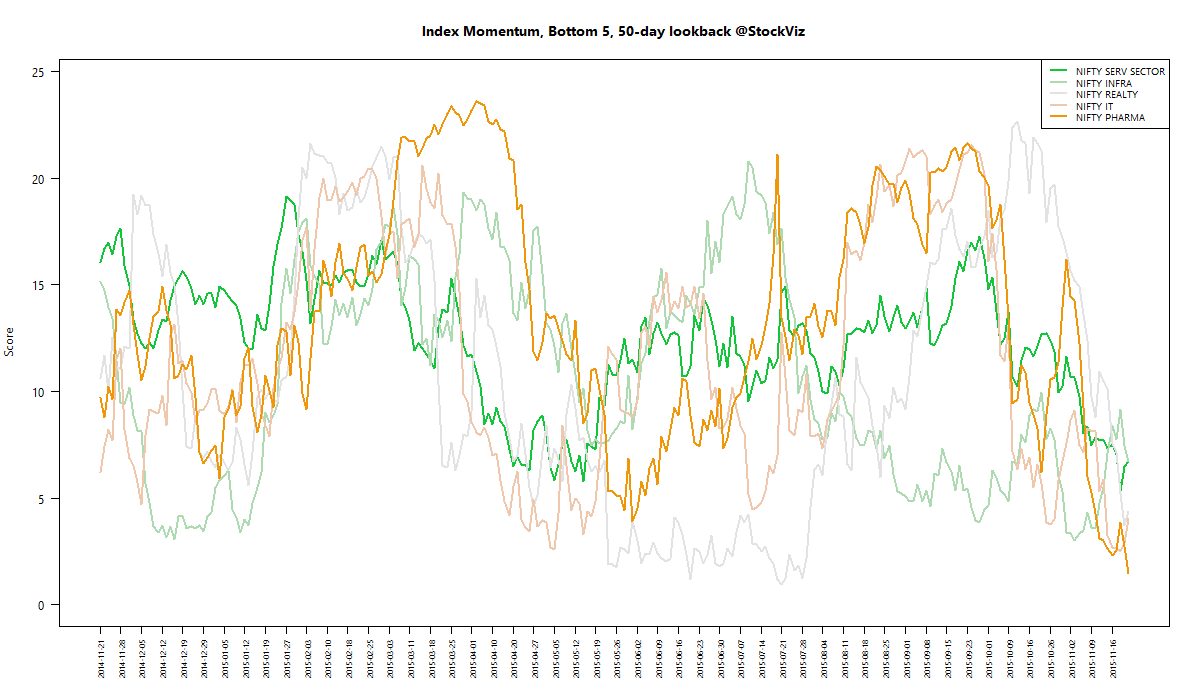
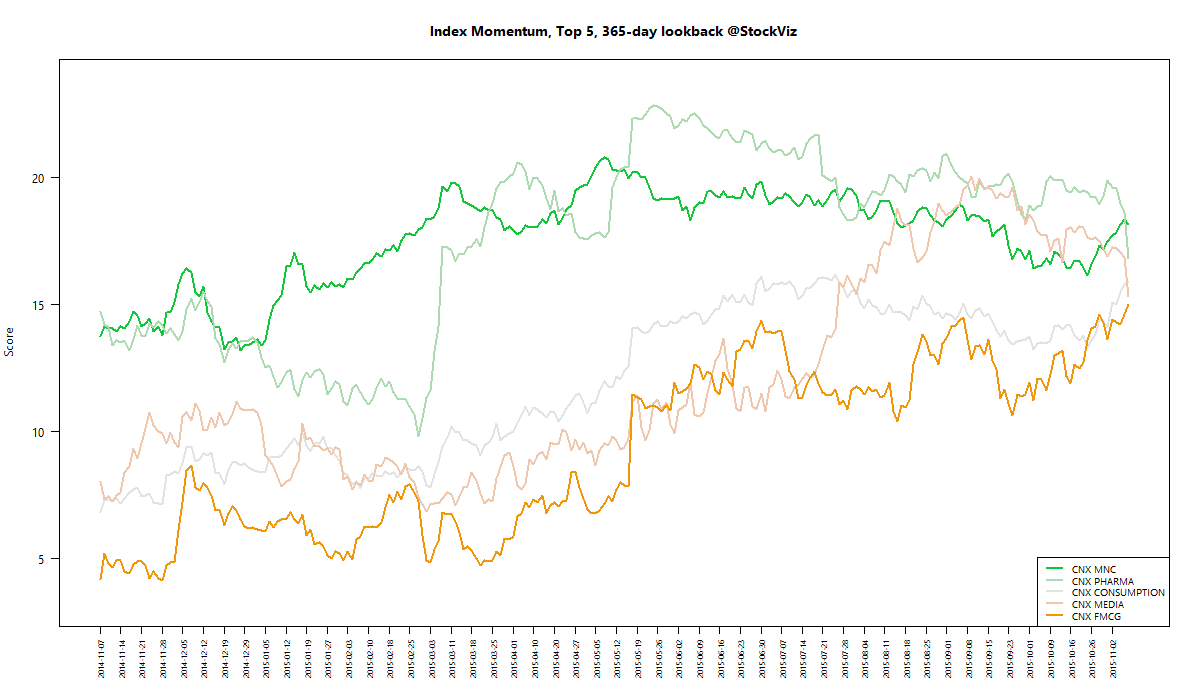
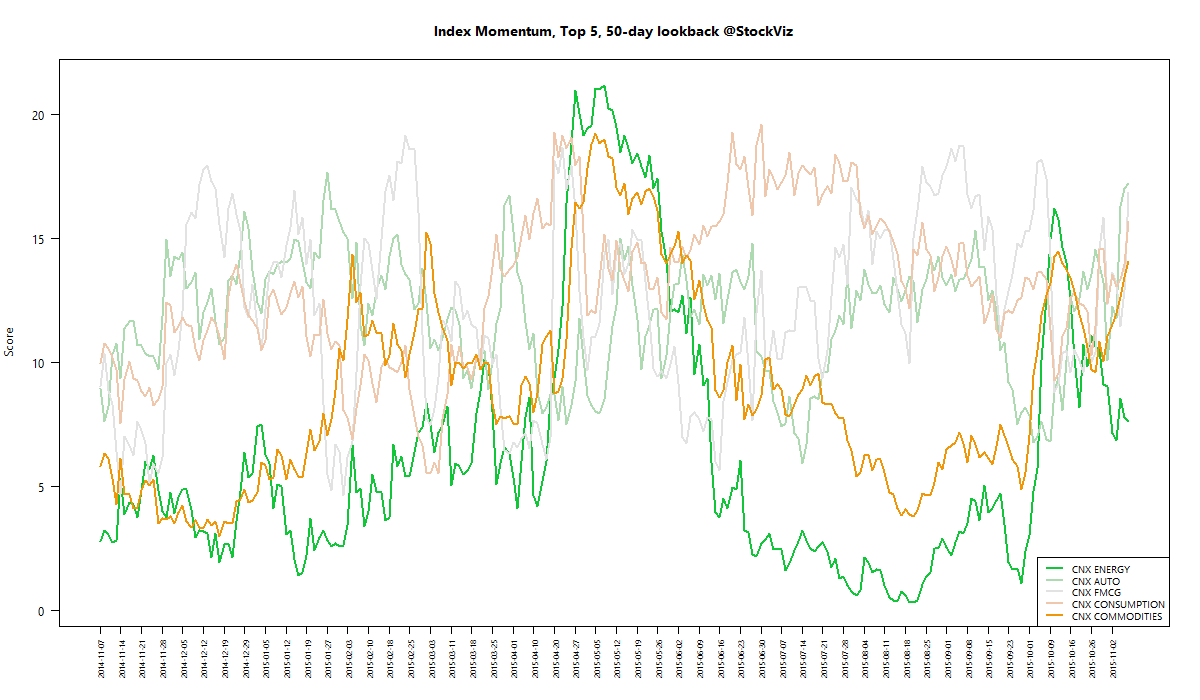
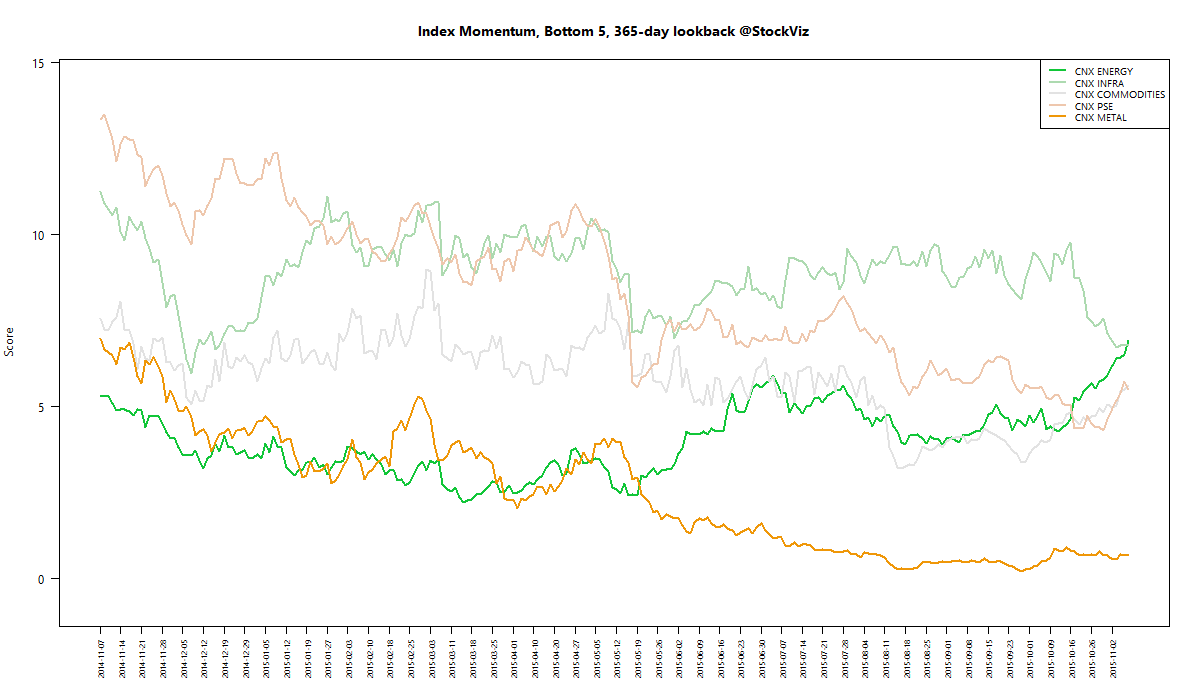
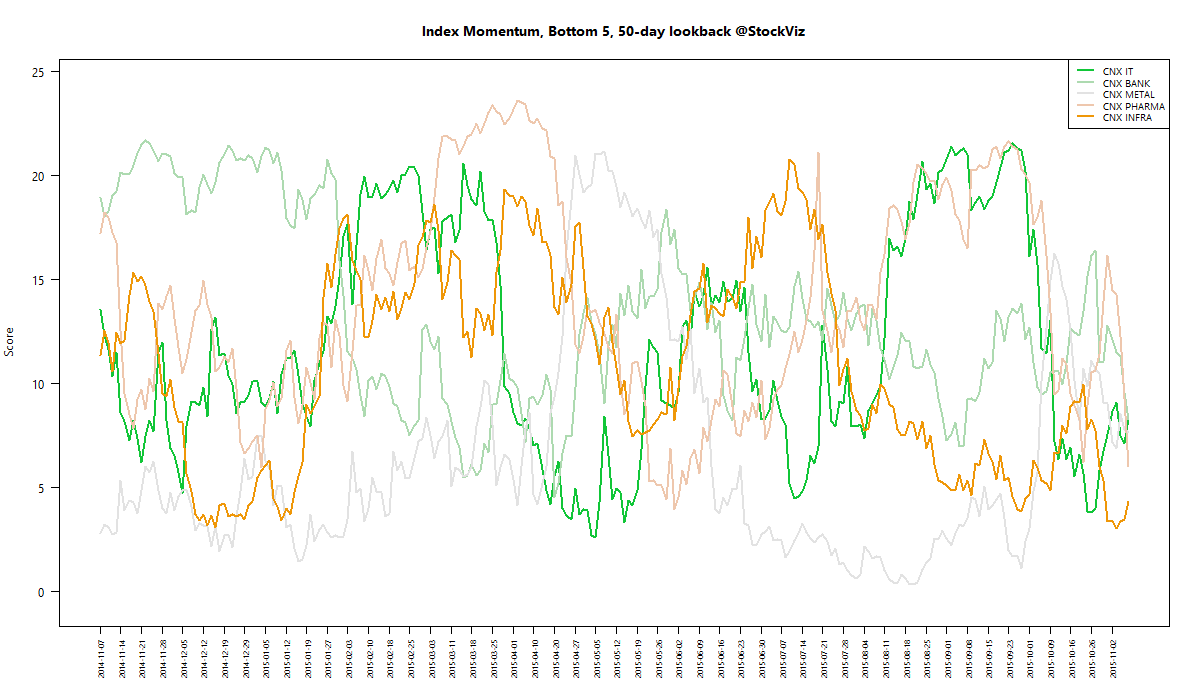
For a deeper dive into indices, check out our weekly Index Update.
Market Cap Decile Performance
| Decile | Mkt. Cap. | Adv/Decl |
|---|---|---|
| 1 (micro) | +2.00% | 66/65 |
| 2 | +5.28% | 70/60 |
| 3 | +2.36% | 65/65 |
| 4 | +2.32% | 74/57 |
| 5 | +1.82% | 68/62 |
| 6 | +2.32% | 69/61 |
| 7 | +1.76% | 69/62 |
| 8 | +1.65% | 63/67 |
| 9 | +1.54% | 70/60 |
| 10 (mega) | +0.95% | 66/65 |
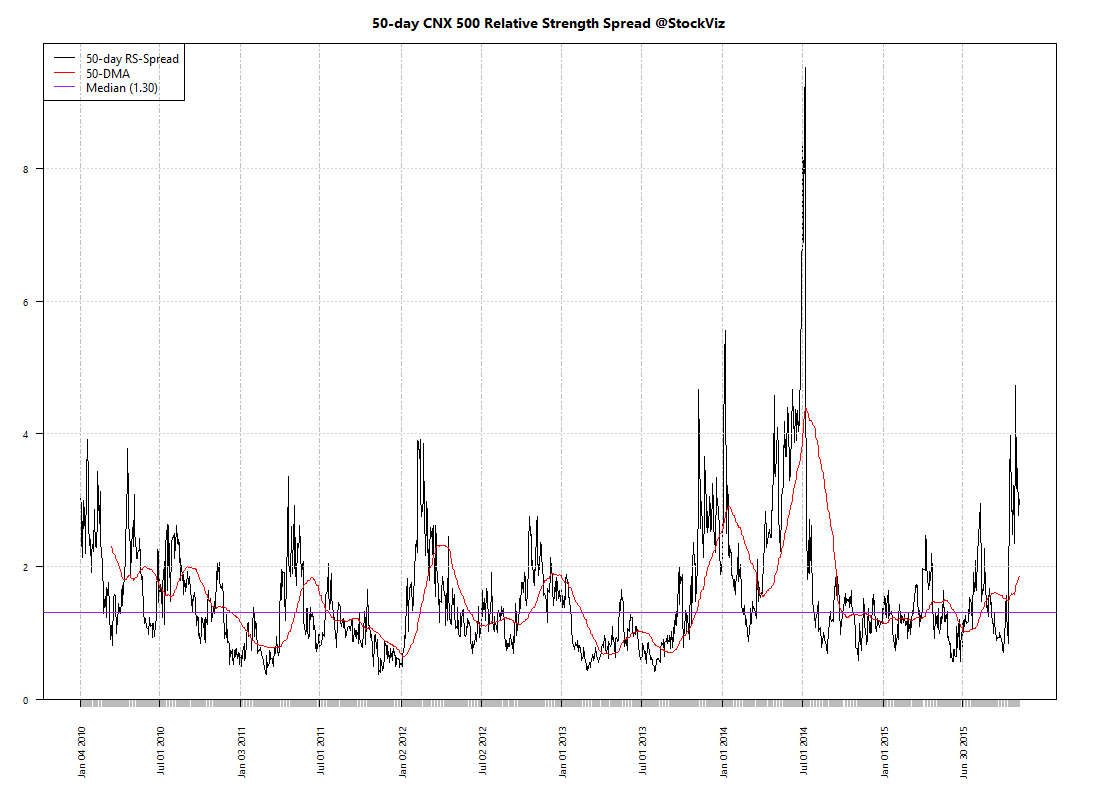
What? Me Worry?
Top Winners and Losers
What happened to AXISBANK? Its down more than 30% since March this year…
ETF Performance
| INFRABEES | +1.67% |
| CPSEETF | +1.59% |
| JUNIORBEES | +1.43% |
| PSUBNKBEES | +1.21% |
| NIFTYBEES | +0.97% |
| BANKBEES | +0.81% |
| GOLDBEES | +0.26% |
Given gold bonds, will GOLDBEES continue?
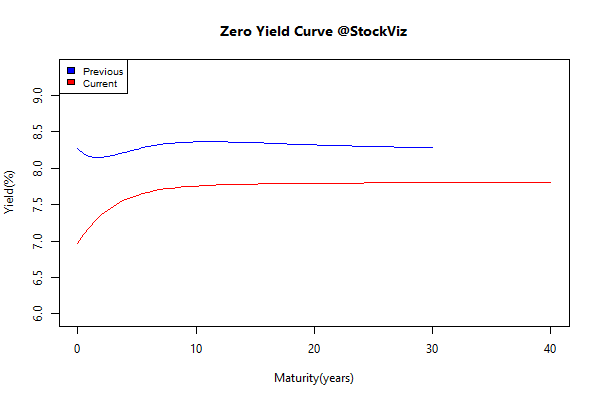
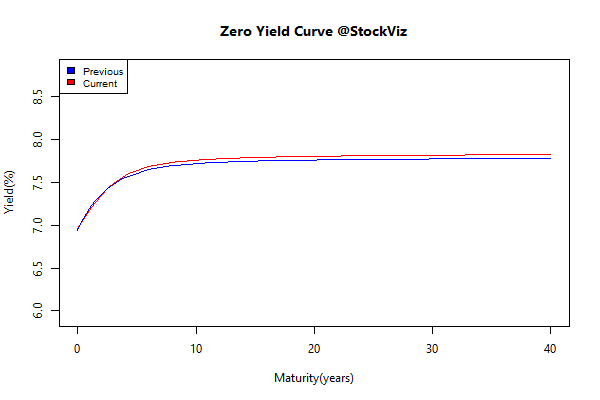
Yield Curve
Bond Indices
| Sub Index | Change in YTM | Total Return(%) |
|---|---|---|
| 0 5 | +0.04 | +0.05% |
| 5 10 | +0.04 | -0.05% |
| 10 15 | +0.03 | -0.10% |
| 15 20 | +0.05 | -0.26% |
| 20 30 | +0.02 | -0.11% |
Bond yields widened – is it the pay-commission effect?
Investment Theme Performance
| Magic Formula | +2.61% |
| Financial Strength Value | +2.51% |
| Next Trillion | +2.37% |
| ASK Life | +2.06% |
| Momentum | +2.02% |
| PPFAS Long Term Value | +1.70% |
| Balance Sheet Strength | +1.20% |
| Velocity | +1.07% |
| Enterprise Yield | +1.02% |
| ADAG stocks | +0.91% |
| High Beta | +0.68% |
| Low Volatility | +0.39% |
| Quality to Price | +0.32% |
| Tactical CNX 100 | -0.00% |
| The RBI Restricted List | -1.55% |
Pretty much every investment strategy ended the week in the green. We introduced a new momentum strategy: Acceleration. Do check it out.
Equity Mutual Funds
Bond Mutual Funds
Thoughts for the weekend
Force yourself to relive the anxiety and worry of being down 5% and wondering if 20% is coming next. Remember what it was like to worry that war might break out or disease was spreading or economic collapse was around the corner. Not because this alone is a good practice, but because it is going to happen again, and sooner than you think. It happens every year like clockwork. You can’t pick a time in history that something scary wasn’t around the corner. You need to hold on to those past moment and then recognize that even though it was truly scary life moved on and markets recovered and the world didn’t, in fact, come to an end.
Source: My Dangerously Selective Memory