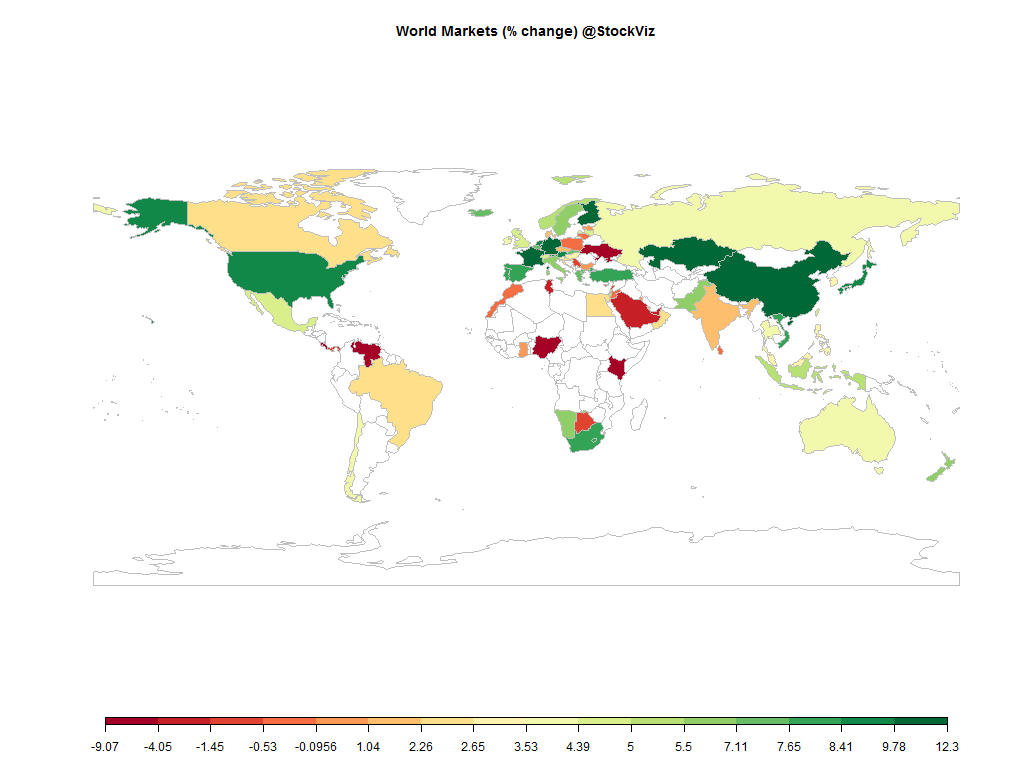
Equities
| MINTs | |
|---|---|
| JCI(IDN) | +5.48% |
| INMEX(MEX) | +4.50% |
| NGSEINDX(NGA) | -6.49% |
| XU030(TUR) | +7.65% |
| BRICS | |
|---|---|
| IBOV(BRA) | +2.42% |
| SHCOMP(CHN) | +10.80% |
| NIFTY(IND) | +1.47% |
| INDEXCF(RUS) | +4.17% |
| TOP40(ZAF) | +7.66% |
Commodities
| Energy | |
|---|---|
| Brent Crude Oil | +2.00% |
| Ethanol | +4.69% |
| Heating Oil | -0.26% |
| Natural Gas | -9.11% |
| RBOB Gasoline | -2.26% |
| WTI Crude Oil | +2.59% |
| Metals | |
|---|---|
| Copper | -1.28% |
| Gold 100oz | +2.37% |
| Palladium | +3.80% |
| Platinum | +8.28% |
| Silver 5000oz | +6.16% |
Currencies
| MINTs | |
|---|---|
| USDIDR(IDN) | -6.61% |
| USDMXN(MEX) | -2.46% |
| USDNGN(NGA) | -0.11% |
| USDTRY(TUR) | -3.67% |
| BRICS | |
|---|---|
| USDBRL(BRA) | -3.49% |
| USDCNY(CHN) | -0.61% |
| USDINR(IND) | -0.50% |
| USDRUB(RUS) | -2.34% |
| USDZAR(ZAF) | -0.31% |
| Agricultural | |
|---|---|
| Cocoa | +2.56% |
| Coffee (Robusta) | +2.48% |
| Lean Hogs | -19.47% |
| Lumber | +11.43% |
| Orange Juice | +27.57% |
| Cotton | +5.45% |
| Feeder Cattle | +7.28% |
| Soybeans | -1.12% |
| Wheat | +1.90% |
| White Sugar | +6.16% |
| Cattle | +11.69% |
| Corn | -1.74% |
| Sugar #11 | +18.90% |
| Coffee (Arabica) | -0.45% |
| Soybean Meal | -1.52% |
Credit Indices
| Index | Change |
|---|---|
| Markit CDX EM | +2.60% |
| Markit CDX NA HY | +0.76% |
| Markit CDX NA IG | -11.30% |
| Markit iTraxx Asia ex-Japan IG | -16.79% |
| Markit iTraxx Australia | -11.81% |
| Markit iTraxx Europe | -14.41% |
| Markit iTraxx Europe Crossover | -100.43% |
| Markit iTraxx Japan | -9.37% |
| Markit iTraxx SovX Western Europe | -4.17% |
| Markit LCDX (Loan CDS) | +0.00% |
| Markit MCDX (Municipal CDS) | -2.55% |
Diwali Muhurat trading session is on Wednesday, November 11, 2015 between 17:45 and 18:45. Happy Diwali!
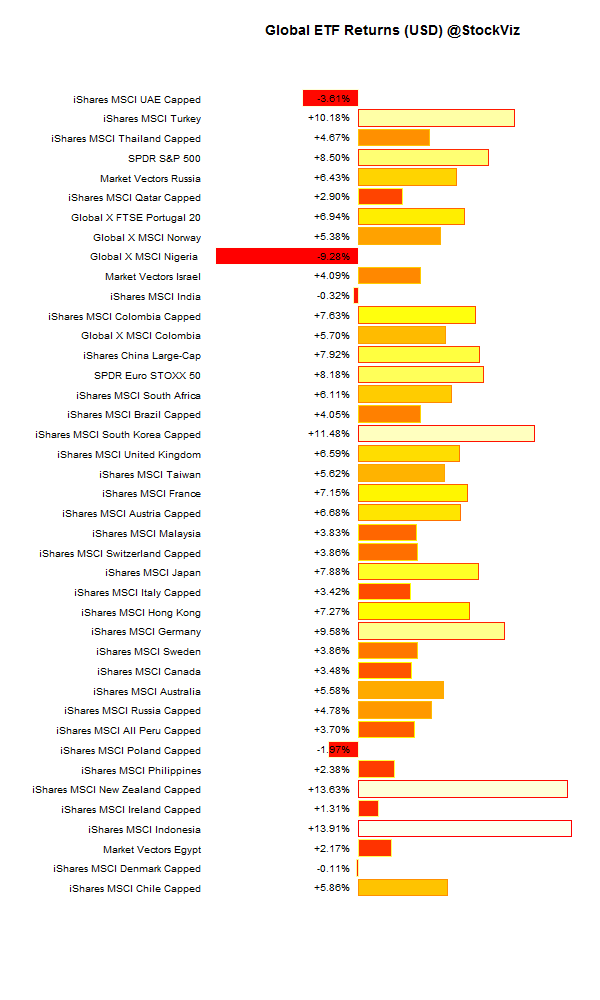
International ETFs (USD)
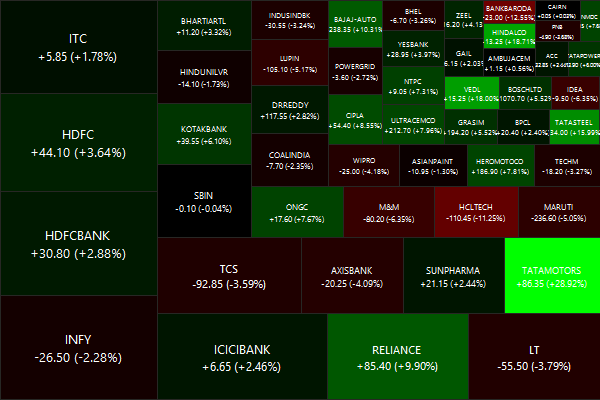
Nifty Heatmap
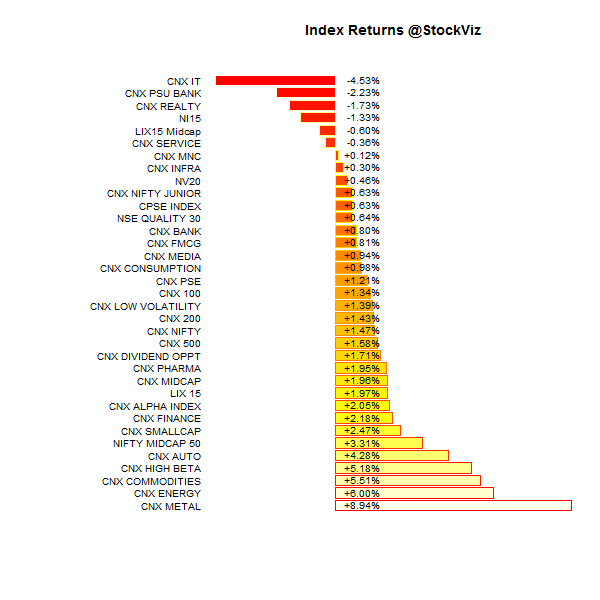
Index Returns
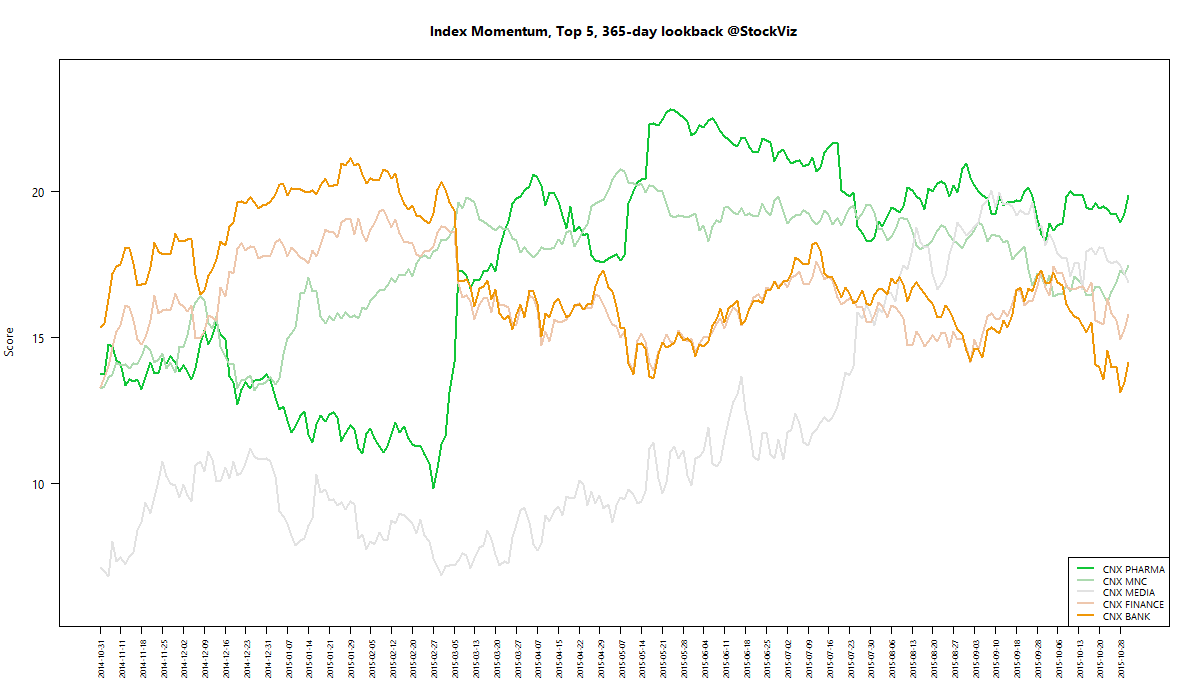
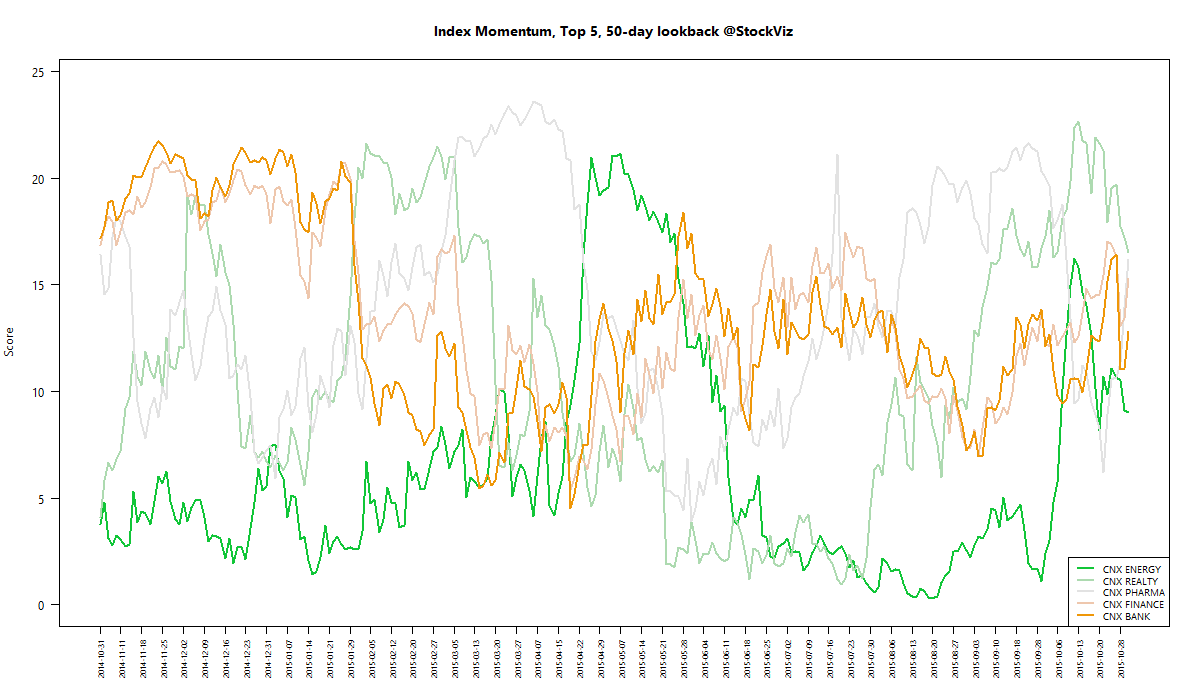
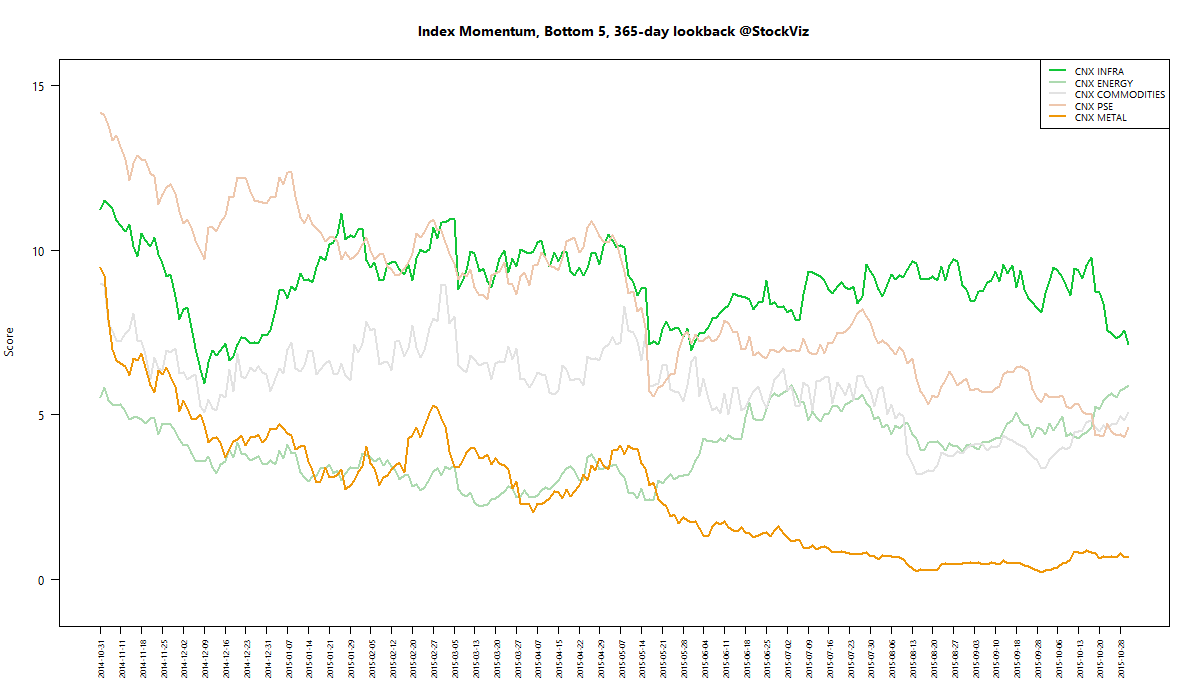
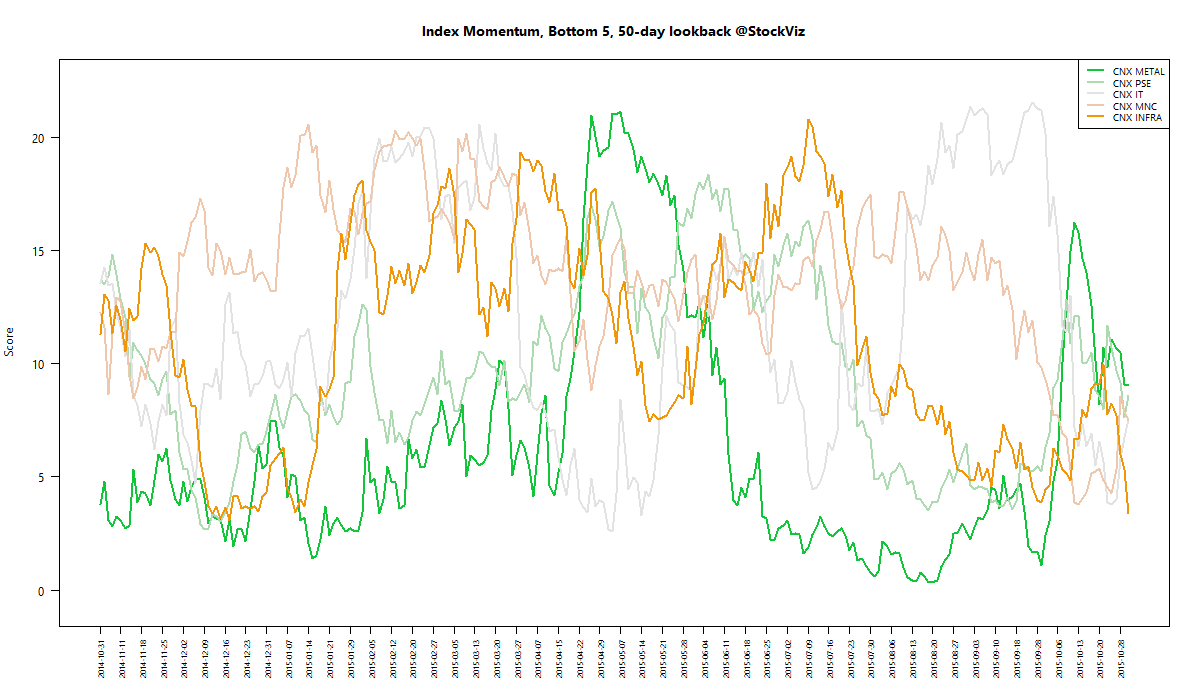
For a deeper dive into indices, check out our weekly Index Update.
Market Cap Decile Performance
| Decile | Mkt. Cap. | Adv/Decl |
|---|---|---|
| 1 | +12.12% | 74/57 |
| 2 | +14.05% | 88/42 |
| 3 | +11.56% | 89/41 |
| 4 | +12.47% | 89/41 |
| 5 | +10.04% | 85/45 |
| 6 | +8.32% | 80/50 |
| 7 | +8.73% | 76/54 |
| 8 | +7.37% | 75/55 |
| 9 | +3.61% | 67/63 |
| 10 | +3.08% | 68/63 |
A solid rally across the board…
Top Winners and Losers
| VEDL | +18.00% |
| HINDALCO | +18.71% |
| TATAMOTORS | +28.92% |
| FEDERALBNK | -15.17% |
| BANKBARODA | -12.55% |
| HCLTECH | -11.25% |
Beaten down sectors saw a smart bounce back. And Tata Motors – take a bow!
ETF Performance
| INFRABEES | +2.65% |
| GOLDBEES | +2.25% |
| NIFTYBEES | +2.07% |
| CPSEETF | +1.01% |
| JUNIORBEES | +0.70% |
| BANKBEES | +0.54% |
| PSUBNKBEES | -0.90% |
Banks seem to have hit a plateau. Have been range bound for almost a year…
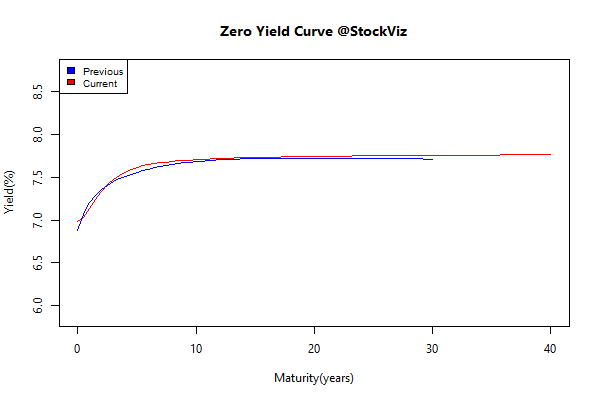
Yield Curve
Bond Indices
| Sub Index | Change in YTM | Total Return(%) |
|---|---|---|
| 0 5 | +0.00 | +0.60% |
| 5 10 | +0.02 | +0.55% |
| 10 15 | +0.02 | +0.39% |
| 15 20 | +0.00 | +0.56% |
| 20 30 | +0.03 | +0.35% |
Yields drifted up a tad…
Investment Theme Performance
| ADAG stocks | +13.52% |
| Velocity | +9.20% |
| Quality to Price | +5.08% |
| Momentum | +5.02% |
| PPFAS Long Term Value | +3.37% |
| ASK Life | +1.59% |
| Next Trillion | +1.43% |
| Magic Formula | +0.83% |
| Enterprise Yield | +0.41% |
| Balance Sheet Strength | +0.22% |
| Low Volatility | -0.09% |
| Financial Strength Value | -0.87% |
| Tactical CNX 100 | -1.55% |
| High Beta | -3.35% |
| The RBI Restricted List | -6.03% |
Velocity – our absolute momentum theme – overtook our thoroughbred relative momentum theme this month.
Equity Mutual Funds
Bond Mutual Funds
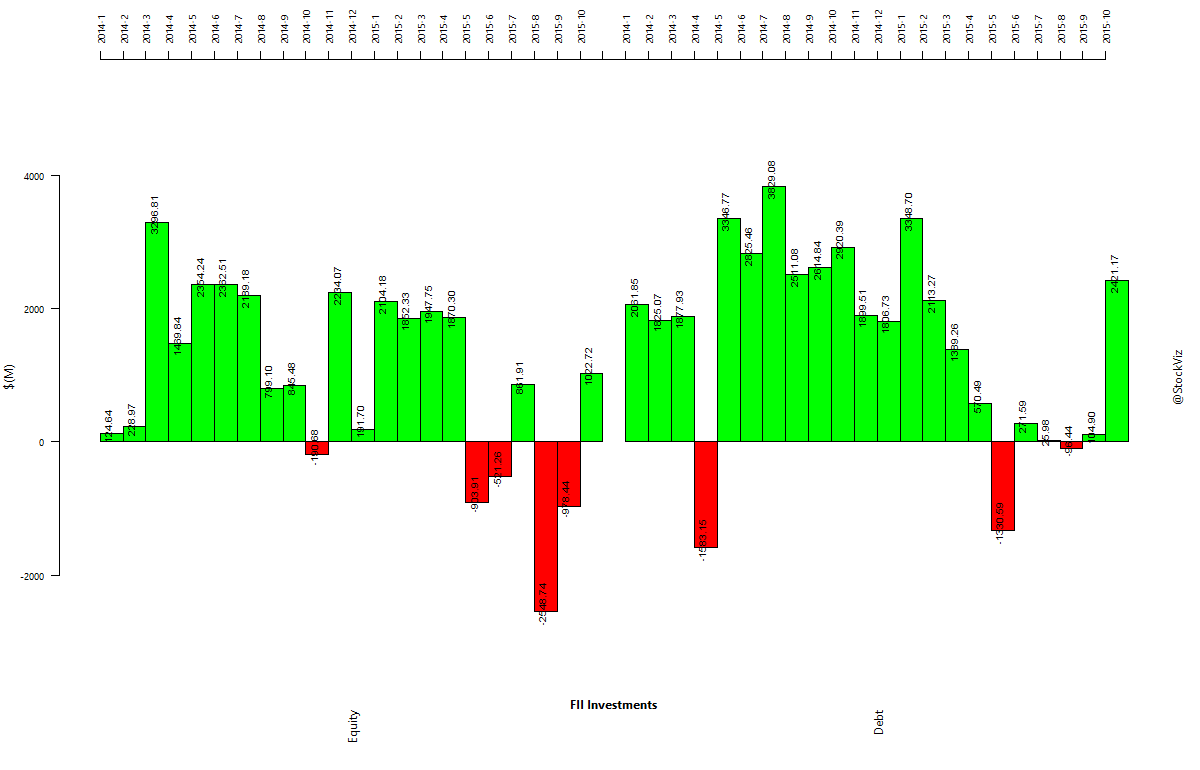
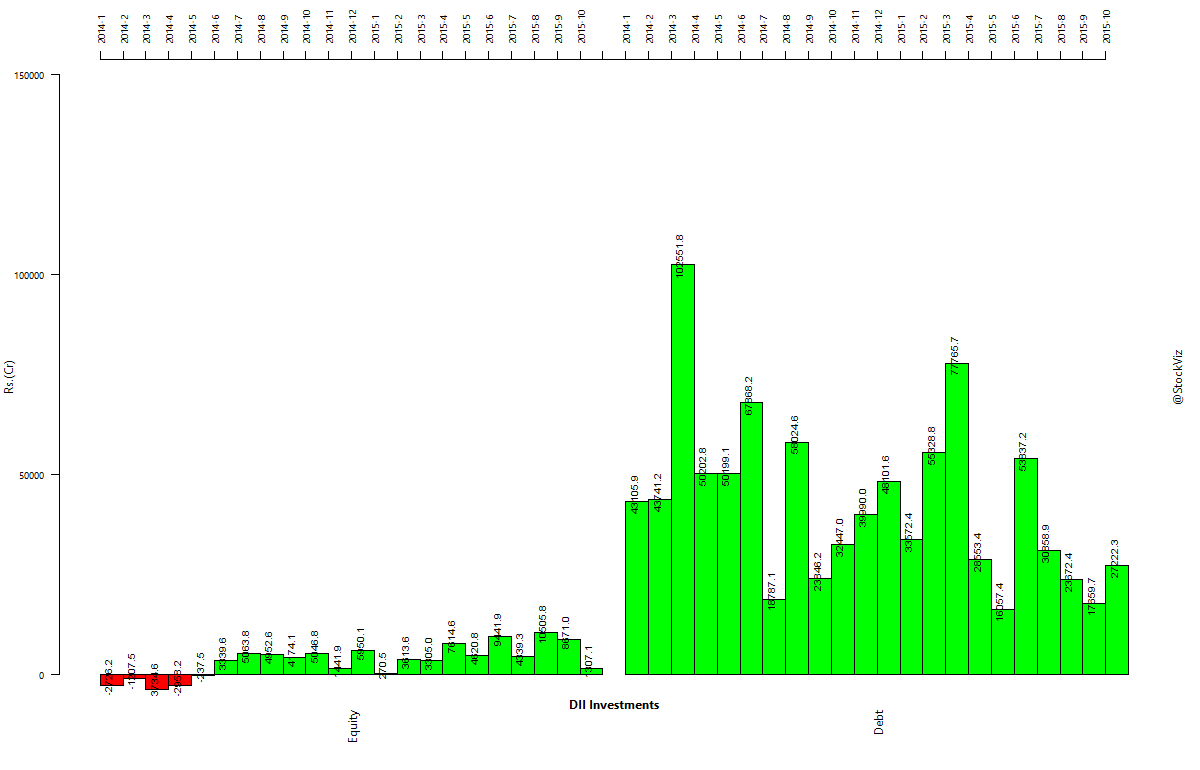
Institutional Investment Trends
Thought to sum up the month
Autonomous cars will be commonplace by 2025 and have a near monopoly by 2030, and the sweeping change they bring will eclipse every other innovation our society has experienced. They will cause unprecedented job loss and a fundamental restructuring of our economy, solve large portions of our environmental problems, prevent tens of thousands of deaths per year, save millions of hours with increased productivity, and create entire new industries that we cannot even imagine from our current vantage point.
Source: Zack Kanter