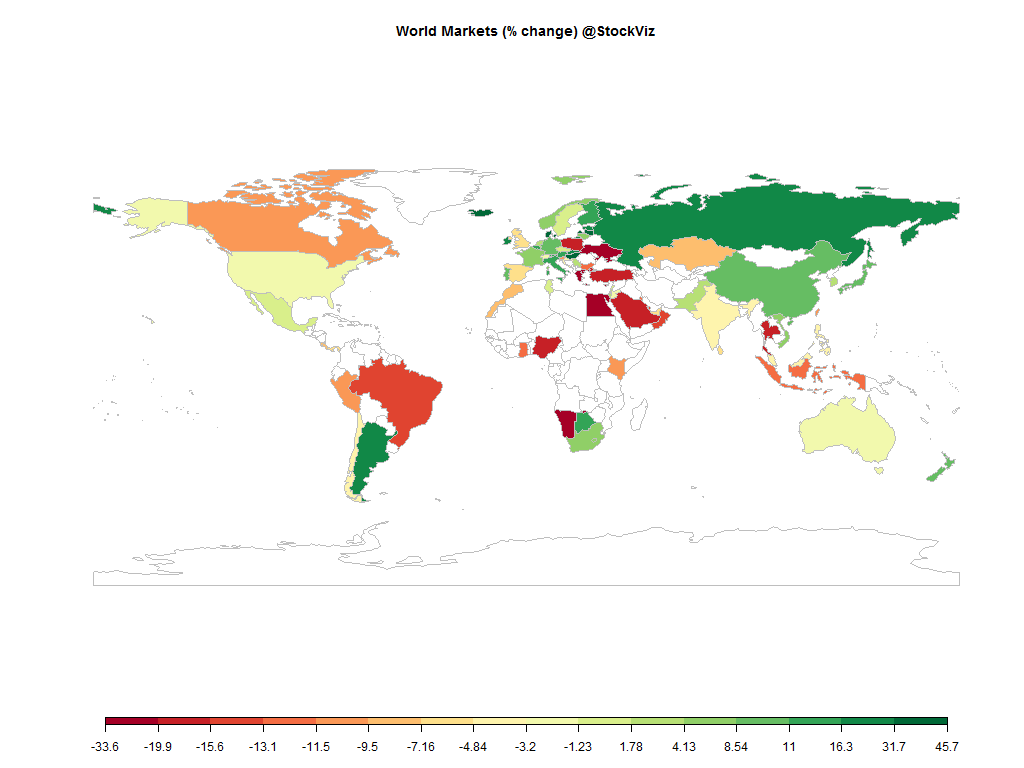
Equities
Commodities
| Energy |
| Ethanol |
-13.17% |
| Brent Crude Oil |
-33.76% |
| Heating Oil |
-39.27% |
| Natural Gas |
-20.45% |
| RBOB Gasoline |
-11.49% |
| WTI Crude Oil |
-29.88% |
| Metals |
| Silver 5000oz |
-12.10% |
| Platinum |
-26.40% |
| Gold 100oz |
-10.86% |
| Copper |
-25.00% |
| Palladium |
-29.43% |
| Agricultural |
| Lean Hogs |
-26.84% |
| Sugar #11 |
+4.32% |
| Cattle |
-18.04% |
| Coffee (Arabica) |
-25.53% |
| Cotton |
+4.21% |
| Lumber |
-21.95% |
| White Sugar |
+7.86% |
| Cocoa |
+14.74% |
| Corn |
-10.56% |
| Feeder Cattle |
-23.82% |
| Orange Juice |
-0.04% |
| Soybeans |
-14.65% |
| Wheat |
-20.25% |
| Coffee (Robusta) |
-21.25% |
| Soybean Meal |
-27.19% |
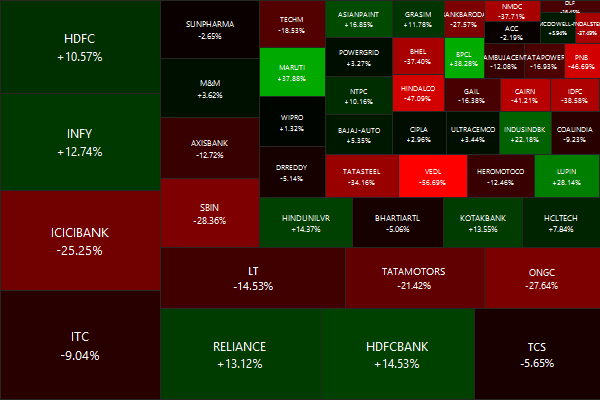
Nifty Heatmap
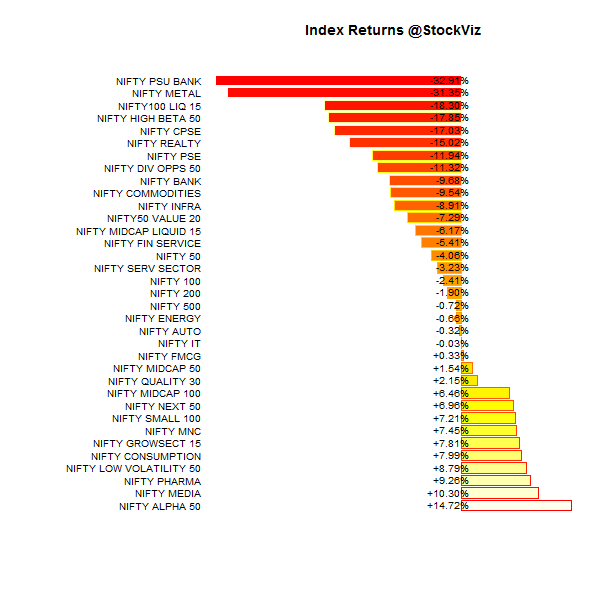
Index Returns
Market Cap Decile Performance
| Decile |
Mkt. Cap. |
Adv/Decl |
| 1 (micro) |
+83.07% |
95/39 |
| 2 |
+64.59% |
104/29 |
| 3 |
+40.56% |
91/42 |
| 4 |
+31.75% |
80/53 |
| 5 |
+28.26% |
82/51 |
| 6 |
+27.95% |
85/48 |
| 7 |
+14.75% |
76/57 |
| 8 |
+19.85% |
75/58 |
| 9 |
+5.53% |
68/65 |
| 10 (mega) |
+0.91% |
68/66 |
It was the year of the small-caps – vastly out-performing the NIFTY 50.
Top Winners and Losers
Commodities and public sector bank stocks got pummeled…
ETF Performance
Broad-based indices had very little to offer…
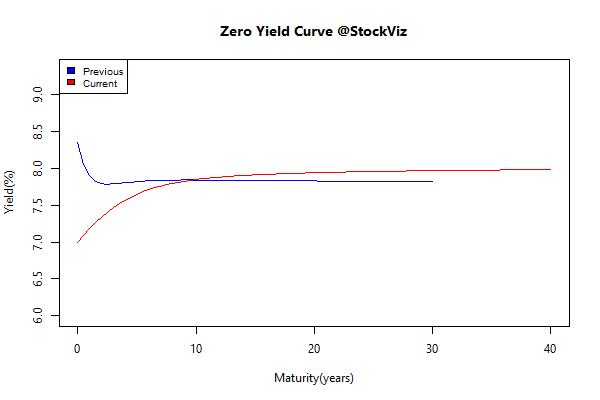
Yield Curve
Bond Indices
| Sub Index |
Change in YTM |
Total Return(%) |
| 0 5 |
-0.50 |
+9.21% |
| 5 10 |
-0.14 |
+8.78% |
| 10 15 |
+0.01 |
+7.83% |
| 15 20 |
+0.09 |
+7.02% |
| 20 30 |
+0.13 |
+6.10% |
On a total return basis, the long-bonds barely kept up with inflation.
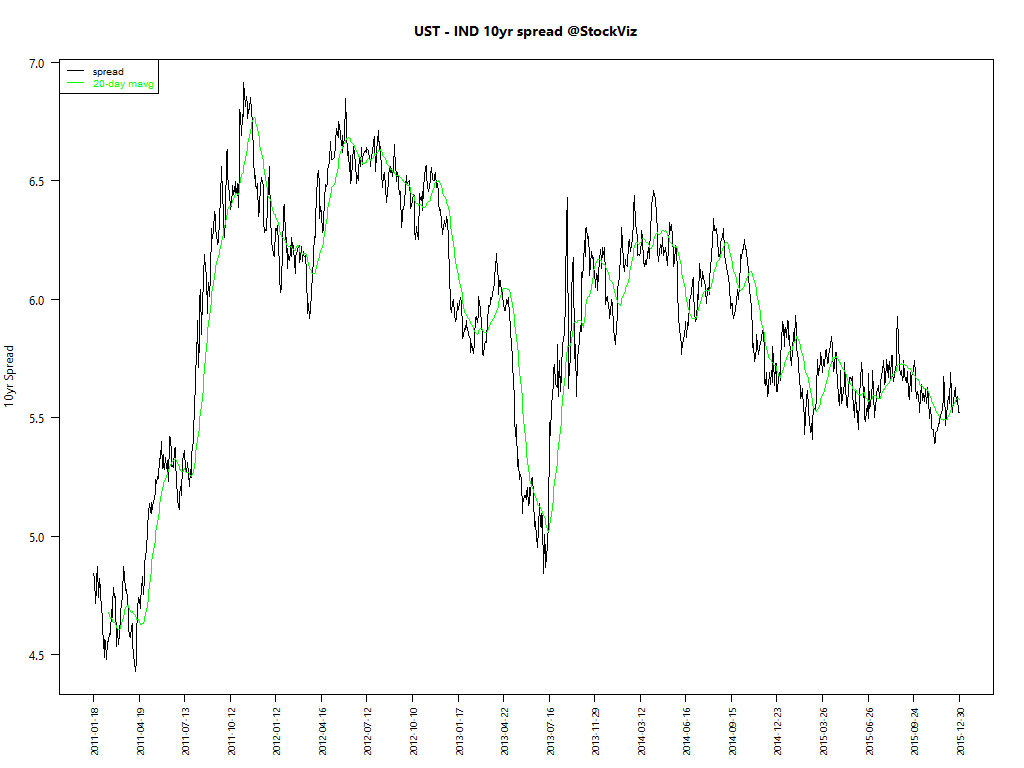
Spread between US Treasuries and Indian Gilts
Investment Theme Performance
Most investment strategies came out ahead…
Equity Mutual Funds
Bond Mutual Funds
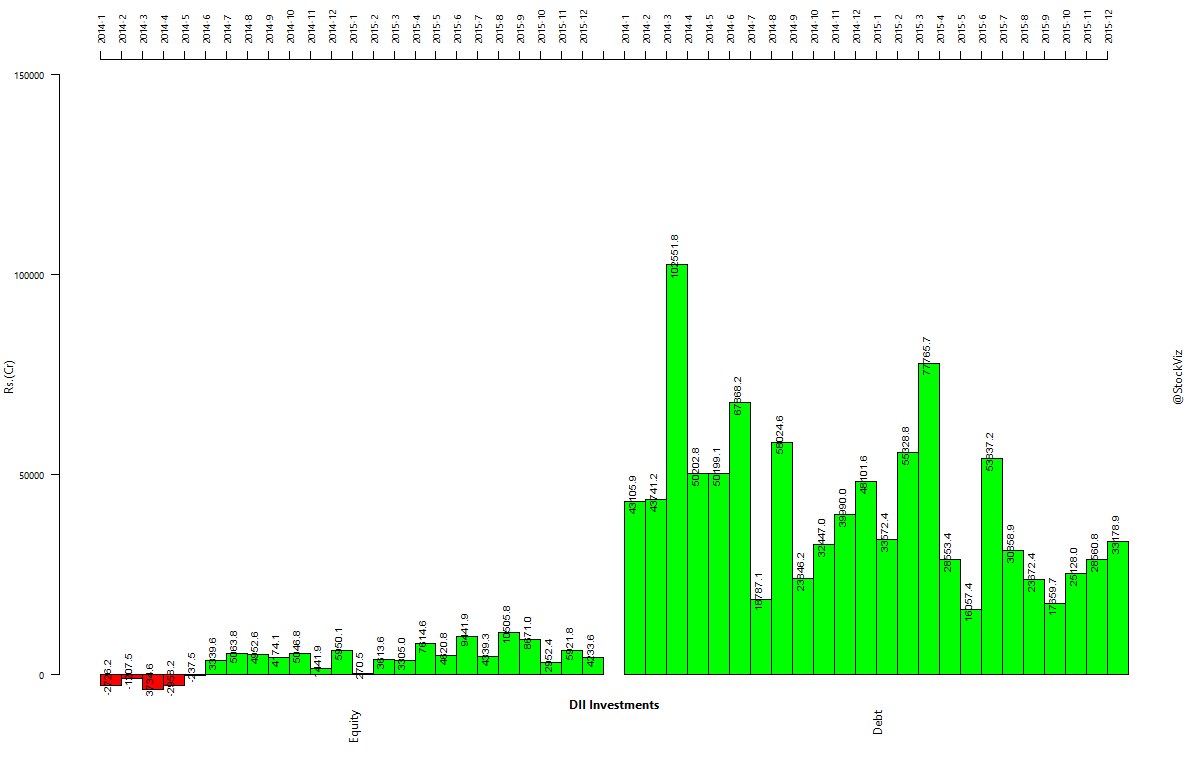
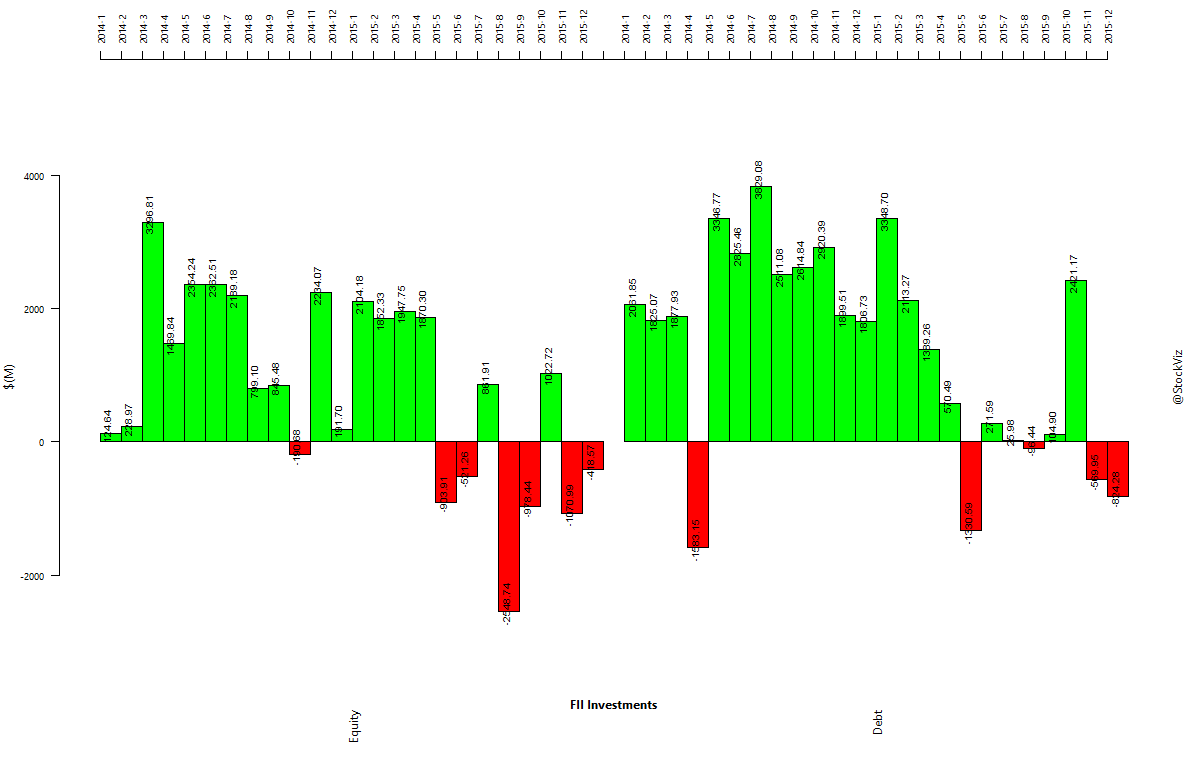
Institutional fund flows
Commentary
It was a year that saw record inflows of retail money into mutual funds and record outflow of foreign investors out of Indian markets. There were taper tantrums, Greece, GST #fail and so many worries. But the systematic and patient investor was rewarded for keeping a cool head.


Comments are closed, but trackbacks and pingbacks are open.