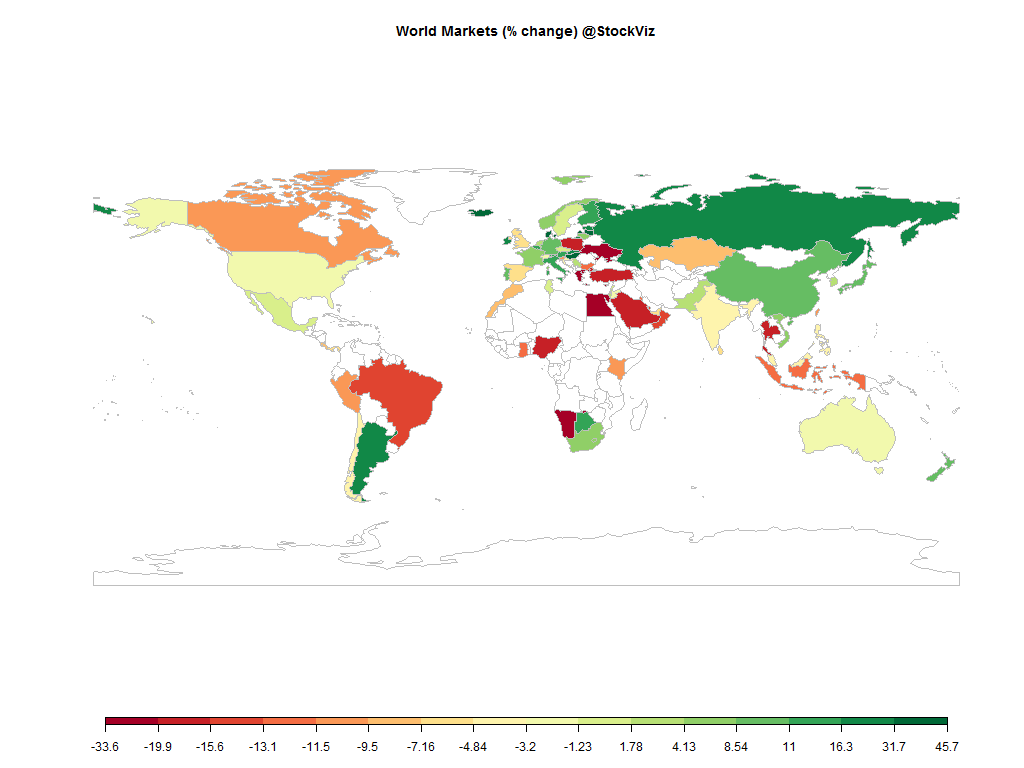
Equities
| MINTs | |
|---|---|
| JCI(IDN) | +15.32% |
| INMEX(MEX) | +7.55% |
| NGSEINDX(NGA) | -6.17% |
| XU030(TUR) | +9.23% |
| BRICS | |
|---|---|
| IBOV(BRA) | +38.93% |
| SHCOMP(CHN) | -12.31% |
| NIFTY(IND) | +3.01% |
| INDEXCF(RUS) | +26.76% |
| TOP40(ZAF) | -4.14% |
Commodities
| Energy | |
|---|---|
| Brent Crude Oil | +50.36% |
| Ethanol | +14.71% |
| Natural Gas | +59.73% |
| WTI Crude Oil | +43.59% |
| RBOB Gasoline | +31.72% |
| Heating Oil | +53.94% |
| Metals | |
|---|---|
| Gold 100oz | +8.52% |
| Palladium | +20.96% |
| Platinum | +4.23% |
| Silver 5000oz | +15.22% |
| Copper | +17.37% |
Currencies
| MINTs | |
|---|---|
| USDIDR(IDN) | -2.28% |
| USDMXN(MEX) | +20.35% |
| USDNGN(NGA) | +58.22% |
| USDTRY(TUR) | +20.84% |
| BRICS | |
|---|---|
| USDBRL(BRA) | -17.81% |
| USDCNY(CHN) | +6.95% |
| USDINR(IND) | +2.68% |
| USDRUB(RUS) | -15.62% |
| USDZAR(ZAF) | -11.23% |
| Agricultural | |
|---|---|
| Coffee (Arabica) | +8.62% |
| Lumber | +22.21% |
| Soybean Meal | +18.45% |
| Soybeans | +14.50% |
| Corn | -2.02% |
| Lean Hogs | +10.35% |
| Orange Juice | +40.79% |
| Sugar #11 | +29.06% |
| Wheat | -13.17% |
| White Sugar | +23.43% |
| Cattle | -14.59% |
| Cocoa | -22.96% |
| Cotton | +11.41% |
| Feeder Cattle | -21.62% |
| Coffee (Robusta) | +44.77% |
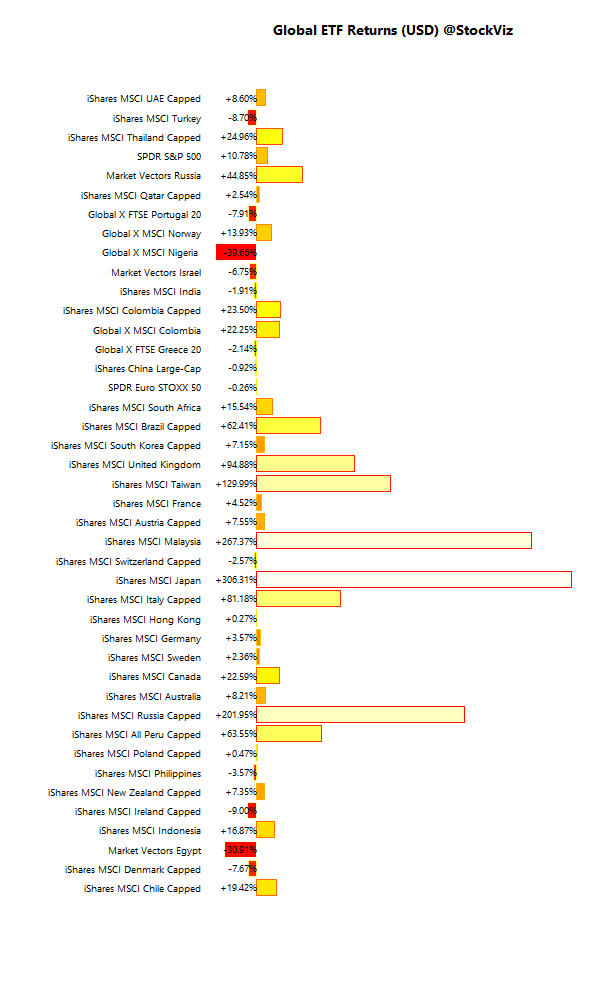
International ETFs (USD)
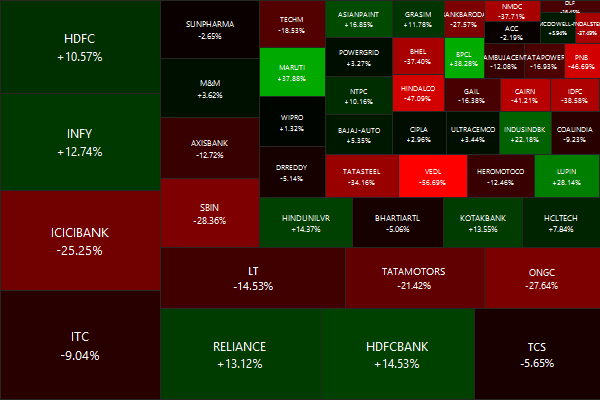
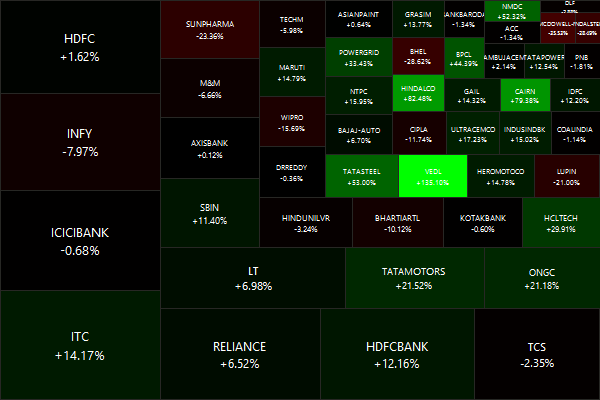
Nifty Heatmap
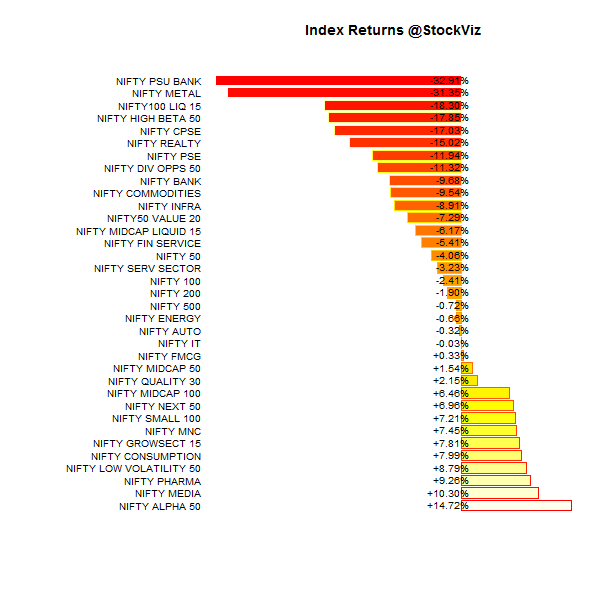
Index Returns
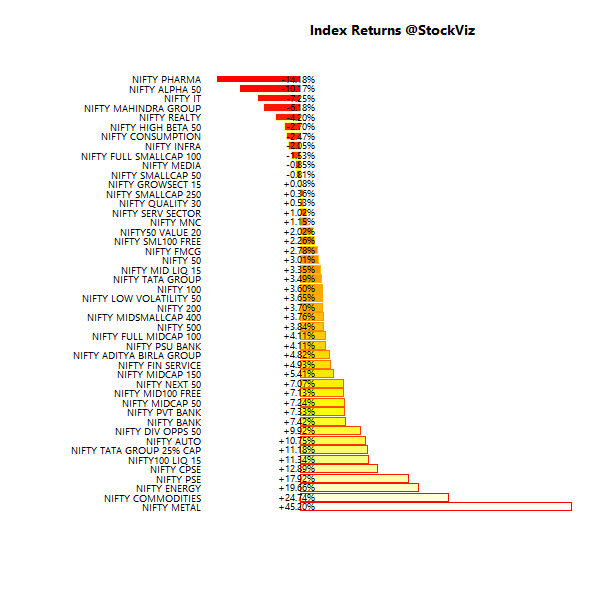
More: Sector Dashboard
ETF Performance
| CPSEETF | +17.50% |
| GOLDBEES | +12.52% |
| BANKBEES | +7.74% |
| JUNIORBEES | +7.45% |
| NIFTYBEES | +3.97% |
| PSUBNKBEES | +3.69% |
| INFRABEES | -1.97% |
Public sector and gold out-performed. Enough said.
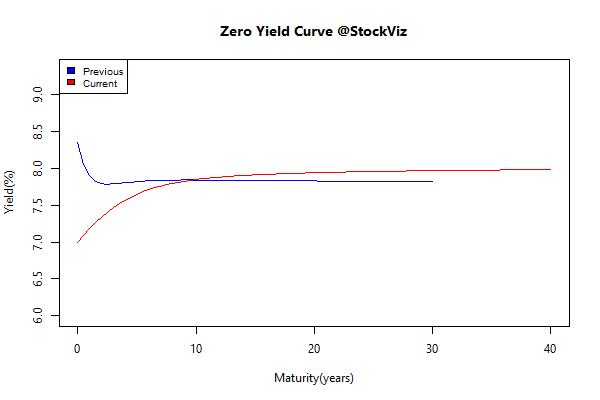
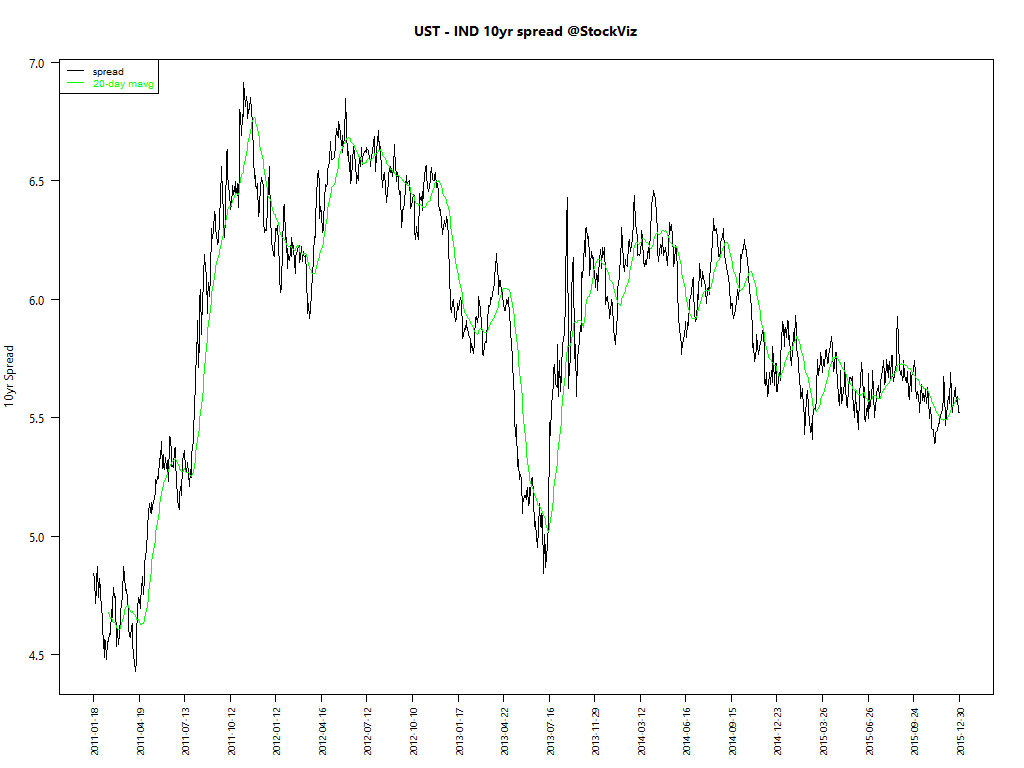
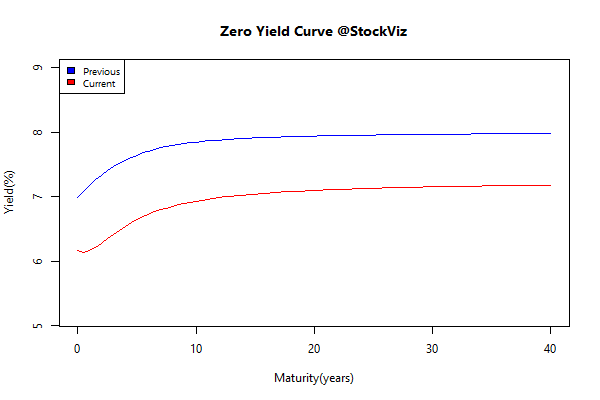
Yield Curve
Bond Indices
| Sub Index | Change in YTM | Total Return(%) |
|---|---|---|
| 0 5 | -1.08 | +10.74% |
| 5 10 | -1.16 | +14.34% |
| 10 15 | -1.04 | +15.88% |
| 15 20 | -1.00 | +17.91% |
| 20 30 | -0.89 | +18.62% |
Long end of the curve had a tremendous run this year…
Investment Theme Performance
| Enterprise Yield | +23.38% |
| Acceleration | +13.78% |
| Magic Formula | +12.97% |
| Balance Sheet Strength | +4.00% |
| HighIR Momentum | -2.17% |
| Quality to Price | -3.50% |
| Financial Strength Value | -4.20% |
| Velocity | -11.50% |
| Momentum | -14.84% |
Equity strategies were red for the most part…
Equity Mutual Funds
Bond Mutual Funds
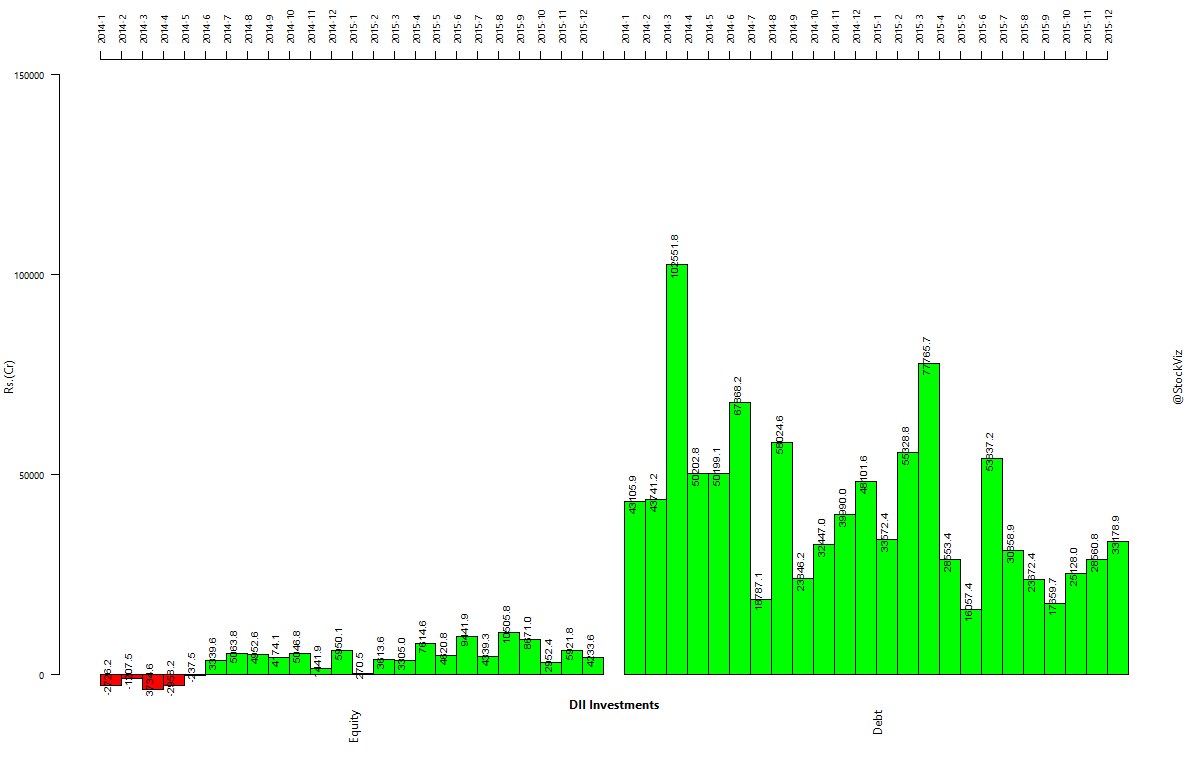
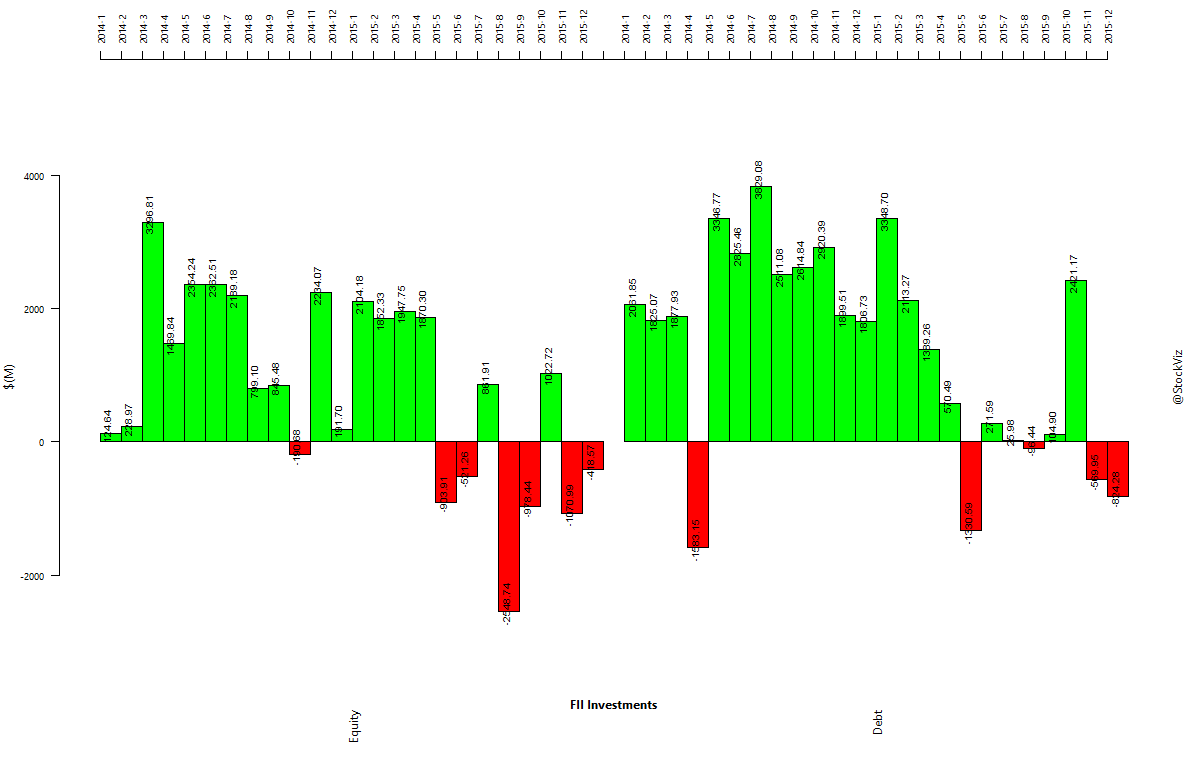
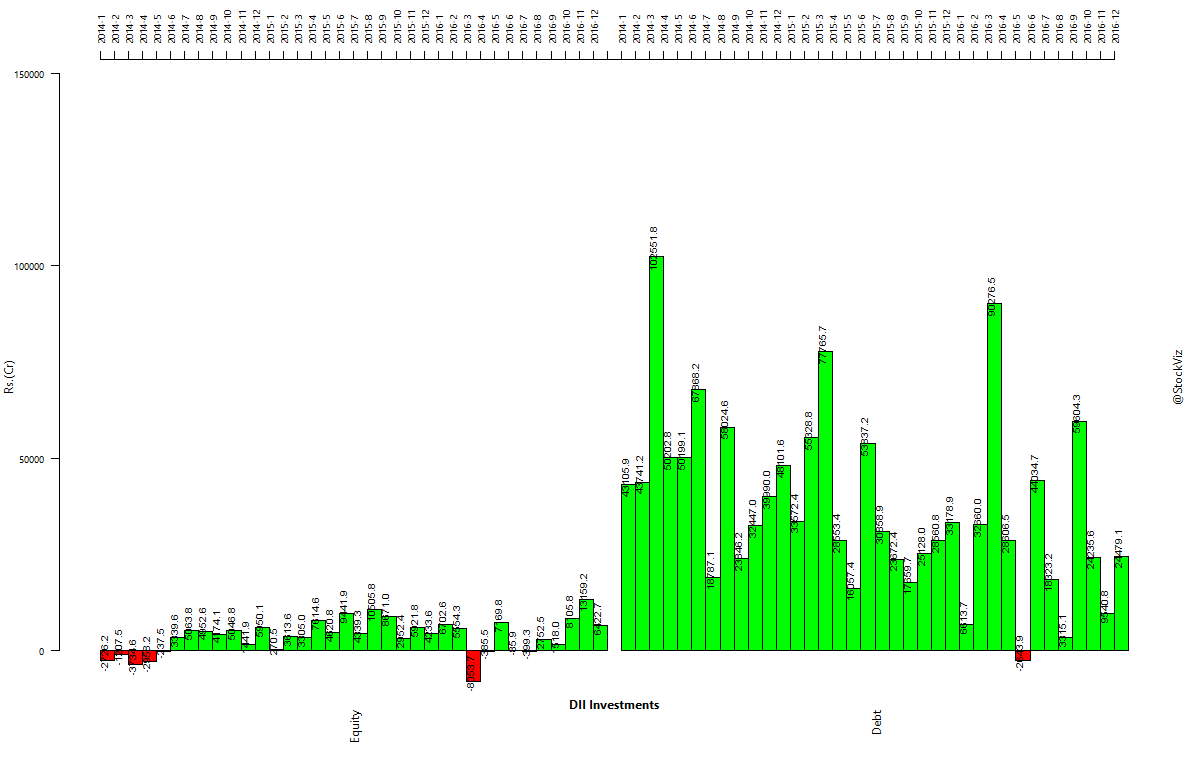
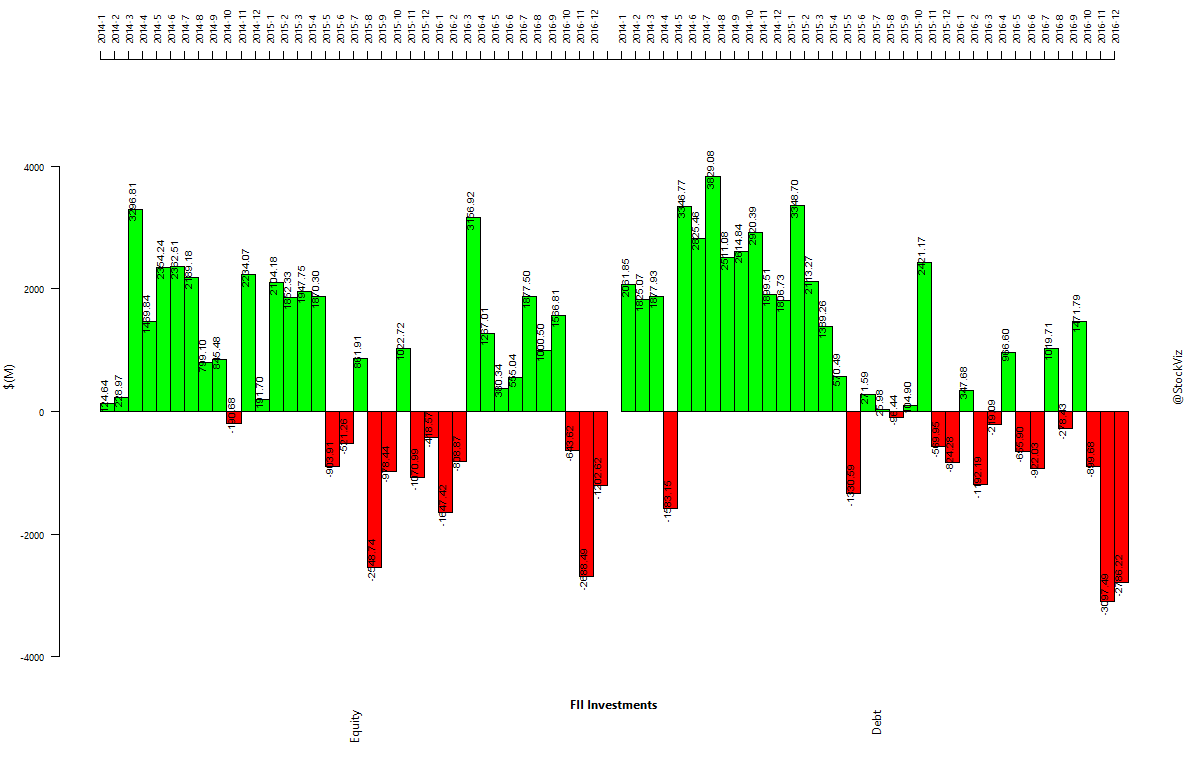
Institutional flows
Keep those SIPs going, your country needs you!
Good luck for the new year!