Category: Your Money

Index Update 19.12.2015

MOMENTUM

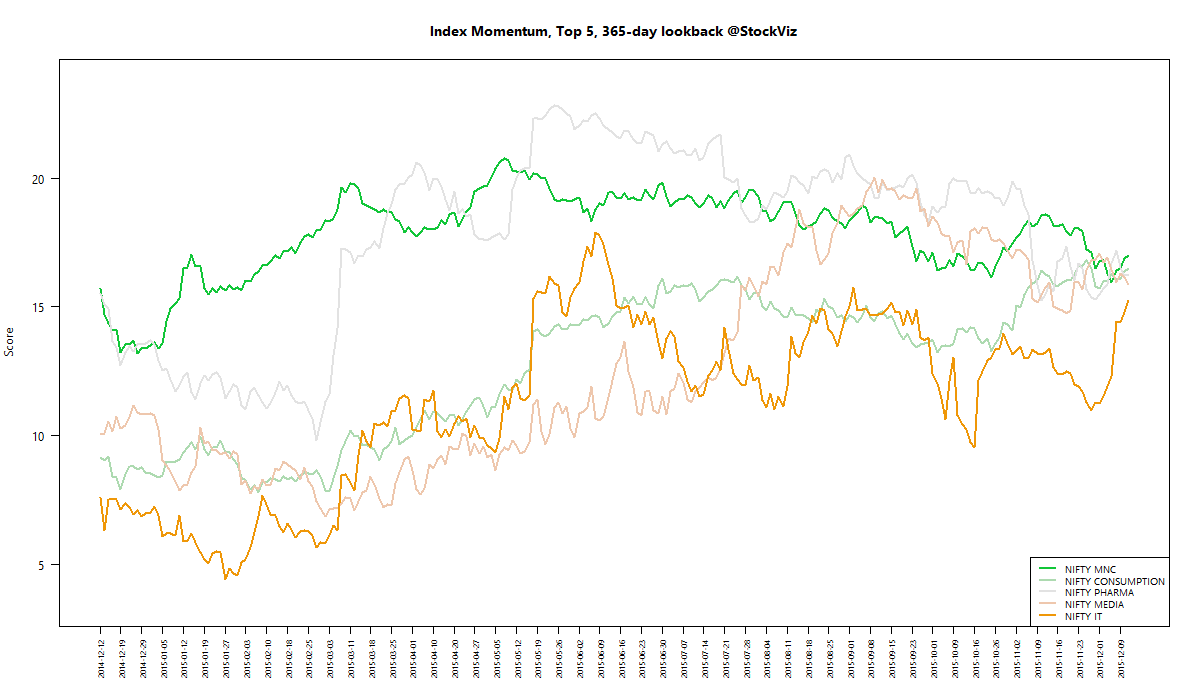
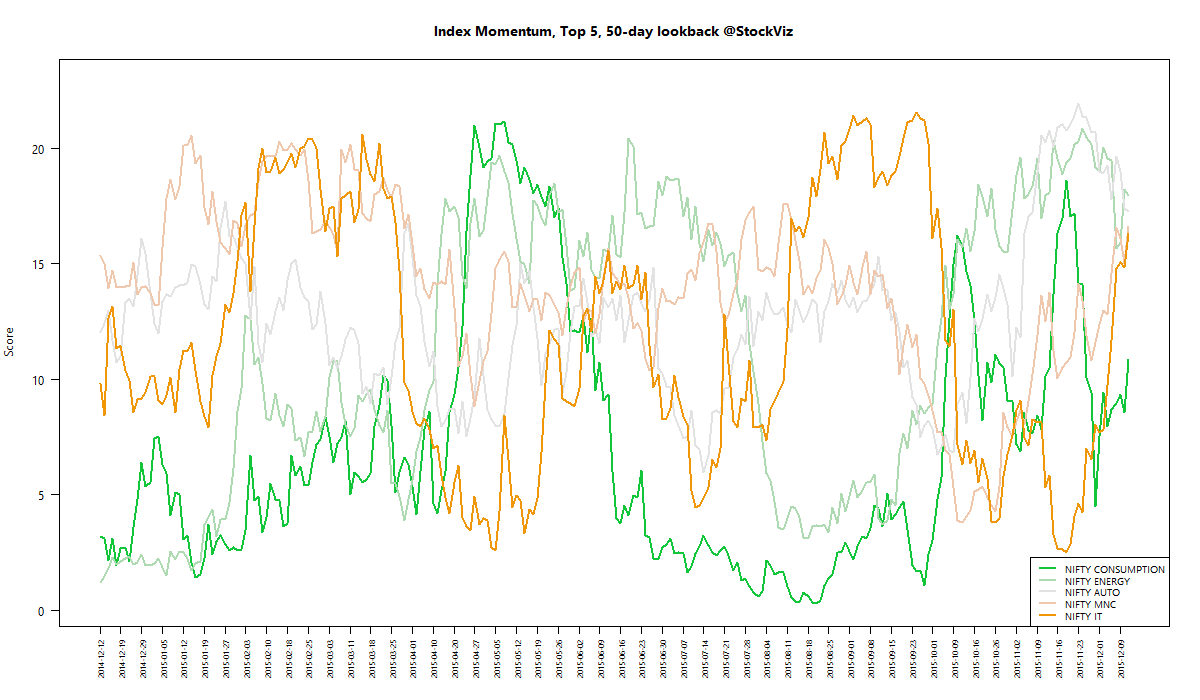
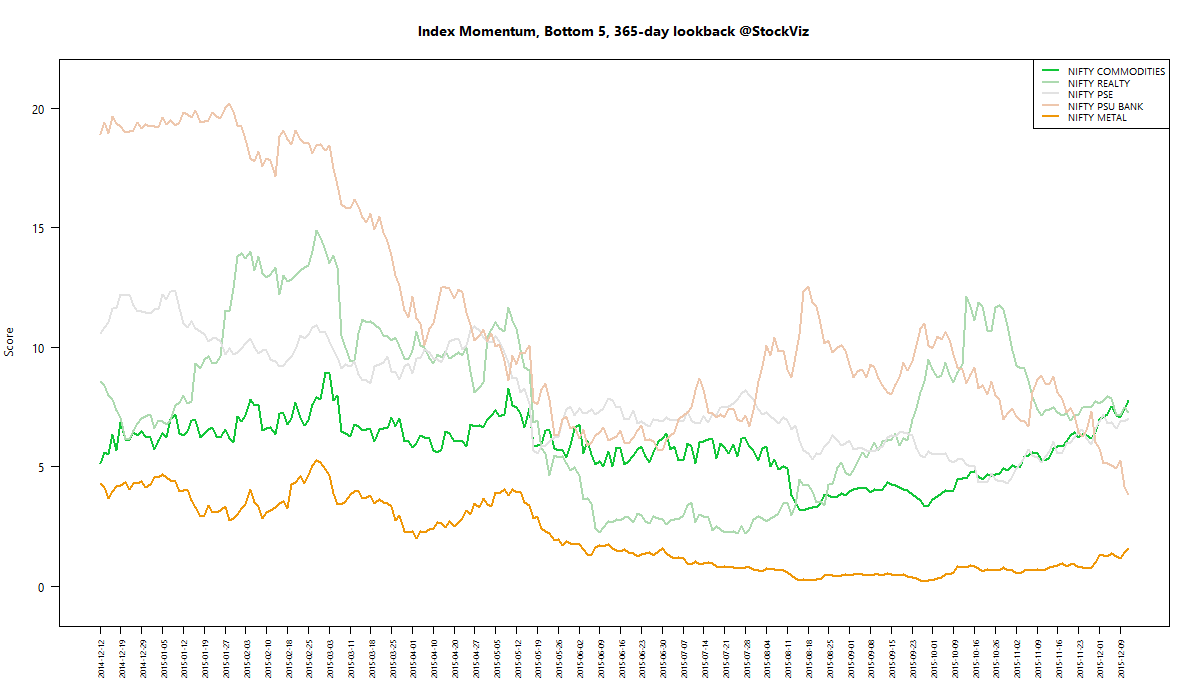
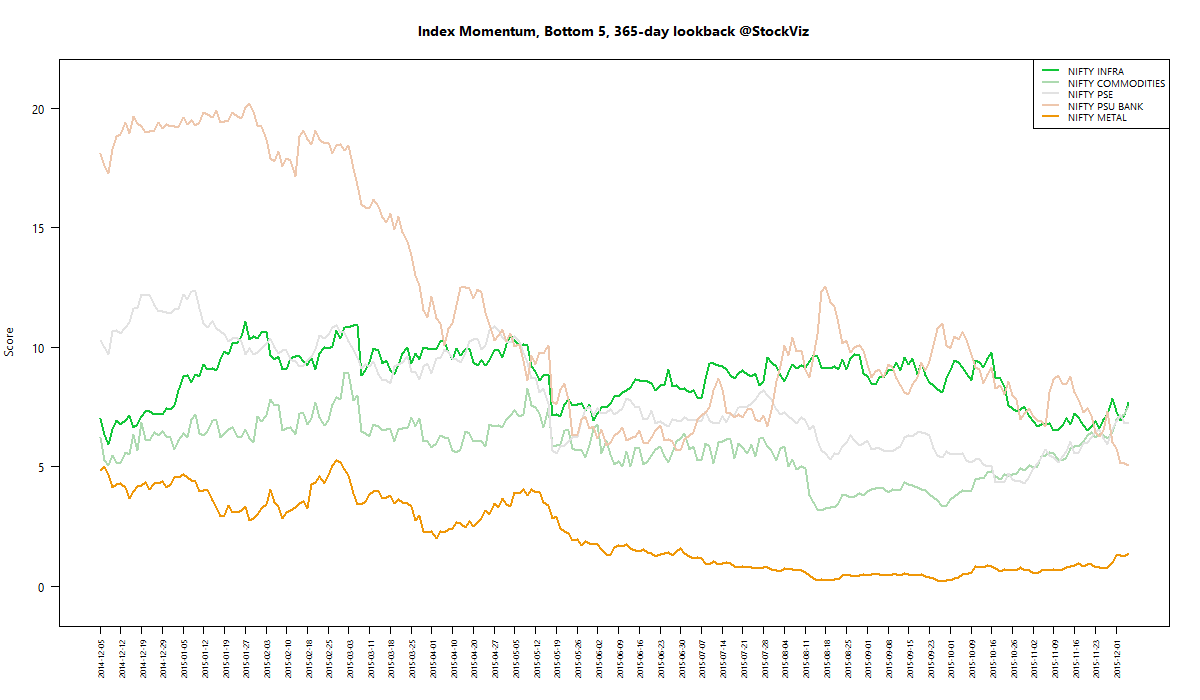
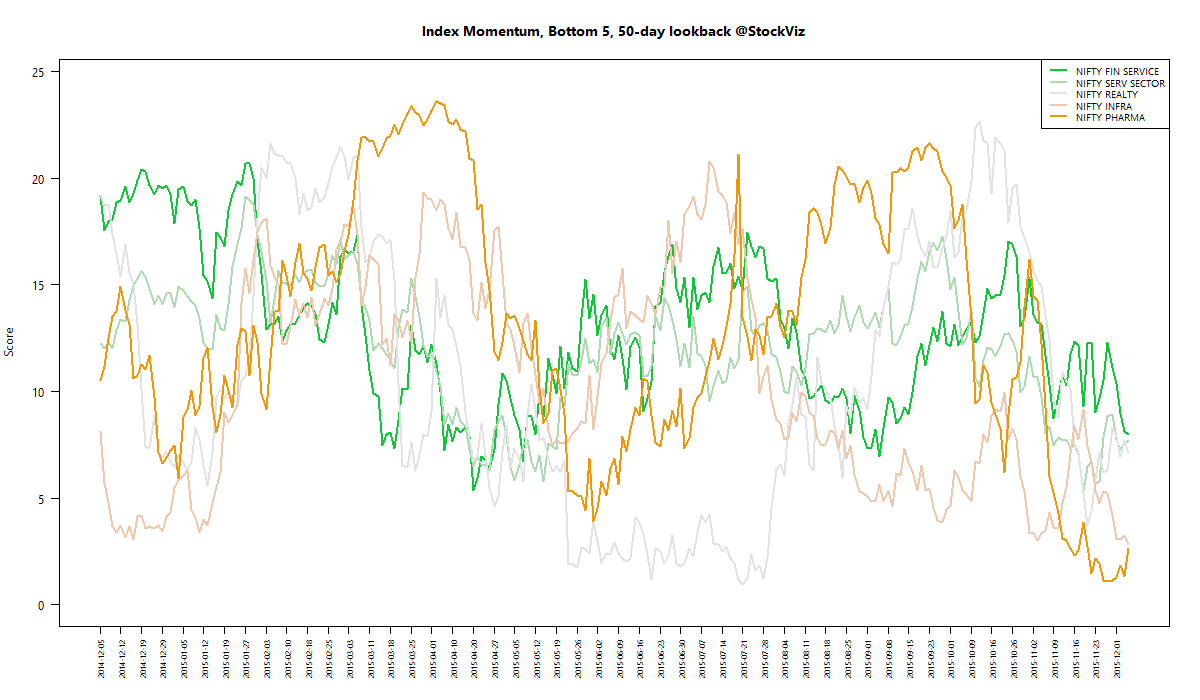
We run our proprietary momentum scoring algorithm on indices just like we do on stocks. You can use the momentum scores of sub-indices to get a sense for which sectors have the wind on their backs and those that are facing headwinds.

Traders can pick their longs in sectors with high short-term momentum and their shorts in sectors with low momentum. Investors can use the longer lookback scores to position themselves using our re-factored index Themes.

You can see how the momentum algorithm has performed on individual stocks here.

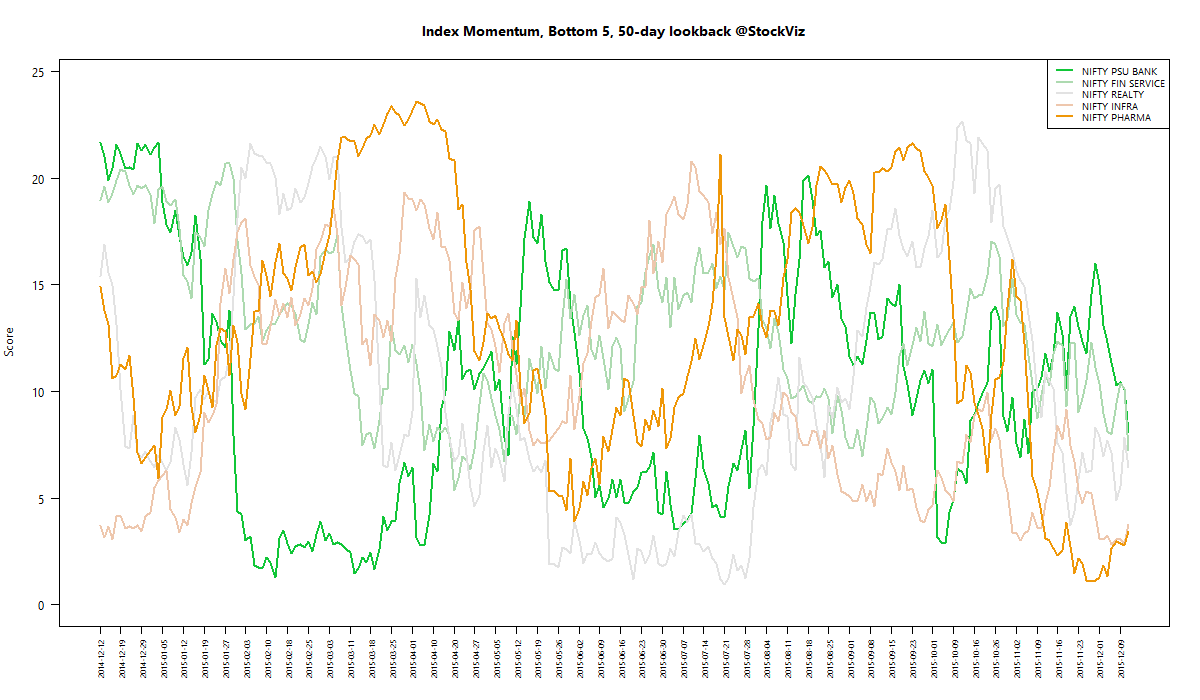
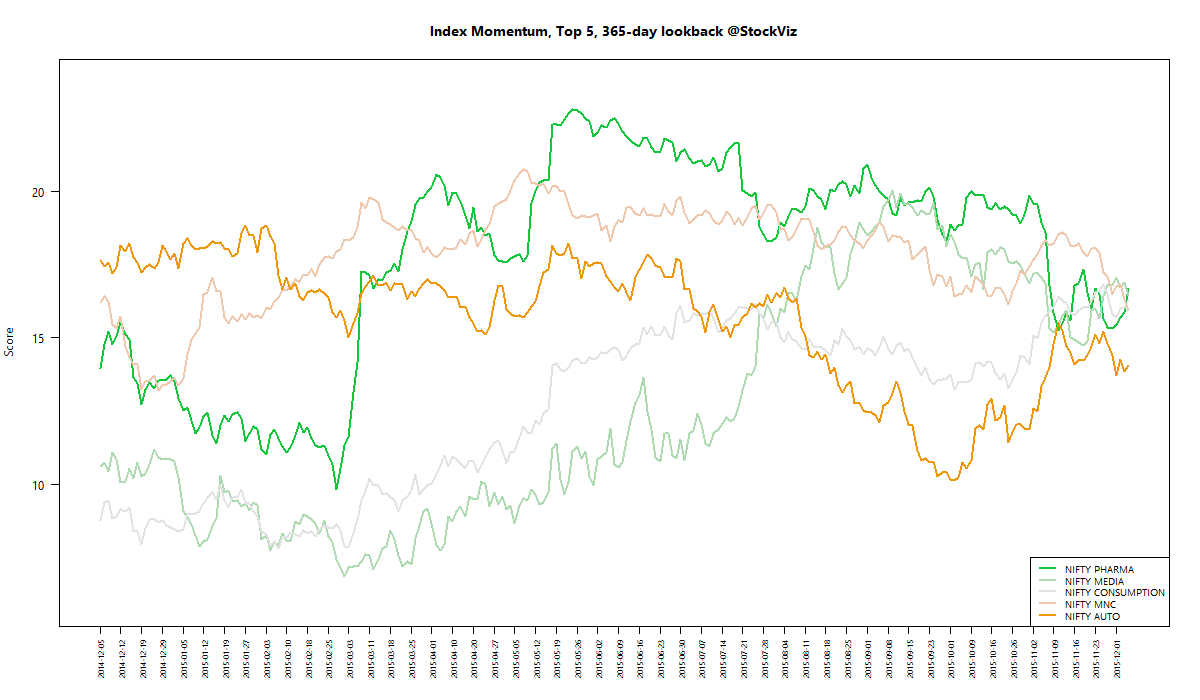
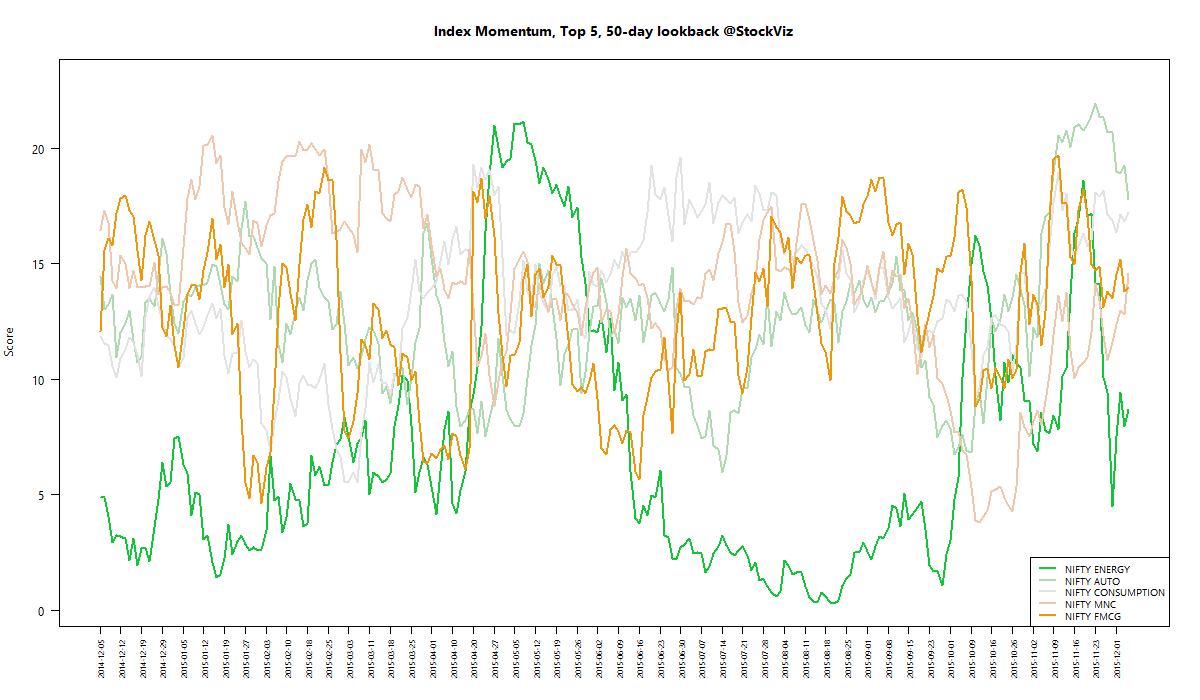
Here are the best and the worst sub-indices:

index momentum best 365 2015-12-18 png

index momentum best 50 2015-12-18 png

index momentum worst 365 2015-12-18 png

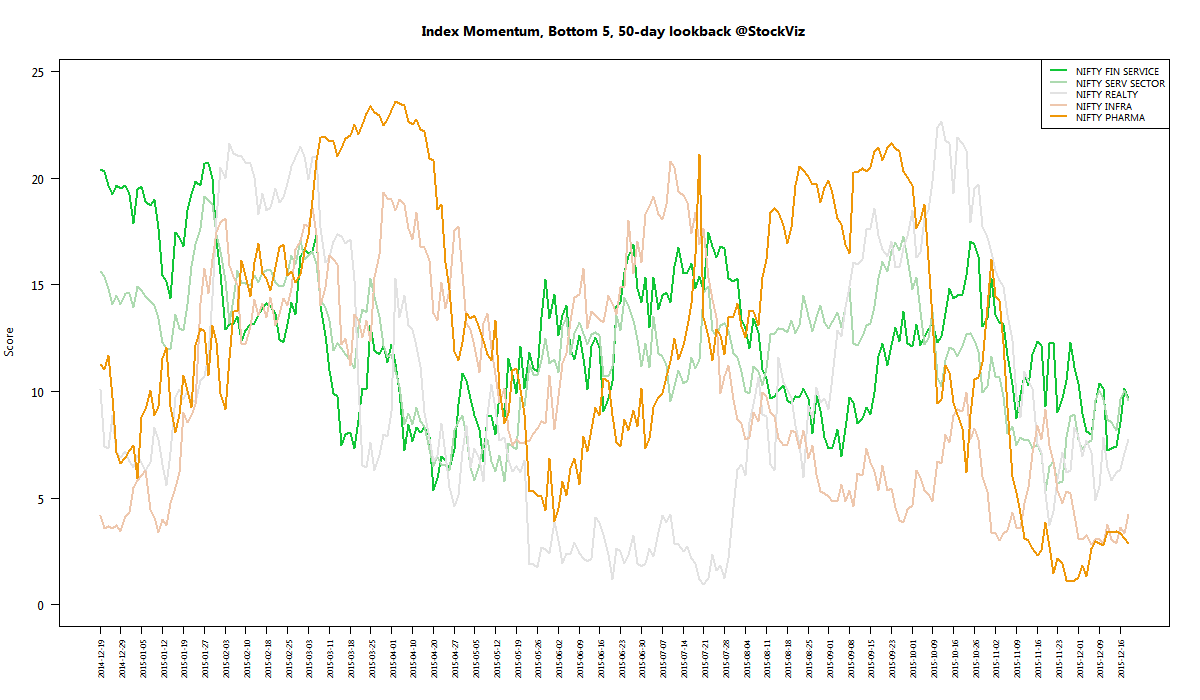
index momentum worst 50 2015-12-18 png

Relative Strength Spread

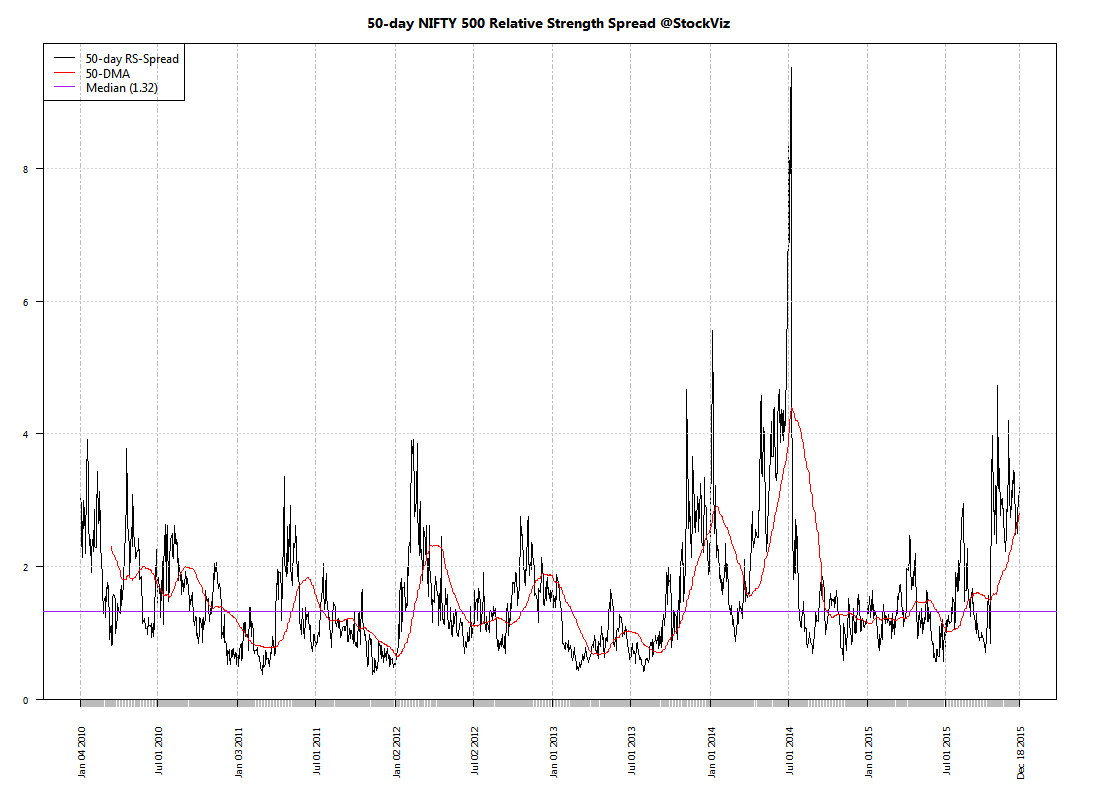
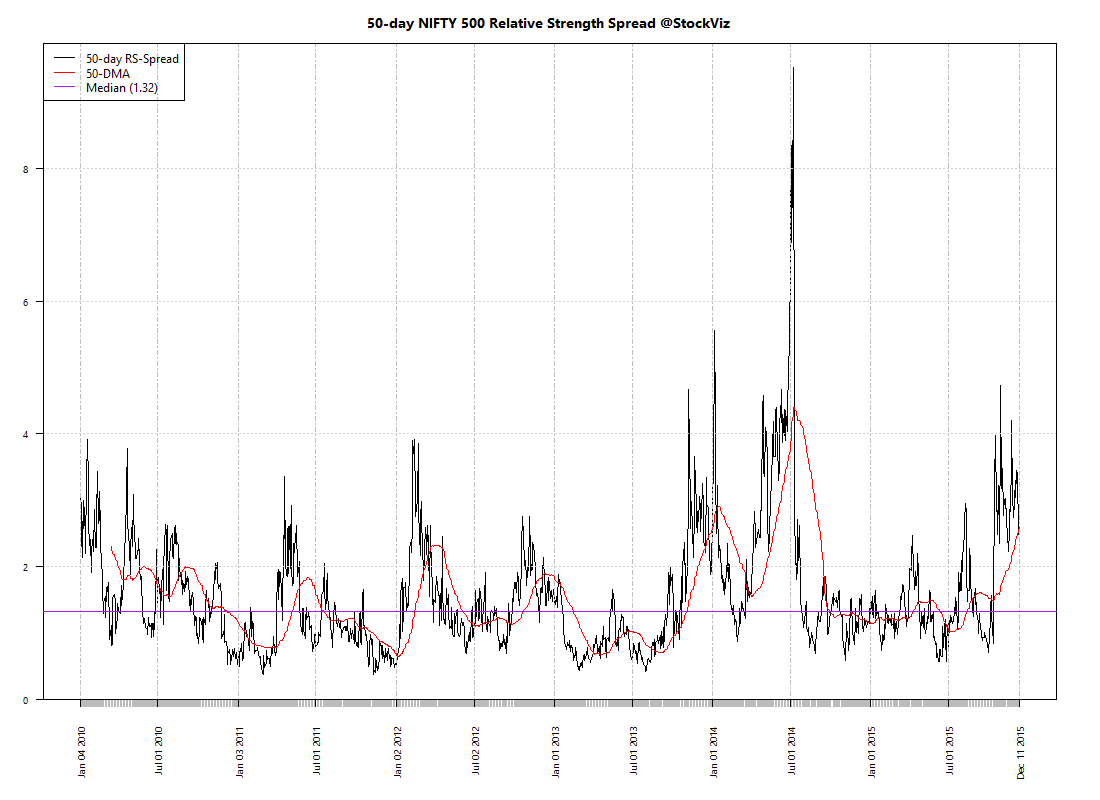
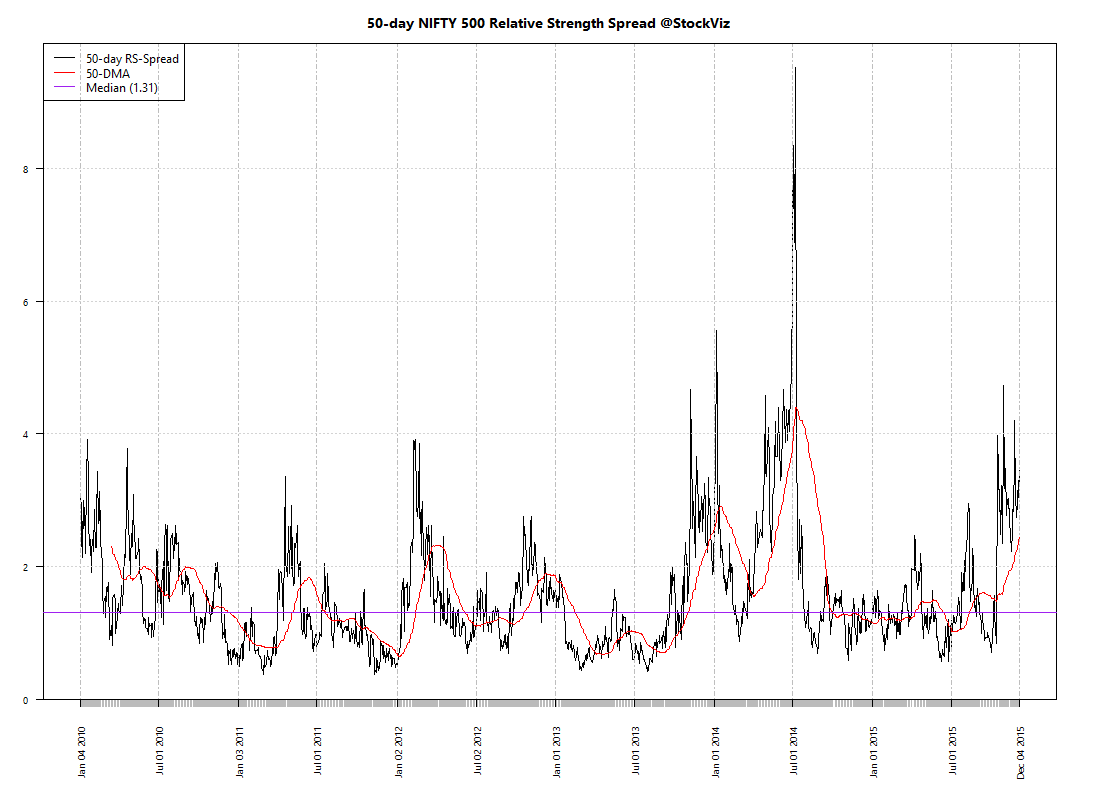
NIFTY_500 relative-spread-index 50 2015-12-18 png

Refactored Index Performance

50-day performance, from October 06, 2015 through December 18, 2015:

Trend Model Summary

Index Signal % From Peak Day of Peak
NIFTY AUTO SHORT
11.21
2015-Jan-27
NIFTY BANK LONG
19.27
2015-Jan-27
NIFTY COMMODITIES SHORT
36.24
2008-Jan-04
NIFTY CONSUMPTION SHORT
5.41
2015-Aug-05
NIFTY ENERGY LONG
31.09
2008-Jan-14
NIFTY FIN SERVICE SHORT
16.66
2015-Jan-28
NIFTY FMCG SHORT
11.13
2015-Feb-25
NIFTY INFRA SHORT
57.24
2008-Jan-09
NIFTY IT SHORT
88.35
2000-Feb-21
NIFTY MEDIA LONG
15.34
2008-Jan-04
NIFTY METAL LONG
67.73
2008-Jan-04
NIFTY MNC LONG
10.02
2015-Aug-10
NIFTY PHARMA LONG
15.67
2015-Apr-08
NIFTY PSE LONG
35.76
2008-Jan-04
NIFTY PSU BANK LONG
45.99
2010-Nov-05
NIFTY REALTY LONG
91.07
2008-Jan-14
NIFTY SERV SECTOR SHORT
14.23
2015-Mar-03
Auto and Pharma – the darlings of days past.

Index Update 12.12.2015

MOMENTUM

We run our proprietary momentum scoring algorithm on indices just like we do on stocks. You can use the momentum scores of sub-indices to get a sense for which sectors have the wind on their backs and those that are facing headwinds.

Traders can pick their longs in sectors with high short-term momentum and their shorts in sectors with low momentum. Investors can use the longer lookback scores to position themselves using our re-factored index Themes.

You can see how the momentum algorithm has performed on individual stocks here.

Here are the best and the worst sub-indices:
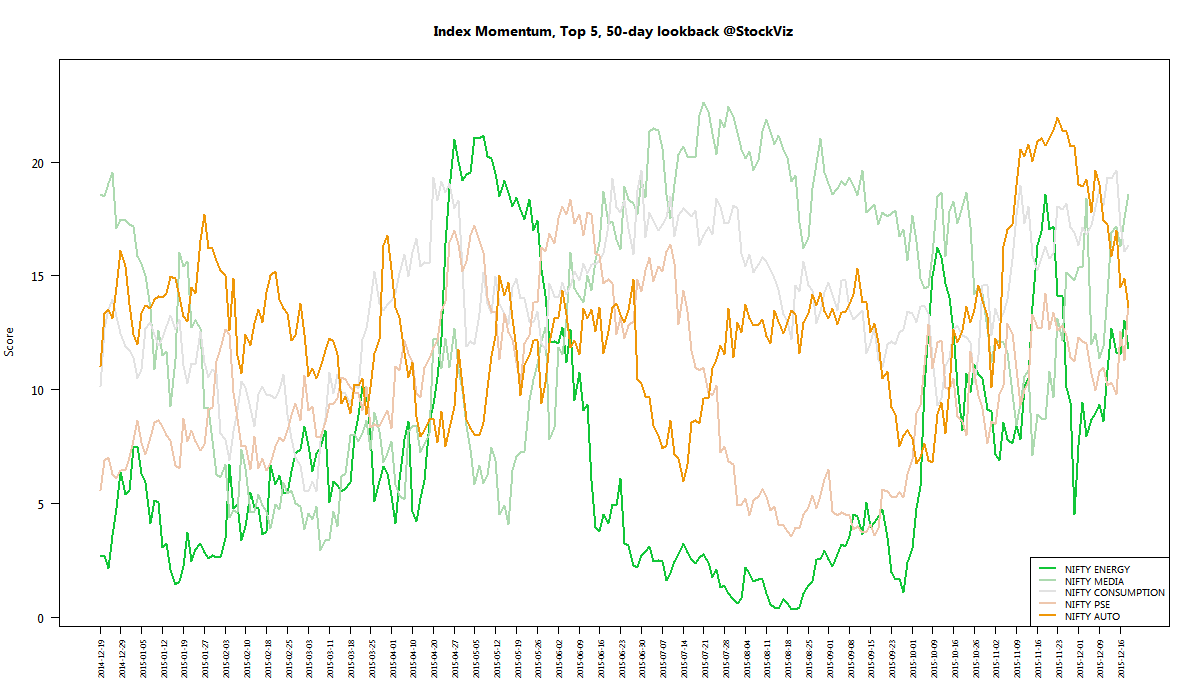
index momentum best 365 2015-12-11 png

index momentum best 50 2015-12-11 png

index momentum worst 365 2015-12-11 png

index momentum worst 50 2015-12-11 png

Relative Strength Spread

NIFTY_500 relative-spread-index 50 2015-12-11 png

Refactored Index Performance

50-day performance, from September 28, 2015 through December 11, 2015:

Trend Model Summary

Index Signal % From Peak Day of Peak
NIFTY AUTO LONG
12.71
2015-Jan-27
NIFTY BANK LONG
20.49
2015-Jan-27
NIFTY COMMODITIES LONG
38.18
2008-Jan-04
NIFTY CONSUMPTION LONG
7.56
2015-Aug-05
NIFTY ENERGY LONG
33.38
2008-Jan-14
NIFTY FIN SERVICE LONG
18.47
2015-Jan-28
NIFTY FMCG LONG
11.98
2015-Feb-25
NIFTY INFRA LONG
58.43
2008-Jan-09
NIFTY IT SHORT
88.44
2000-Feb-21
NIFTY MEDIA SHORT
19.15
2008-Jan-04
NIFTY METAL LONG
69.06
2008-Jan-04
NIFTY MNC LONG
12.51
2015-Aug-10
NIFTY PHARMA SHORT
17.70
2015-Apr-08
NIFTY PSE LONG
37.51
2008-Jan-04
NIFTY PSU BANK LONG
46.32
2010-Nov-05
NIFTY REALTY LONG
91.37
2008-Jan-14
NIFTY SERV SECTOR LONG
16.10
2015-Mar-03
All eyes on the Fed…

Index Update 05.12.2015

MOMENTUM

We run our proprietary momentum scoring algorithm on indices just like we do on stocks. You can use the momentum scores of sub-indices to get a sense for which sectors have the wind on their backs and those that are facing headwinds.

Traders can pick their longs in sectors with high short-term momentum and their shorts in sectors with low momentum. Investors can use the longer lookback scores to position themselves using our re-factored index Themes.

You can see how the momentum algorithm has performed on individual stocks here.

Here are the best and the worst sub-indices:
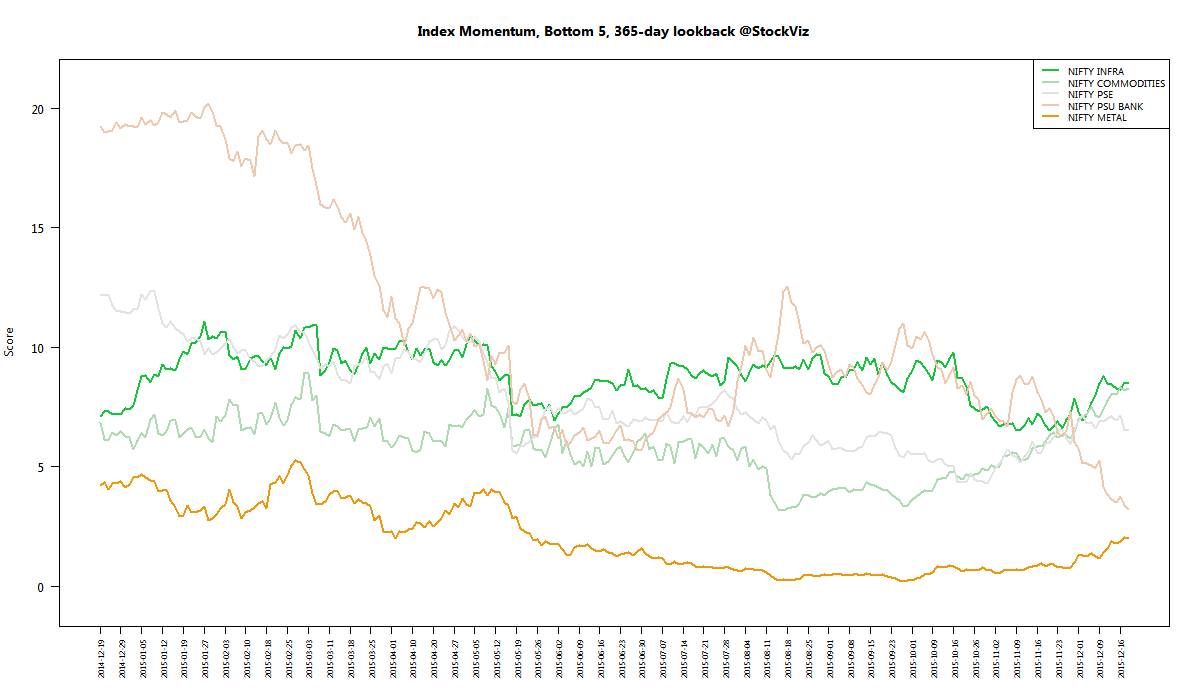
index momentum best 365 2015-12-04 png

index momentum best 50 2015-12-04 png

index momentum worst 365 2015-12-04 png

index momentum worst 50 2015-12-04 png

Relative Strength Spread

NIFTY_500 relative-spread-index 50 2015-12-04 png

Refactored Index Performance

50-day performance, from September 18, 2015 through December 04, 2015:

Trend Model Summary

Index Signal % From Peak Day of Peak
NIFTY AUTO SHORT
9.44
2015-Jan-27
NIFTY BANK SHORT
17.80
2015-Jan-27
NIFTY COMMODITIES SHORT
35.95
2008-Jan-04
NIFTY CONSUMPTION SHORT
5.81
2015-Aug-05
NIFTY ENERGY SHORT
31.97
2008-Jan-14
NIFTY FIN SERVICE SHORT
16.57
2015-Jan-28
NIFTY FMCG SHORT
9.90
2015-Feb-25
NIFTY INFRA SHORT
56.92
2008-Jan-09
NIFTY IT SHORT
88.51
2000-Feb-21
NIFTY MEDIA LONG
18.62
2008-Jan-04
NIFTY METAL LONG
67.66
2008-Jan-04
NIFTY MNC SHORT
11.10
2015-Aug-10
NIFTY PHARMA SHORT
15.81
2015-Apr-08
NIFTY PSE SHORT
35.06
2008-Jan-04
NIFTY PSU BANK LONG
42.61
2010-Nov-05
NIFTY REALTY LONG
90.84
2008-Jan-14
NIFTY SERV SECTOR SHORT
14.66
2015-Mar-03
NIFTY MNC has been trailing lately. Is the trade overdone?

Monthly Recap: November Rain

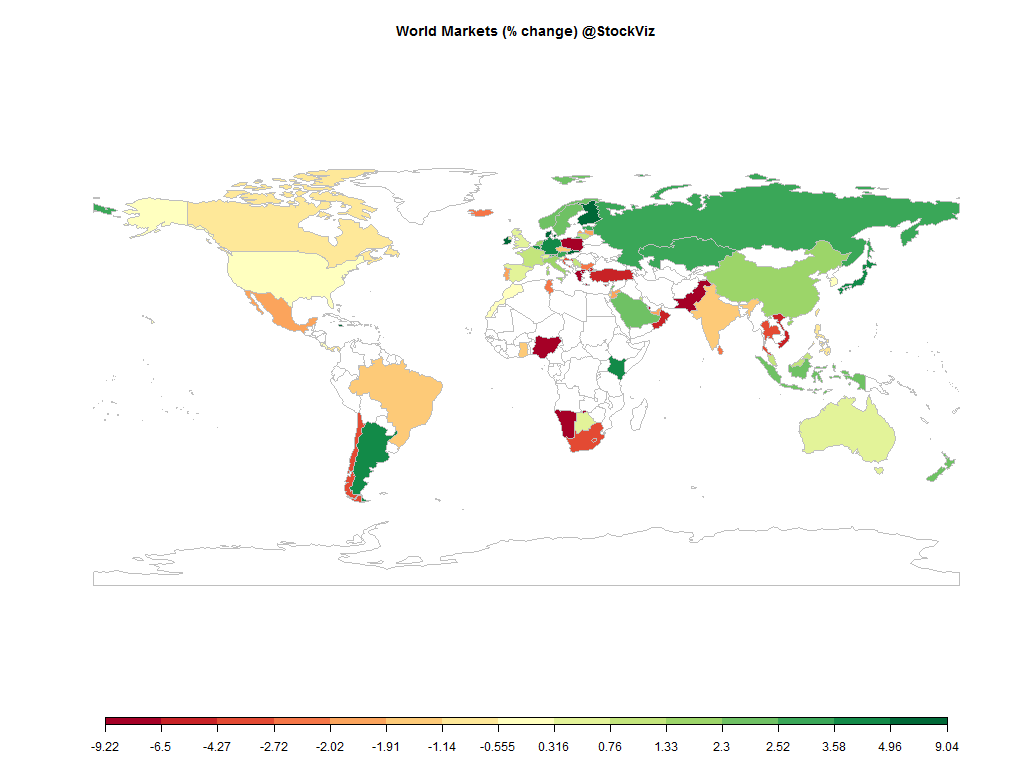
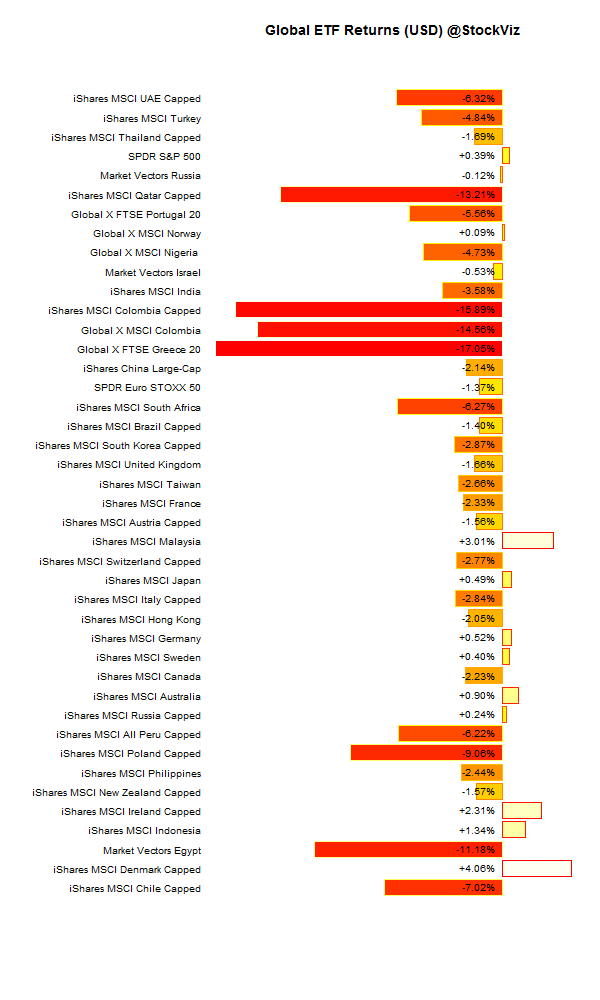
world.2015-10-30.2015-11-30

Equities

Major
DAX(DEU) +4.79%
CAC(FRA) +1.10%
UKX(GBR) +0.47%
NKY(JPN) +4.87%
SPX(USA) -0.55%
MINTs
JCI(IDN) +2.30%
INMEX(MEX) -2.01%
NGSEINDX(NGA) -6.51%
XU030(TUR) -4.51%
BRICS
IBOV(BRA) -1.23%
SHCOMP(CHN) +2.18%
NIFTY(IND) -1.37%
INDEXCF(RUS) +3.58%
TOP40(ZAF) -4.05%

Commodities

Energy
RBOB Gasoline -5.10%
Brent Crude Oil -11.02%
Ethanol -7.28%
Heating Oil -9.08%
Natural Gas -4.35%
WTI Crude Oil -11.31%
Metals
Silver 5000oz -8.39%
Gold 100oz -6.35%
Platinum -14.84%
Palladium -18.51%
Copper -10.39%

Currencies

USDEUR:+3.75% USDJPY:+2.02%

MINTs
USDIDR(IDN) +0.73%
USDMXN(MEX) +0.06%
USDNGN(NGA) -0.76%
USDTRY(TUR) -0.98%
BRICS
USDBRL(BRA) +0.40%
USDCNY(CHN) +1.29%
USDINR(IND) +1.88%
USDRUB(RUS) +4.88%
USDZAR(ZAF) +4.55%
Agricultural
Cocoa +1.63%
Feeder Cattle -14.79%
Lean Hogs -1.22%
Orange Juice +5.55%
Sugar #11 +2.00%
Cattle -6.61%
Cotton -3.22%
Lumber -3.23%
Soybean Meal -5.11%
Wheat -11.24%
White Sugar +2.58%
Coffee (Arabica) -3.65%
Corn -3.66%
Coffee (Robusta) -7.95%
Soybeans +0.45%

Credit Indices

Index Change
Markit CDX EM +0.54%
Markit CDX NA HY -0.97%
Markit CDX NA IG +5.91%
Markit iTraxx Asia ex-Japan IG -1.93%
Markit iTraxx Australia +7.62%
Markit iTraxx Europe -0.81%
Markit iTraxx Europe Crossover -7.97%
Markit iTraxx Japan +9.43%
Markit iTraxx SovX Western Europe -0.27%
Markit LCDX (Loan CDS) -0.04%
Markit MCDX (Municipal CDS) -0.50%
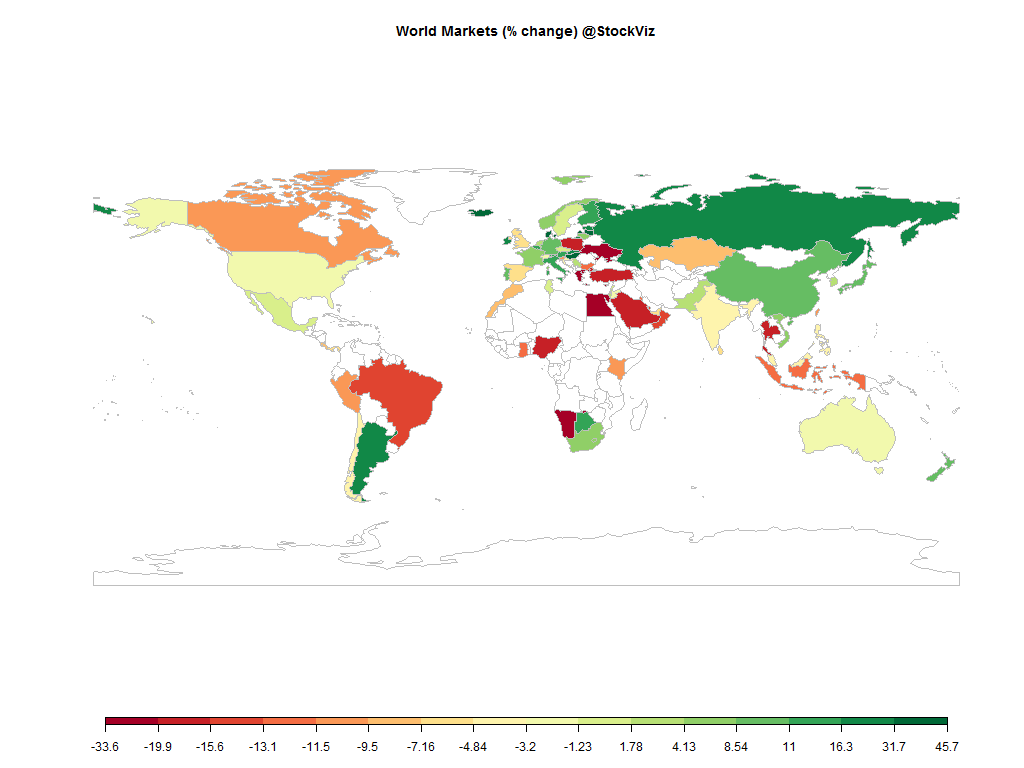
Most global indices ended the month in the red. The US Dollar rallied against most major currencies and the market seems to have come to terms with a December liftoff in US interest rates.

International ETFs (USD)

global.etf.performance.2015-10-30.2015-11-30

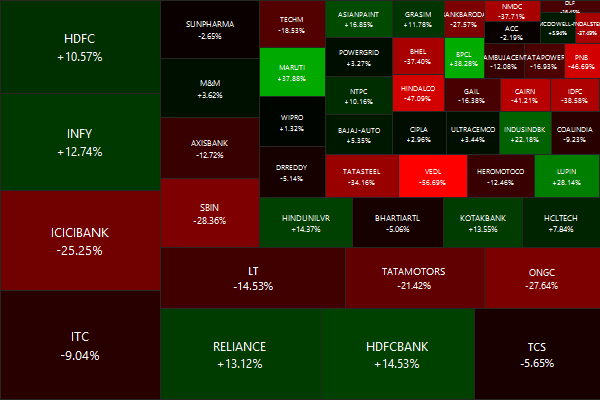
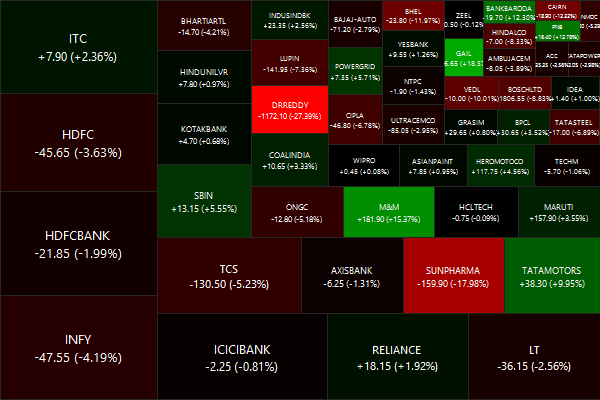
Nifty Heatmap

NIFTY 50.2015-10-30.2015-11-30

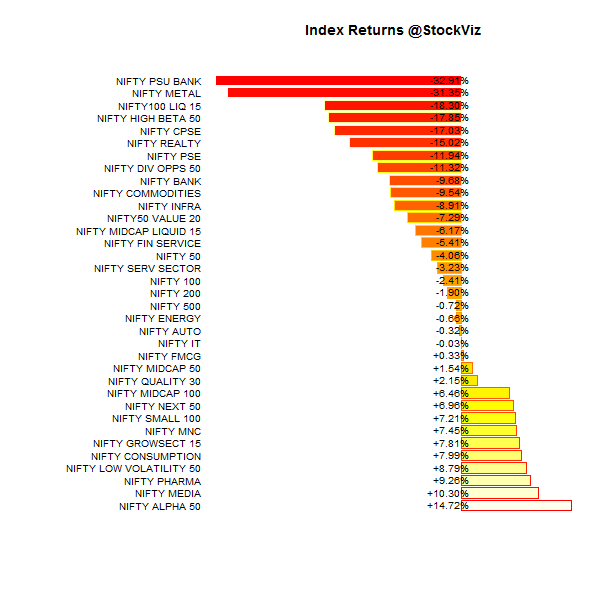
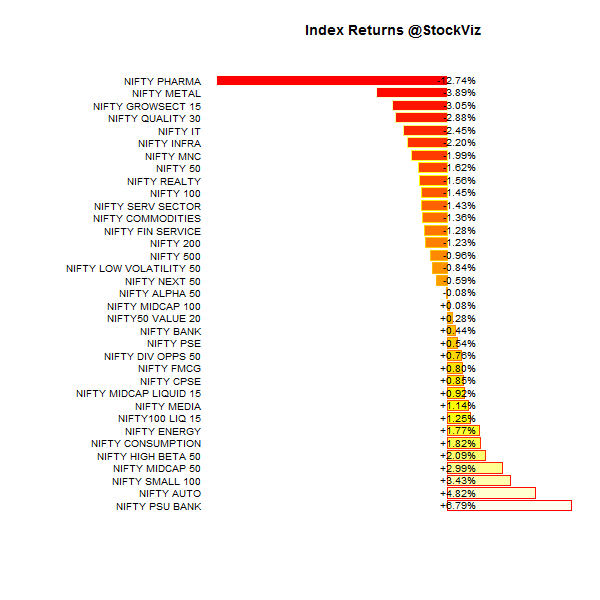
Index Returns

index.performance.2015-10-30.2015-11-30

Market Cap Decile Performance

Decile Mkt. Cap. Adv/Decl
1 (micro) +9.56% 68/67
2 +10.94% 78/56
3 +9.16% 78/56
4 +5.00% 74/60
5 +4.13% 84/50
6 +4.99% 78/56
7 +2.13% 71/63
8 +1.53% 65/69
9 +0.87% 67/67
10 (mega) -1.62% 64/71
Large caps trailed mid and small caps…

Top Winners and Losers

MOTHERSUMI +17.63%
GAIL +18.37%
PETRONET +20.69%
DRREDDY -27.39%
SUNPHARMA -17.98%
SAIL -14.34%
Biggest moves where brought about by regulatory events…

ETF Performance

PSUBNKBEES +6.77%
CPSEETF +1.19%
BANKBEES +0.34%
JUNIORBEES -0.22%
NIFTYBEES -1.87%
INFRABEES -2.50%
GOLDBEES -6.07%
PSU Banks: dead cat bounce or are government efforts finally turning things around?

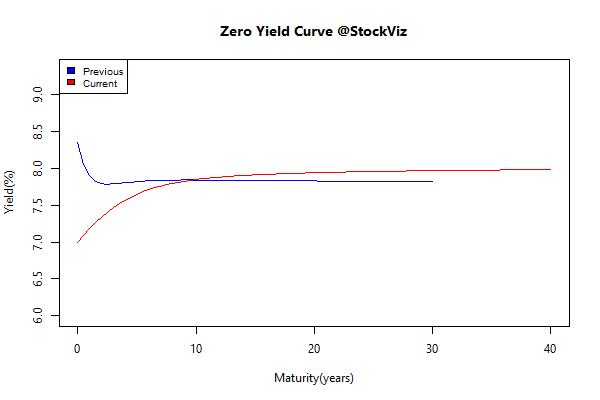
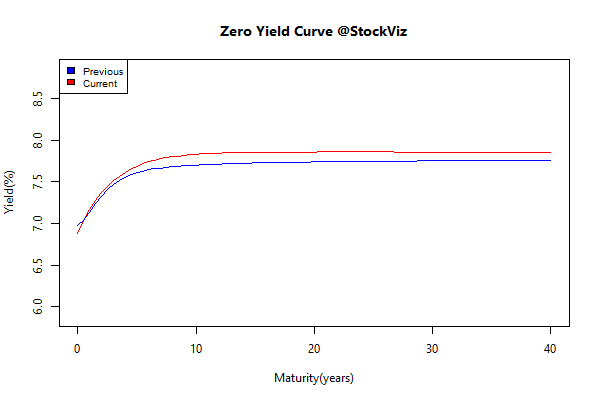
Yield Curve

yieldCurve.2015-10-30.2015-11-30

Bond Indices

Sub Index Change in YTM Total Return(%)
0 5 +0.08 +0.38%
5 10 +0.13 -0.07%
10 15 +0.13 -0.28%
15 20 +0.15 -0.83%
20 30 +0.13 -0.72%
Next rate cuts are probably six months away…

Investment Theme Performance

Most investment strategies did well… November saw Quality to Price post over +250% and Momentum post over +200% gains since their inception in August 2013.

Equity Mutual Funds

Bond Mutual Funds

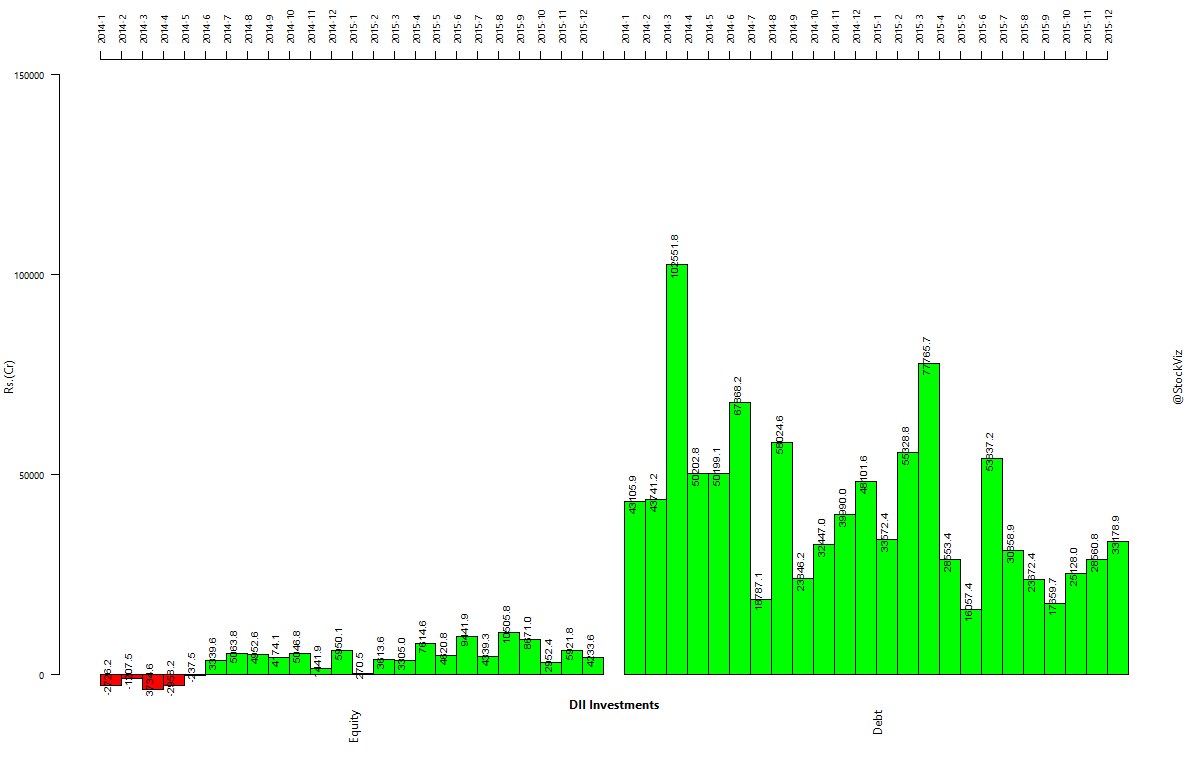
Institutional flows

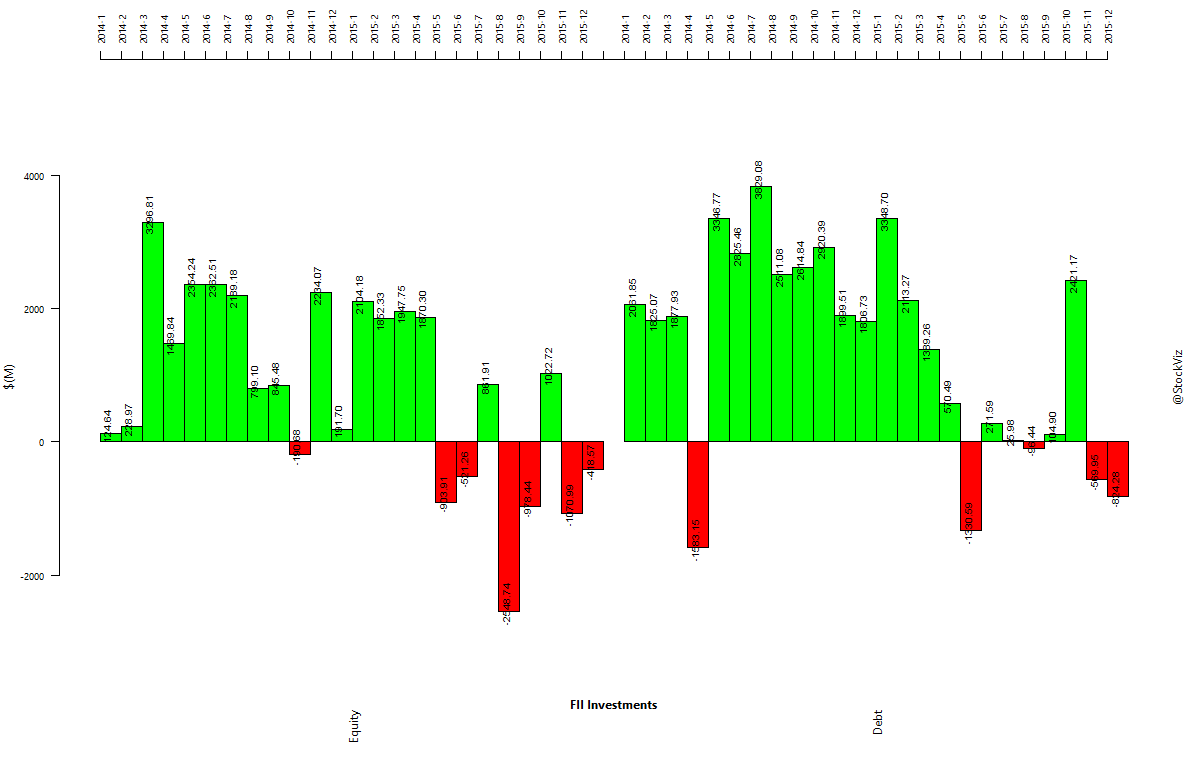
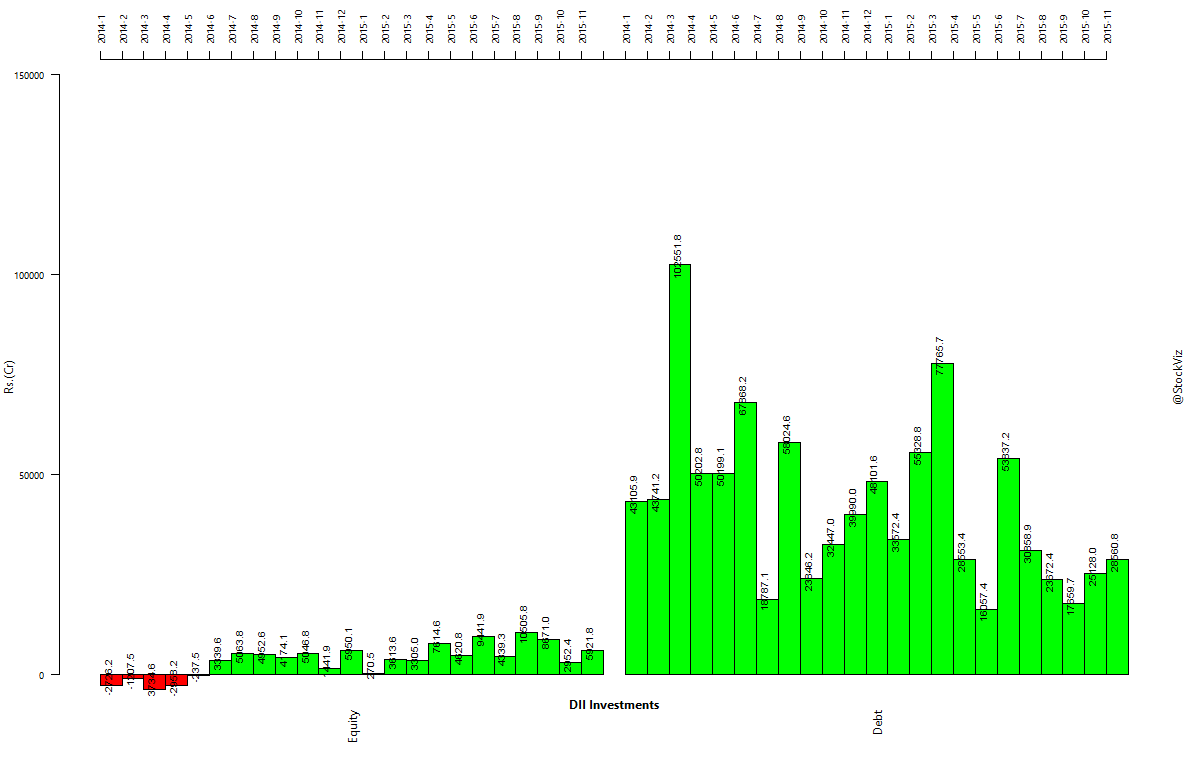
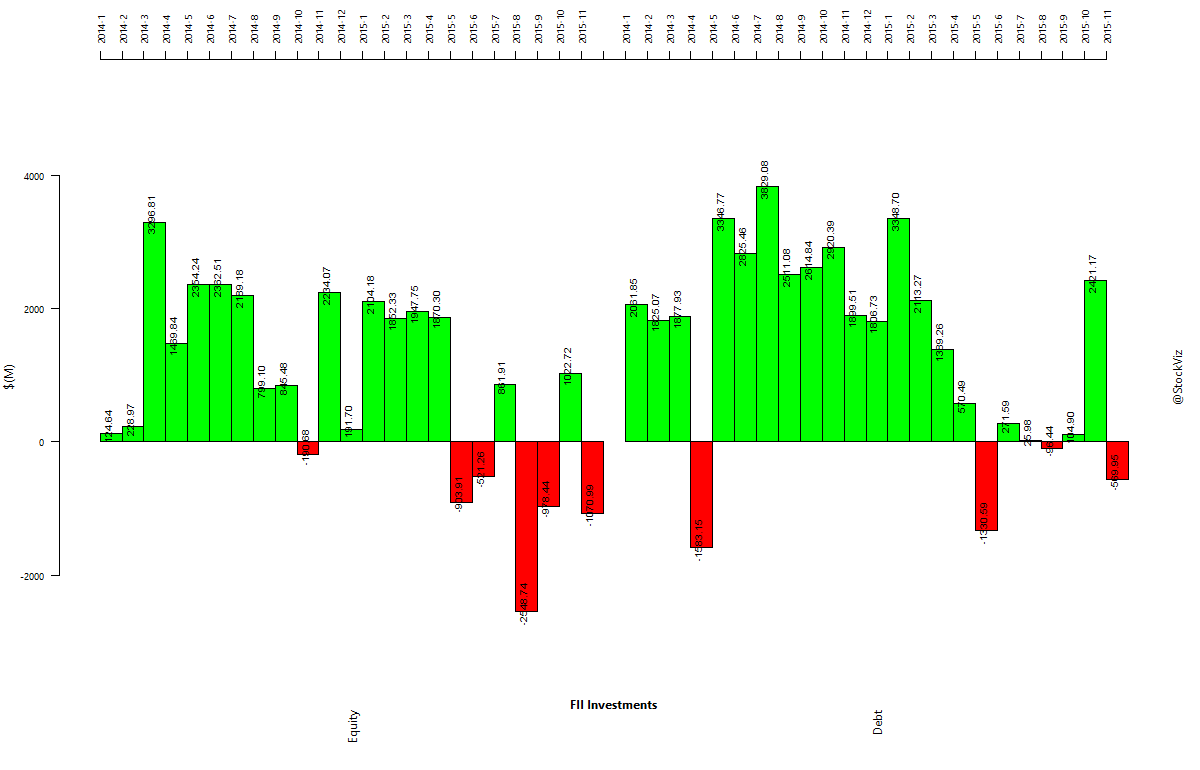
FPIs sold off both bonds and equities…

dii-investments.2014-01-01.2015-11-30

fii-investments.2014-01-01.2015-11-30

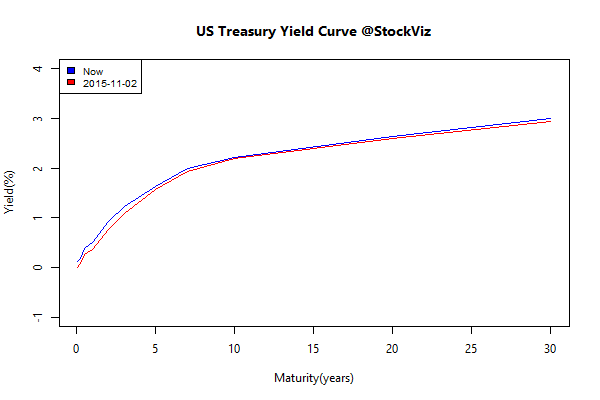
US Yield Curve

ust-yield-curve.2011-01-18

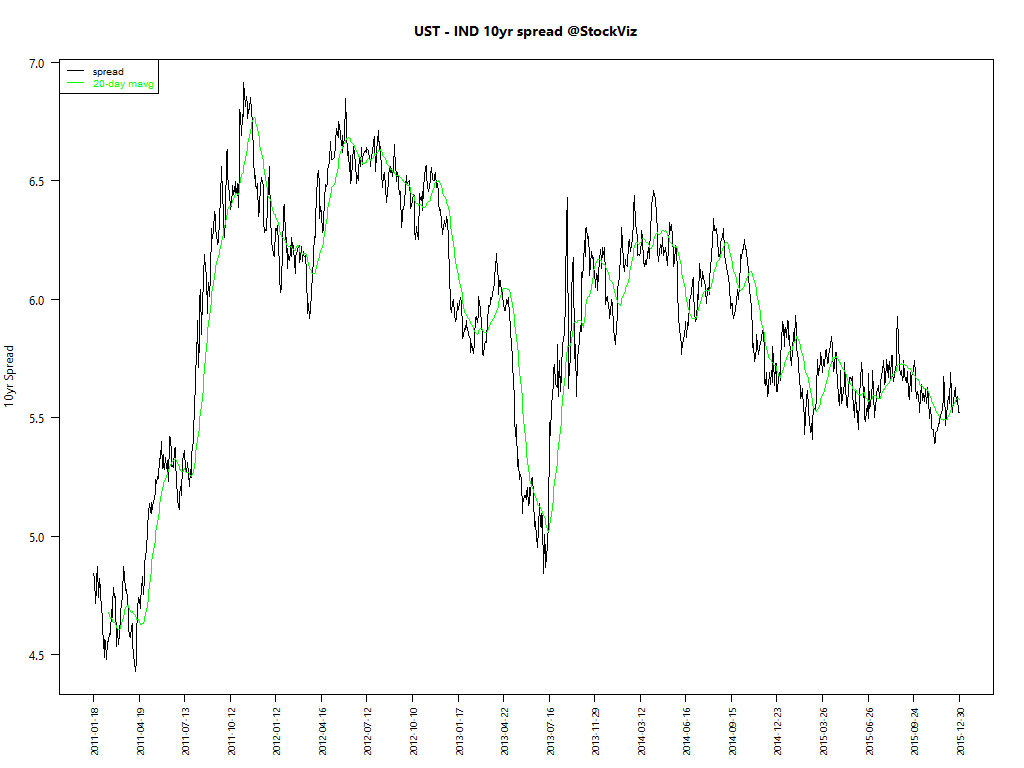
Spread between Indian and US long bonds

ust-ind-10yr-spread.2011-01-18

Theme: Acceleration Update 01.12.2015

Introduction

Momentum strategies are based on measures of “speed” – change in price (distance traveled) over a specific unit of time. Acceleration goes one step further and measures the rate of change of momentum. This strategy is relatively new – we set it up in the middle of November. It would be interesting to see how this strategy pans out.

Performance summary

held since returns (%)
8KMILES
2015-Nov-19
+0.54
GODFRYPHLP
2015-Nov-19
+19.06
RAJESHEXPO
2015-Nov-19
+3.81
GAYAPROJ
2015-Nov-19
+9.19
JUBILANT
2015-Nov-19
+2.91
COSMOFILMS
2015-Nov-19
+1.02
RUSHIL
2015-Nov-19
+3.29
MANGALAM
2015-Nov-19
+40.62
HIMATSEIDE
2015-Nov-19
+6.74
ALLSEC
2015-Nov-19
+18.78
TVSELECT
2015-Nov-19
+2.29
NIITLTD
2015-Nov-19
+7.47
PTL
2015-Nov-19
+8.51
ESTER
2015-Nov-19
+8.71
TRIGYN
2015-Nov-19
+25.91
EMMBI
2015-Nov-19
+22.39
TRIDENT
2015-Nov-19
+8.37
GUFICBIO
2015-Nov-19
+24.46
NITCO
2015-Nov-19
+20.29
MERCATOR
2015-Nov-19
+4.63
Since the last rebalance on 2015-Nov-19 till 2015-Nov-30, this strategy has returned +9.70%

You can find more details about the Acceleration Theme here.