I came across some interesting articles on how urban legends are born and kept alive. This is especially true of readers who skim an academic discipline, for example, by reading Malcom Gladwell, and don’t put in the effort to stay updated. And just how the secret of advertising is repetition, repetition, repetition, some “truths” stick around long after they have been debunked simply because they get repeated often enough.
The 10,000 hour rule
Made famous by Outliers by Malcolm Gladwell, the 2008 book’s “10,000-hour rule” turned most “Soccer Moms” into “Tiger Moms.” However, we now know that Gladwell’s book mistook the average of 10,000 hours that experts took to master a skill with the total they required. Plenty of studies suggest that aside from practice hours, individual differences help explain success: from socioeconomics to coaching to I.Q.
However, they myth lives on as more and more people read the book and not the errata.
Source: National Geographic
Is Spinach a good source of iron?
In 1981 and again in 1995:
The myth from the 1930s that spinach is a rich source of iron was due to misleading information in the original publication: a malpositioned decimal point gave a 10-fold overestimate of iron content.
In 2011:
The story that the iron content of spinach was a myth based on a misplaced decimal point is itself a myth. Spinach has a lot of iron, just like other green vegetables, but it is unavailable for absorption.
So spinach is useless as a source of iron. But not because of a measurement error. Try to get your mom to believe it.
Source: SagePub
Here be dragons
Daniel Kahneman: “A reliable way to make people believe in falsehoods is frequent repetition, because familiarity is not easily distinguished from truth. Authoritarian institutions and marketers have always known this fact.”
People deal with statistical illiteracy by reacting with their gut. It makes us overreact to things that seem dangerous only because they’re unknown, and underreact to things that are dangerous but look benign.
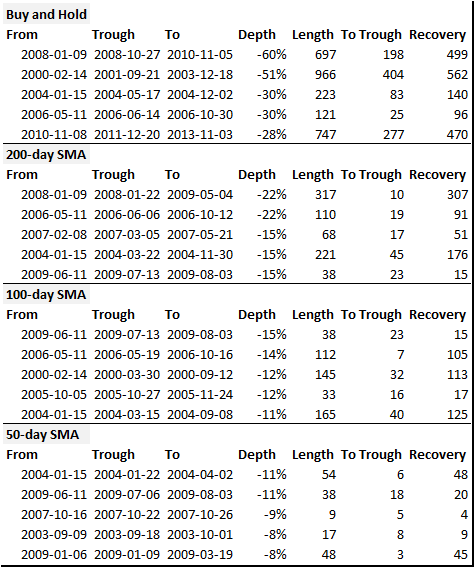
But tell this to a guy who believes in technical analysis and he’ll probably kill you.
Source: Fool.com