ETFs (Exchange Traded Funds) offer investors a convenient way to gain exposure to a particular index. Since these funds are not actively managed, they are measured by their how cheap they are (in terms of asset management fees) and their tracking error. Before we begin, some key terms:
Kurtosis
Kurtosis is a measure of “peakedness” of a distribution. For a normal distribution, Kurtosis is 3. Positive excess Kurtosis indicates fat tails while negative indicates peakedness.
Skew
Skewness is a measure of asymmetry of a distribution. Positive skew indicates a long right tail while a negative skew indicates a long left tail.
How effective have Indian ETFs been? Lets pull up some histograms and see for ourselves.
NIFTYBEES vs. CNX Nifty
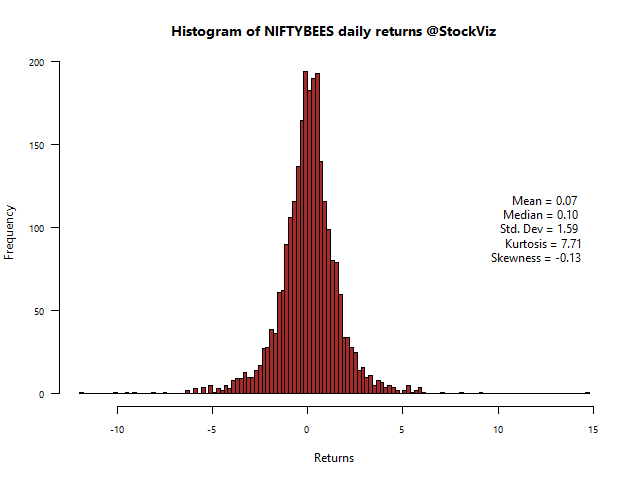
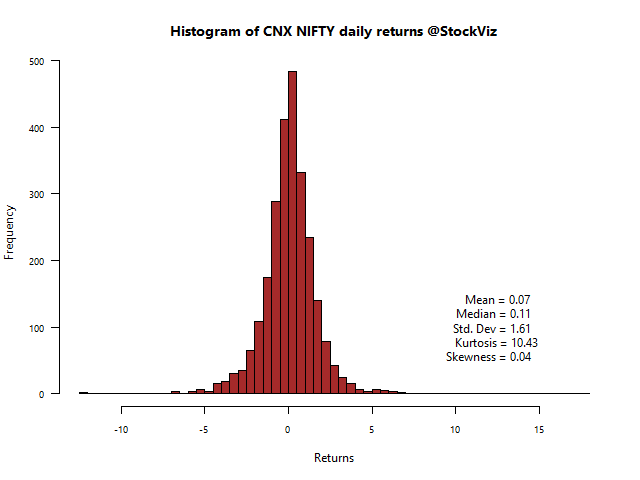
The Nifty ETF actually shows a -ve skew and a lower kurtosis compared to the index. This is how tracking error and fees manifests itself in daily returns. However, their impact on cumulative returns is minimal. The story for less liquid and higher-fee ETFs are different.
PSUBNKBEES vs. CNX PSU BANK
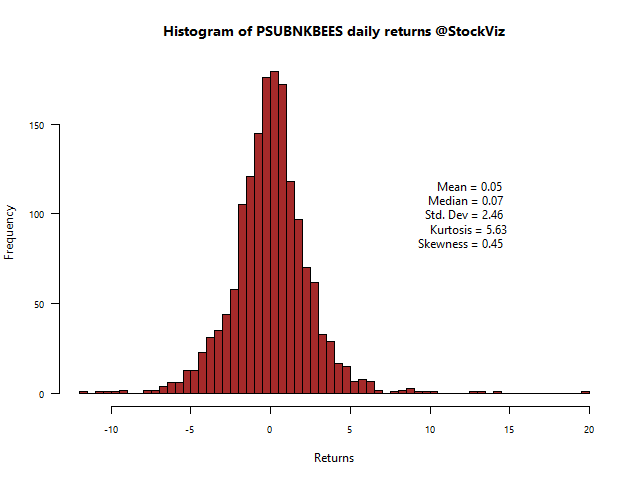
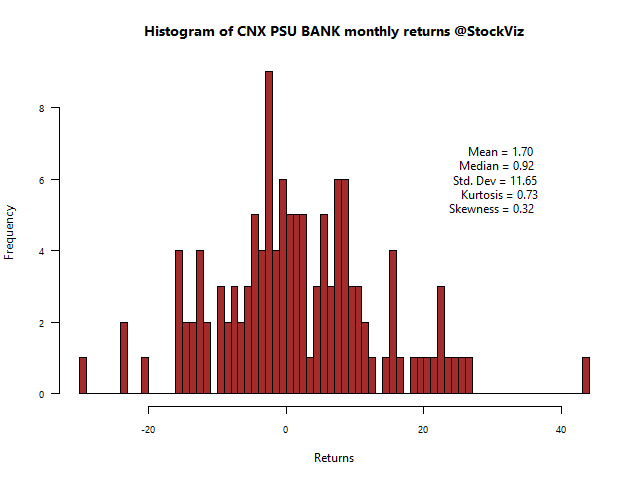
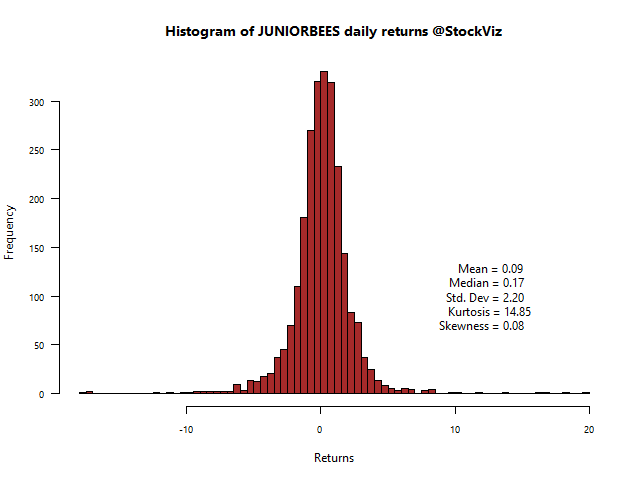
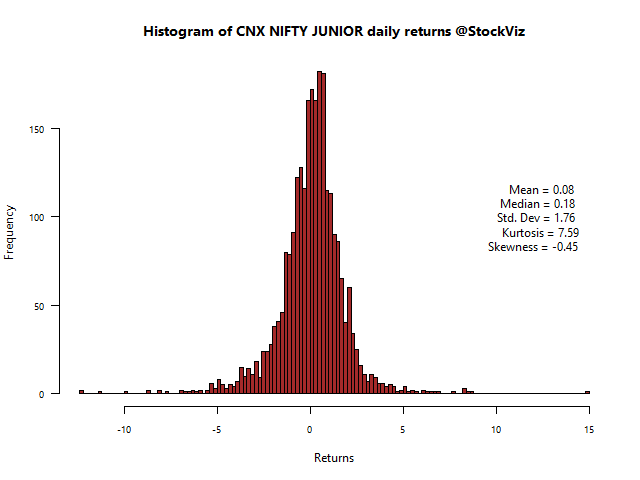
Notice the big difference in kurtosis and skewness? This is tracking error personified. The story for the Juniors’ are not that different.
JUNIORBEES vs. CNX NIFTY JUNIOR
Given that there really isn’t much of a push either from investors or from asset management firms on ETFs, the dynamics are unlikely to change in the short term.