Category: Investing Insight

Investing insight to make you a better investor.

The Pair Trading Tip-Sheet

During our back-testing for pair trading strategies, we found that we were most comfortable in going long the spread (when the spread is below its historical average) and betting on pairs within the same index. We have bundled all the assumptions into an easy to use pair trading “tip-sheet” that can be found here.

The pairs are computed at the end-of-day and live pair status is computed roughly once an hour. The p-value, beta and spread display both end-of-day data and live status side-by-side so that you can decide for yourself if going long the pair makes sense or not.

pair trading

It is still rough around the edges – you cannot really add a pair to your portfolio and track like you can do with option strategies. But once it is fleshed out, it will be available exclusively to your trading/demat customers.

Pair trading equity futures is not for the faint of heart. The capital at risk is bigger than what most individual investors can stomach. But when done right, the returns are commensurate with the risks.

Public Sector vs. MNCs

On the NSE, you can find two indices: CNX PSE and CNX MNC. They have been around since Jan-1995 – providing a quantifiable glimpse into how badly Nehruvian socialism has fared in modern India.

Cumulative Returns

CNX PSE: +247.69%
CNX MNC: +619.05%

CNX PSE-returns

CNX MNC-returns

Value traps

There has been a lot of talk recently about reforming PSEs. The SEBI wants the 25% public shareholding rule to apply to all public sector companies as well. The earlier (UPA-2) government, finding no takers for PSE stock, got Goldman to form an ETF to put some lipstick on the sector. The Rajiv Gandhi Equity Savings Scheme gave out tax sops to get retail investors into “Maharatna, Navratna, or Miniratna” stocks.

As much as I would like to believe that things are going to be different this time, you can’t dismiss the fact that PSEs have only lost money for investors. Once the crutches come off, these firms will anyway have to go through gut-wrenching transformations to compete in the real world. That would be a better trigger to enter these stocks (if and when they happen) rather than now when all we have are promises.

Public Sector Banks: Is this time different?

A tale of three indices

The NSE has three financial indices listed that provides a rare window into how different parts of the financial sector has performed over the years.

Index Inception Date
CNX PSU BANK 2004-01-01
CNX FINANCE 2004-01-01
CNX BANK 2000-01-01

Return profiles

Returns in the financial sector comes with some very fat tails. If one could consult an oracle on the timing of these big swings, there’s a pretty packet for them.

CNX FINANCE-returns-histogram

CNX BANK-returns-histogram

CNX PSU BANK-returns-histogram

Cumulative returns

If you had stayed invested since 2004-01-01, here’s how much you would have made:

Index Cumulative returns
CNX FINANCE 495%
CNX BANK 455%
CNX PSU BANK 265%

Note: These are cumulative numbers, not annualized returns

CNX FINANCE-returns

CNX BANK-returns

CNX PSU BANK-returns

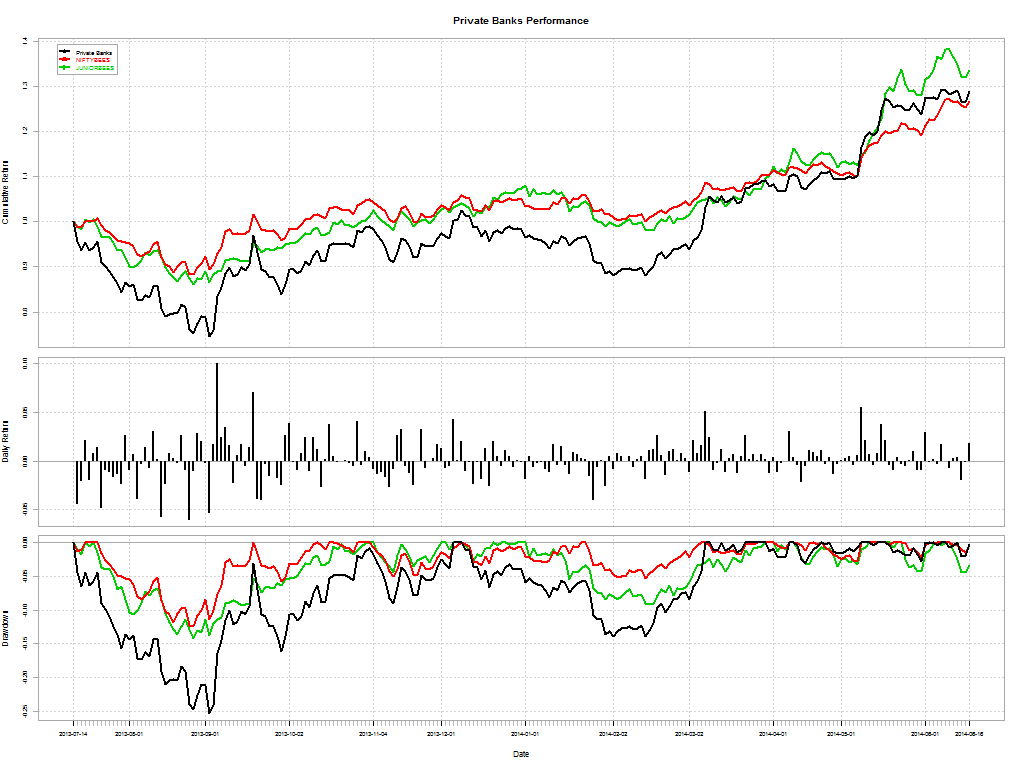
If you notice, PSU banks are yet to recover from the draw-down that occurred August-2013.

Investors have been on a PSB binge ever since the Modi effect took shape. Will this time be different for investors?

[stockquote]PSUBNKBEES[/stockquote] [stockquote]BANKBEES[/stockquote]

ETFs vs. Indices

ETFs (Exchange Traded Funds) offer investors a convenient way to gain exposure to a particular index. Since these funds are not actively managed, they are measured by their how cheap they are (in terms of asset management fees) and their tracking error. Before we begin, some key terms:

Kurtosis

Kurtosis is a measure of “peakedness” of a distribution. For a normal distribution, Kurtosis is 3. Positive excess Kurtosis indicates fat tails while negative indicates peakedness.

Skew

Skewness is a measure of asymmetry of a distribution. Positive skew indicates a long right tail while a negative skew indicates a long left tail.

How effective have Indian ETFs been? Lets pull up some histograms and see for ourselves.

NIFTYBEES vs. CNX Nifty

NIFTYBEES-returns-histogram

CNX NIFTY-returns-histogram

The Nifty ETF actually shows a -ve skew and a lower kurtosis compared to the index. This is how tracking error and fees manifests itself in daily returns. However, their impact on cumulative returns is minimal. The story for less liquid and higher-fee ETFs are different.

PSUBNKBEES vs. CNX PSU BANK

PSUBNKBEES-returns-histogram

CNX PSU BANK-returns-histogram

Notice the big difference in kurtosis and skewness? This is tracking error personified. The story for the Juniors’ are not that different.

JUNIORBEES vs. CNX NIFTY JUNIOR

JUNIORBEES-returns-histogram

CNX NIFTY JUNIOR-returns-histogram

Given that there really isn’t much of a push either from investors or from asset management firms on ETFs, the dynamics are unlikely to change in the short term.

Alibaba: The Riddle Wrapped in an Enigma

We are setup for an epic fight between Amazon and Alibaba in the US. Something that will be keenly watched by the Bansals, now that they want to be Alibaba instead of Amazon (LiveMint). But what exactly is Alibaba? How did they become a multi-billion dollar company with a finger in every pie?

Alibaba is a lot of different things for different people

alibaba-comparison

If you think it looks like a land-grab, you are right. They basically asked: What would a newly online Chinese consumer want? And connected the dots.

Alibaba is huge

The Wall Street Journal says that Alibaba’s Taobao and Tmall sites reached $240 billion in combined transaction volume last year. By way of contrast, EBay posted $76.5 billion last year in so-called “gross merchandise volume” excluding vehicles.

Alibaba now handles roughly 80% of all online shopping in China. Alipay is not only a payments processor (the world’s largest, at that) but also runs a money-market fund with more than $65 billion in assets.

What are investors buying?

Its hard to say. Alibaba stock will buy investors a stake in a Cayman Islands-registered entity which is under contract to receive the profit from Alibaba’s lucrative Chinese assets but will not actually own them.

The reason is that China permits privately controlled firms in some industries to tap foreign markets by establishing offshore companies permitted to wholly own Chinese companies. Yet it prohibits foreign investments in certain restricted industries, including the Internet. These controlled industries must be owned by Chinese nationals; no foreign investment are allowed.

So, the work-around has been to establish ownership by Chinese nationals, while setting up an offshore company that can be publicly listed. Mimic an owner relationship by setting up contracts between the two parties so that the offshore public firm reaps the successes of the Chinese firm — without actually owning shares in it.

Basically, investors are buying into a story.

Can Flipkart + Myntra = Alibaba?

Hard to say. Social networking in India is basically owned by Facebook (+ WhatsApp). Uber is here, and so are half a dozen home-grown taxi “startups.” Online payments are heavily regulated by the RBI and payments startups are in round 2 of the hunger games. Amazon.in is a looming threat and selling other people’s brands is a lousy business model. Its probably too late to be the “Alibaba of India”… and its probably going to be tougher just hanging on to being the “Amazon of India.”

Besides, isn’t “______ of [something]” a red flag for most venture capital firms? But it seems like its a story that investors are willing to hang their hat on for now.

Sources: