Tag: pair trading

USDINR and Dollar Indices

Introduction

The FRED publishes the following indices along with USDINR (DEXINUS):
DTWEXB: Trade Weighted U.S. Dollar Index: Broad
DTWEXM: Trade Weighted U.S. Dollar Index: Major Currencies
DTWEXO: Trade Weighted U.S. Dollar Index: Other Important Trading Partners

Can the spread between USDINR and these indices be traded?

Introduction: Part I, Part II

Back-test on daily returns

Should you bet on convergence, divergence of momentum?
Read: Part III

Back-test on weekly returns

Does the daily-return series analysis carry through to weekly returns?
Read: Part IV

Pair Trading

Linear regression

Examining linearity between two stocks – linear regression and interpreting results.
Read: Relationship between a pair of stocks

Co-integration

How do you conclude that a pair of stocks move together?
Read: Bank Nifty vs. HDFC Bank and ICICI Bank

Finding Pairs

Correlation, spreads and co-integration.
Read: Finding Pairs to Trade

Hedge ratio

Hedge ratios, spreads and significance.
Read: The Bank Nifty – ICICI Bank Pair

A pair trading strategy

A simple trading strategy: buy the spread if it is one standard deviation below the average and sell the spread if its is one standard deviation above the average.
Read: Backtesting a Pair Trading Strategy

The Pair Trading Tip-Sheet

During our back-testing for pair trading strategies, we found that we were most comfortable in going long the spread (when the spread is below its historical average) and betting on pairs within the same index. We have bundled all the assumptions into an easy to use pair trading “tip-sheet” that can be found here.

The pairs are computed at the end-of-day and live pair status is computed roughly once an hour. The p-value, beta and spread display both end-of-day data and live status side-by-side so that you can decide for yourself if going long the pair makes sense or not.

pair trading

It is still rough around the edges – you cannot really add a pair to your portfolio and track like you can do with option strategies. But once it is fleshed out, it will be available exclusively to your trading/demat customers.

Pair trading equity futures is not for the faint of heart. The capital at risk is bigger than what most individual investors can stomach. But when done right, the returns are commensurate with the risks.

Backtesting a Pair Trading Strategy

A pairs trading strategy involves answering these questions:

  1. How do you identify “stocks that move together?”
  2. Should they be in the same industry?
  3. How far should they have to diverge before you enter the trade?
  4. When is a position unwound?

We saw how to answer the first two questions: understanding, defining, finding, and investigating pairs.

Trading strategy

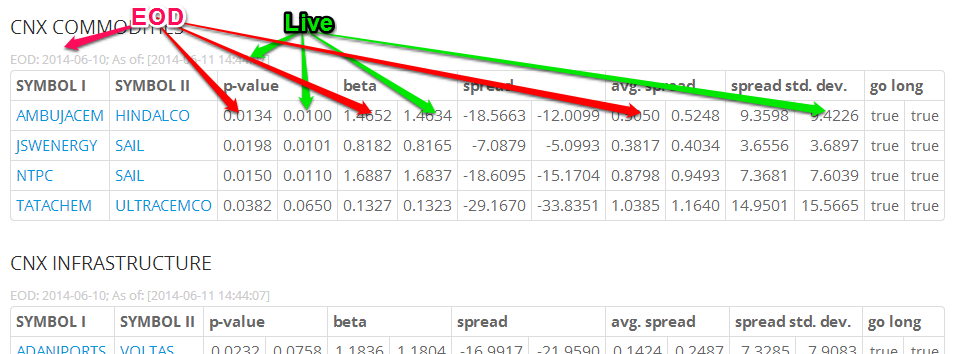
We can start with a simple trading strategy: we buy the spread if it is one standard deviation below the average and sell the spread if its is one standard deviation above the average.

To keep things simple, we’ll ignore execution details like lot-size, actual $ p&l, etc… and focus on the viability of the strategy. We calculate p&l in terms of unit-spread, i.e., how many ‘spreads’ of p&l did the strategy create?

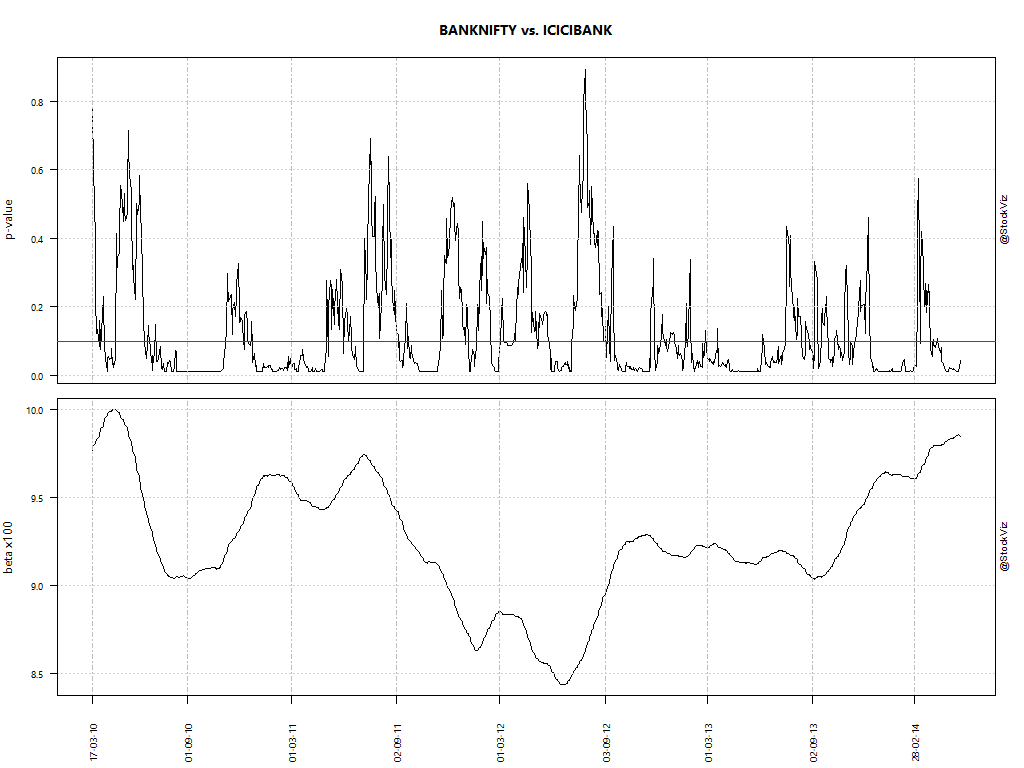
For BANKNIFTY vs. ICICIBANK, we simulated the strategy outlined above based on the daily close of the nearest to expiry futures from Jan-2010:

BANKNIFTY - ICICIBANK pair trade backtest 50 2010-01-01 long-short

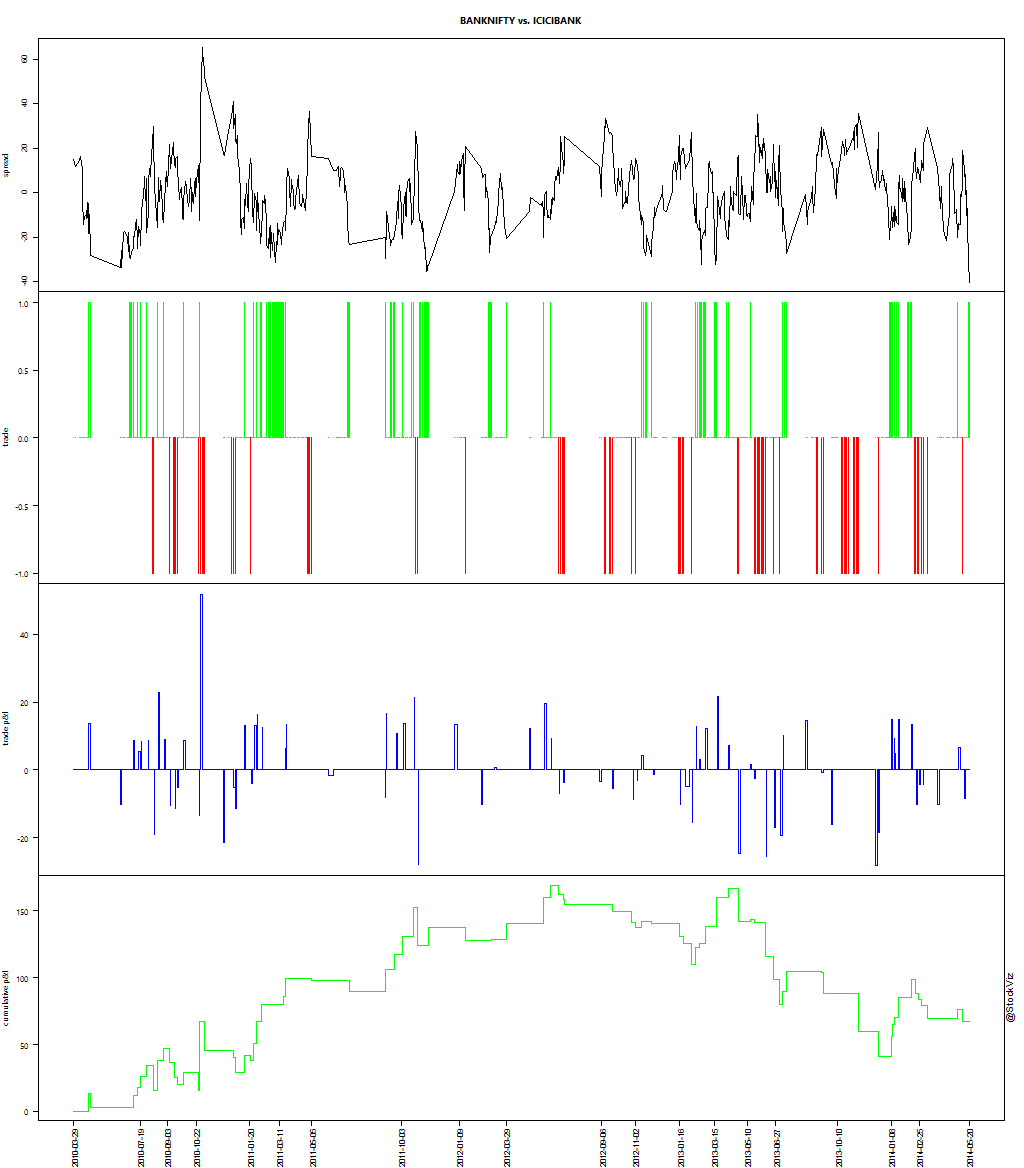
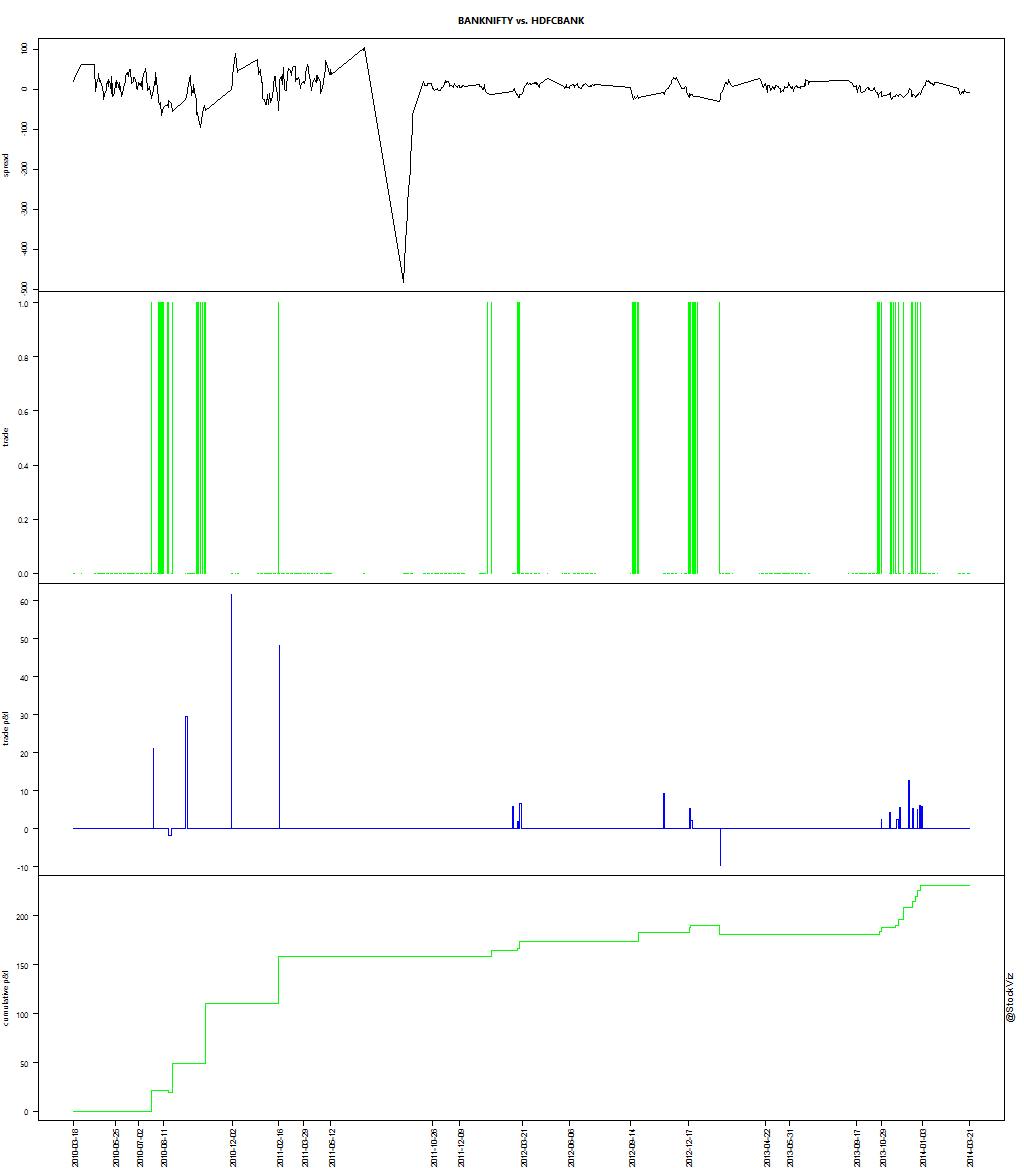
The top chart is the the spread.
The 2nd is the trade: green implies the strategy went long the spread, red implies short.
The 3rd chart indicates the p&l of that specific trade (in spreads).
The last chart indicates the cumulative p&l (in spreads).
 
The p&l for this strategy over the entire time-period is +69.3189 spreads.

Asymmetric strategy

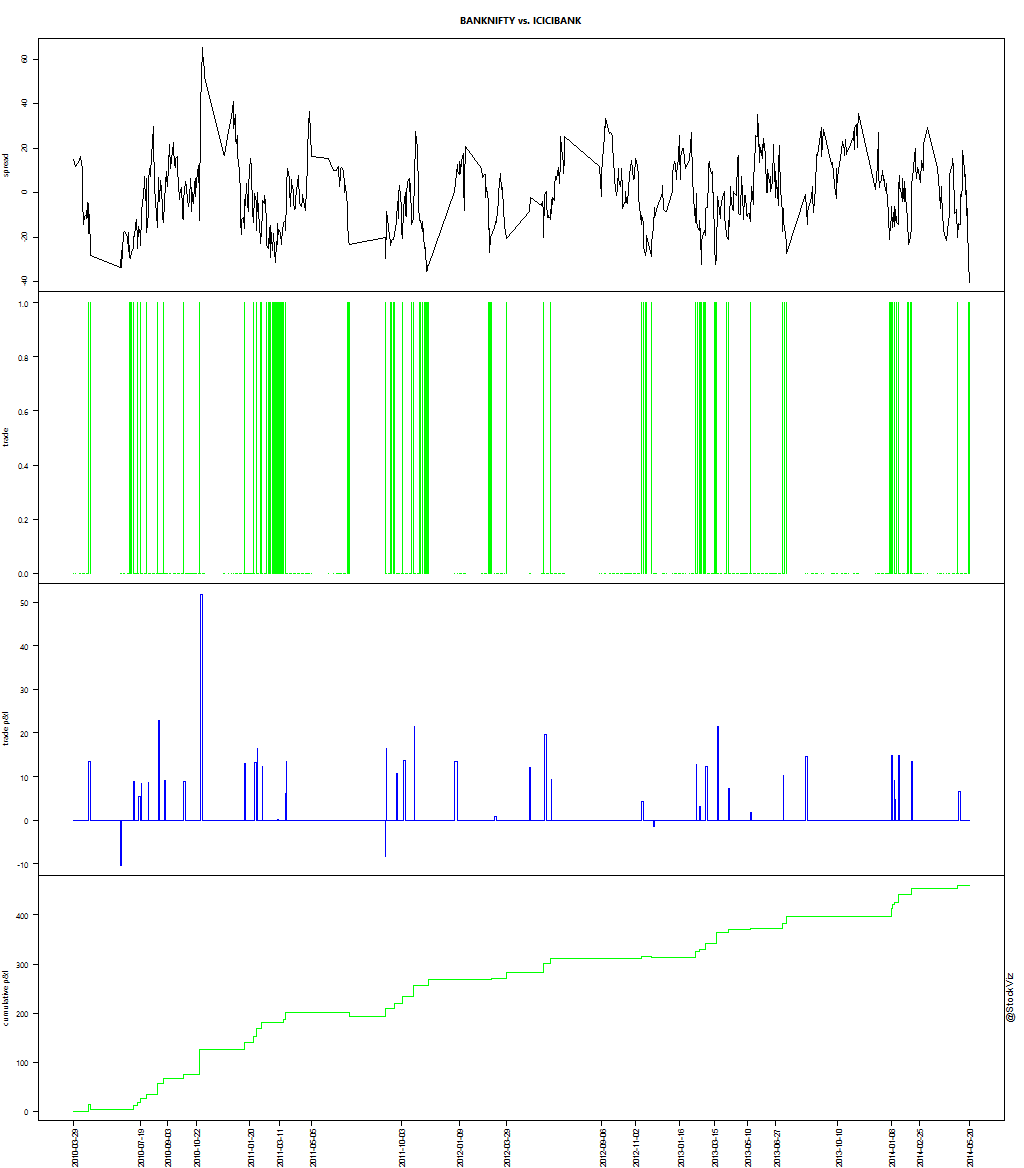
The idea behind the above strategy is to bet on mean-reversion on both sides. However, if you see closely, the shorts were not nearly as profitable as the longs. You could be better off just going long the spread whenever it hit one standard deviation and staying out of the market when the spread hit the upper band.

BANKNIFTY vs. ICICIBANK, long-only p&l +454.3036:

BANKNIFTY - ICICIBANK pair trade backtest 50 2010-01-01 long only

BANKNIFTY vs. HDFCBANK, long-only p&l +231.5225:

BANKNIFTY - HDFCBANK pair trade backtest 50 2010-01-01 long only

Conclusion

Some caveats:

  1. The signals are intermittent, but you need to keep running the algorithms everyday to capture the alpha. This requires an investment in systems on your part.
  2. The backtest ignores execution risk. For example, the hedge ratio is around 0.09830581 and there’s no way you can trade 1/10th of a contract. So your actual executable spread = 10 ICICIBANK – BANKNIFTY. That’s 11 contacts and it still doesn’t give you precision.

On the plus side:

  1. The backtest doesn’t do any risk management. This would’ve stop-loss’ed most of the bad trades.
  2. There is money to be made on the right pairs.

The Bank Nifty – ICICI Bank Pair

We defined the spread between a pair to be:

spread = A – βB

where A and B are prices and β is the first regression coefficient.

The β is also known as the hedge ratio.

Neither β, nor the relationship is “guaranteed” to be stable. Here are the p-values and β of Bank Nifty vs. ICICI Bank nearest to expiry futures, with a 50-day look-back:

BANKNIFTY - ICICIBANK p-value and beta 50

As you can see, the spread has periods of stability and adjustment. And sometimes, the stability is the anomaly.

To be continued…