Category: Investing Insight

Investing insight to make you a better investor.

Relationship between a pair of stocks

Linear Regression

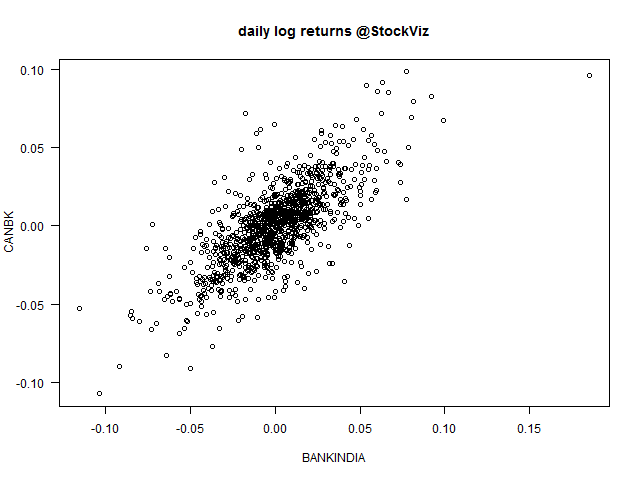
The easiest relationship to examine between a pair of stocks is linearity. You can try and fit a linear model through their daily log returns first and then decide further course of action.

Here’s a scatter-plot that shows how Bank of India and Canara Bank could be related to each other.

BANKINDIA-CANBK

Results of linear regression:

Residuals:
      Min        1Q    Median        3Q       Max 
-0.055050 -0.009995  0.000331  0.009440  0.063258 

Coefficients:
              Estimate Std. Error t value Pr(>|t|)    
(Intercept) -0.0002843  0.0006817  -0.417    0.677    
BANKINDIA    0.7451950  0.0232860  32.002   <2e-16 ***
---
Residual standard error: 0.01638 on 575 degrees of freedom
Multiple R-squared:  0.6404,    Adjusted R-squared:  0.6398 
F-statistic:  1024 on 1 and 575 DF,  p-value: < 2.2e-16

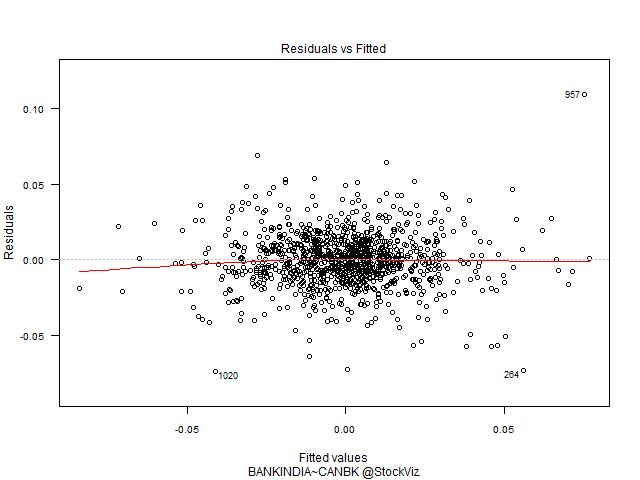
After fitting a regression model it is important to determine whether all the necessary model assumptions are valid before performing inference. If there are any violations, subsequent inferential procedures may be invalid resulting in faulty conclusions. Therefore, it is crucial to perform appropriate model diagnostics.

Residuals vs. Fitted

Residuals are estimates of experimental error obtained by subtracting the observed responses from the predicted responses. The predicted response is calculated from the model after all the unknown model parameters have been estimated from the data. Ideally, we should not see any pattern here.

BANKINDIA-CANBK-1

BANKINDIA-CANBK-3

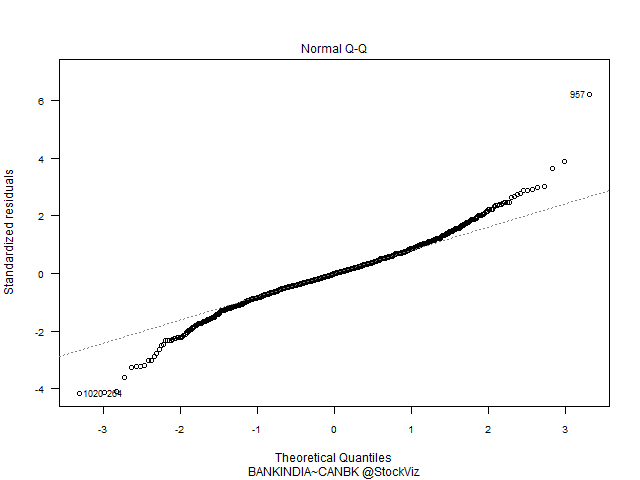
Q-Q Plot of Residuals

The QQ Plot shows fat tails.

QQ plot BANKINDIA-CANBK-2

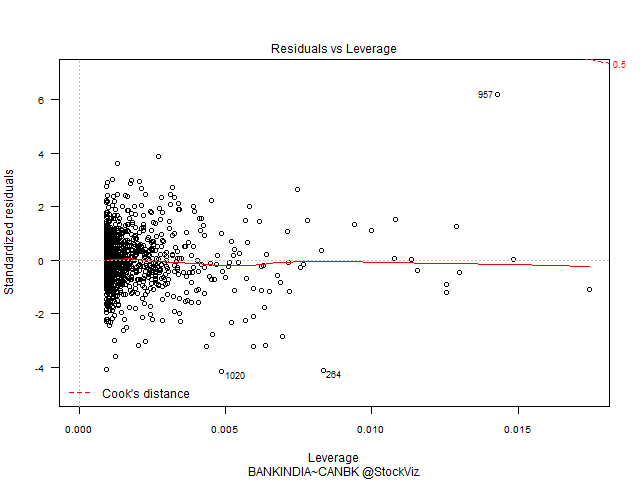
Residuals vs. Leverage

The leverage of an observation measures its ability to move the regression model all by itself by simply moving in the y-direction. The leverage measures the amount by which the predicted value would change if the observation was shifted one unit in the y-direction. The leverage always takes values between 0 and 1. A point with zero leverage has no effect on the regression model. If a point has leverage equal to 1 the line must follow the point perfectly.

Labeled points on this plot represent cases we may want to investigate as possibly having undue influence on the regression relationship.

BANKINDIA-CANBK-4

Conclusion

A linear model on daily log returns may not be the best way to understand the relationship between the two stocks. We can either change the model (linear) or change the attribute (daily log returns) that we are using.

To be continued…

Source: Model Diagnostics for Regression

Nifty Statistical Study

Returns vs. Log Returns

We had discussed how the most important assumption in finance is that returns are normally distributed. Also, the benefit of using returns, versus prices, is normalization. All your variables are now on the same scale and can be compared easily. But if you pick up any book on financial statistical modelling, you’ll run into log returns more often.

nifty-daily-returns

nifty-daily-log-returns

As you can see from the charts above, visually, they don’t make a difference. However, taking the log of returns makes the math easier:

  1. If we assume that prices are distributed log normally, then log(1+ri), where ri is the ith period return, is normally distributed. And we know how to work with normal distributions.
  2. When returns are very small, log(1+ri) ≈ r
  3. Calculating compounding return goes from series multiplication (∏) to series summation (∑).

nifty-histogram

nifty-log-histogram

Quantiles

The easiest way to summarize a frequency distribution is through quantiles. Quantiles are values which divide the distribution such that there is a given proportion of observations below the quantile. For example, the median is a quantile such that half the points are less than or equal to it and half are greater than or equal to it.

Raw-returns (%):

1% 5% 25% 50% 75% 95% 99%
-4.1986 -2.4994 -0.6992 0.0967 0.8585 2.4387 4.4465

Log-returns:

1% 5% 25% 50% 75% 95% 99%
-0.04289 -0.0253 -0.0070 0.0009 0.0085 0.0240 0.0435

Q-Q Plot

Once we know the qunatiles of our log returns, we can compare it to that of a normal distribution. When you plot the quantiles of the sample (Nifty daily log returns) to the quantiles of a theoretical normal distribution, you get a visual feel for the outliers – the fat tails.

nifty-log-returns-normal-qq-plot

This plot shows that both tails are heavier than the tails of the normal distribution. So, although using log returns and assuming that prices are distributed log normally makes the math easier, we should always be aware that it is a sleight of hand.

To be continued…

Sources:

Musings on stock-market forecasts

Traffic jams

Say there’s a traffic jam on a busy road. When new vehicles try to enter the same route, the drivers hear on the radio that there’s a jam ahead and adapt by finding another route. Suppose there is only one alternate route. What happens now? The alternate route forms a second jam!

Later entrants have to choose between the two jams. Predicting the actions of this new group is very hard to do. Maybe the second jam is worse than the first. By the time we hit this third layer of participants, predicting the behavior of the system has become extremely difficult, if not impossible.

Complex vs. Complex Adaptive

Weather is a complex system. However, if, on Thursday, the forecast is for rain on Sunday, is the rain any less likely to occur? No. The act of predicting has not influenced the outcome. Although near-term weather is extremely complex, with many interacting parts leading to higher order outcomes, it does have an element of predictability.

The stock-market is a complex adaptive system. Traders and investors in the market are interacting with one another constantly and adapting their behavior to what they know about others’ behavior. The key element of a complex adaptive system is the social element.

For example, Meredith Whitney predicted the crash of Citibank in late 2007.

citi chart

She went on to setup her own advisory firm, Meredith Whitney Advisory Group, and made a similar call on American municipal bonds in late 2010 on national television. Retail investors sold in panic. But for the the most parts, nothing happened.

MUB chart

Reflexivity

Reflexivity refers to circular relationships between cause and effect. A reflexive relationship is bidirectional with both the cause and the effect affecting one another in a situation that does not render both functions causes and effects. It flies in the face of equilibrium theory, which stipulates that markets move towards equilibrium and that non-equilibrium fluctuations are merely random noise that will soon be corrected.

Reflexivity asserts that prices do in fact influence the fundamentals and that these newly-influenced set of fundamentals then proceed to change expectations, thus influencing prices; the process continues in a self-reinforcing pattern.

Takeaway

Behavioral dynamics is key to understanding complex adaptive systems. One should have a mental model that incorporates higher-order thinking when it comes to navigating the markets.

The big question is, how different is listening to stock-market predictions from listening to an astrologer, reading horoscopes or believing in vastu?

To quote German theologian and martyr Dietrich Bonhoeffer:

“…how wrong it is to use God as a stop-gap for the incompleteness of our knowledge. If in fact the frontiers of knowledge are being pushed further and further back (and that is bound to be the case), then God is being pushed back with them, and is therefore continually in retreat. We are to find God in what we know, not in what we don’t know.”
Sources
Related articles

What if: abki baar NO modi sarkar?

What if Modi fails to become the prime minister of India? Some are expecting the Nifty to crack by 1000 points in such a scenario. Although not a perfect hedge, a bear spread makes sense – think of it as insuring your portfolio against the adverse outcome.

NIFTY May 6600/6750 Long Put Spread

NIFTY May 6600-6750 Long Put Spread

The Nifty will have to expire below 6695.00 for the trade to be profitable. The max profit is Rs. 4750.00 and the cost to enter the trade (and max loss) is Rs. 2750.00.

NIFTY May 6600-6750 Long Put Spread payoff
NIFTY May 6600-6750 Long Put Spread PL

Thought process

This trade can be best described as buying a limited form of insurance. You are assuming that the Nifty will not fall too far below 6600 and losses are not going to be catastrophic. You could go farther down the option chain if you are feeling too nervous, but then your δs will get smaller so you will have to buy more spreads to cover your portfolio.

For example, if you did a NIFTY May 6500/6600 Long Put Spread instead, you will be moving the break-even to 6569.70, pay less (Rs. 1515.00) for a max profit of Rs. 3485.00. But the delta of this spread is -0.08 vs. -0.15 for spread described above.

Exiting the trade

The result of this election is expected to be declared on 16 May (Friday). Exit soon after election results are announced or right before it if the trade is profitable.

Read more about options: Options Trading Guide

Of whatsnexters, horoscopes and personal experiences

Can Stock Market Forecasters Forecast?

It’s time we stopped listening to the “whatsnexters.” These folks are everywhere in the financial media pontificating confidently about what they can’t possibly know — what’s next for the economy or the stock market.

Read: Don’t let market pundits lead you astray

Good to Great

The story of success swarms statistics. And there’s always enough random success to justify almost anything to someone who wants to believe.

Read: Stories triumph Statistics

A case for rules-based investment methodology

Our personal experiences disproportionately impact our investing behavior. By simply repeating investing behaviors that resulted in good outcomes for us in the past, and avoiding those that resulted in poor outcomes, we’re potentially eliminating important information that could help future investment performance.

Read: Bad Investor Behavior: Overemphasizing Experience