FPIs liking India so far in November
After taking money out of Indian equities in October, looks like FPIs are back in the bid.
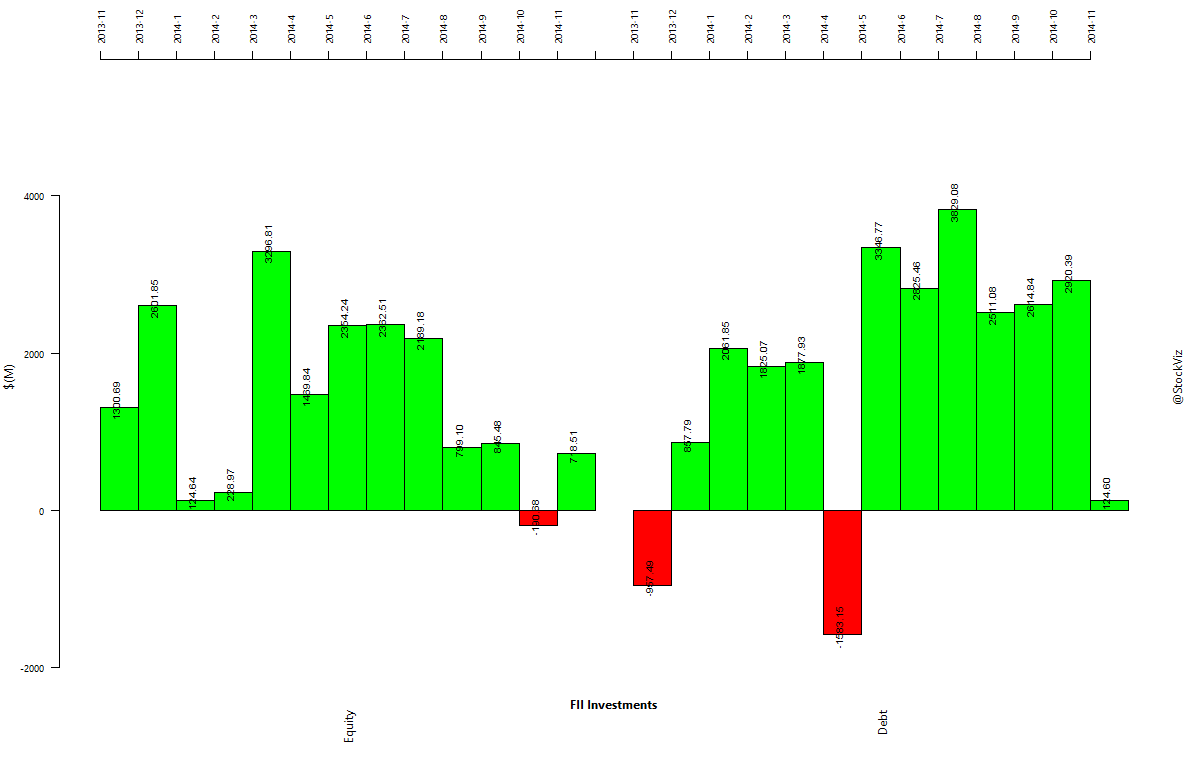
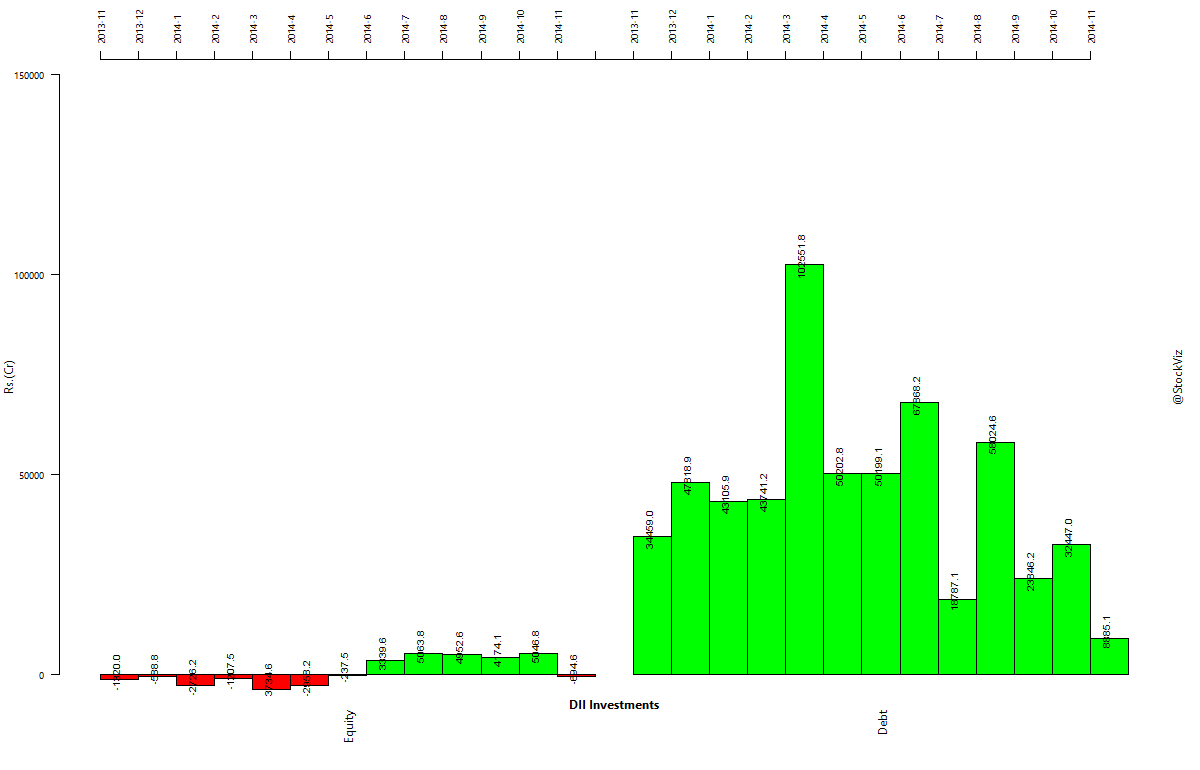
DIIs obsession with debt continues
Previously: FPI and Mutual Fund Investment Charts (August 2014)
Invest Without Emotions
Investing insights to make you a better investor.
After taking money out of Indian equities in October, looks like FPIs are back in the bid.
Previously: FPI and Mutual Fund Investment Charts (August 2014)
Yesterday, we asked a question: How would an SVM (Support Vector Machine) train if we gave it a 14-day RSI and 50-day SMA of the Nifty index? The goal was to use the SVM to first see if it can figure out a relationship between RSI and NIFTY and then check if we can turn that into a set of trading rules.
If you look at the predictions that the SVM gave for 2006, you can see two distinct areas where it went short (red contours) and where it went long (blue contours.) But the funny thing is, it went long when RSI > 50 (when the market is supposed to be overbought) and short when RSI < 40 (supposed to be oversold.)
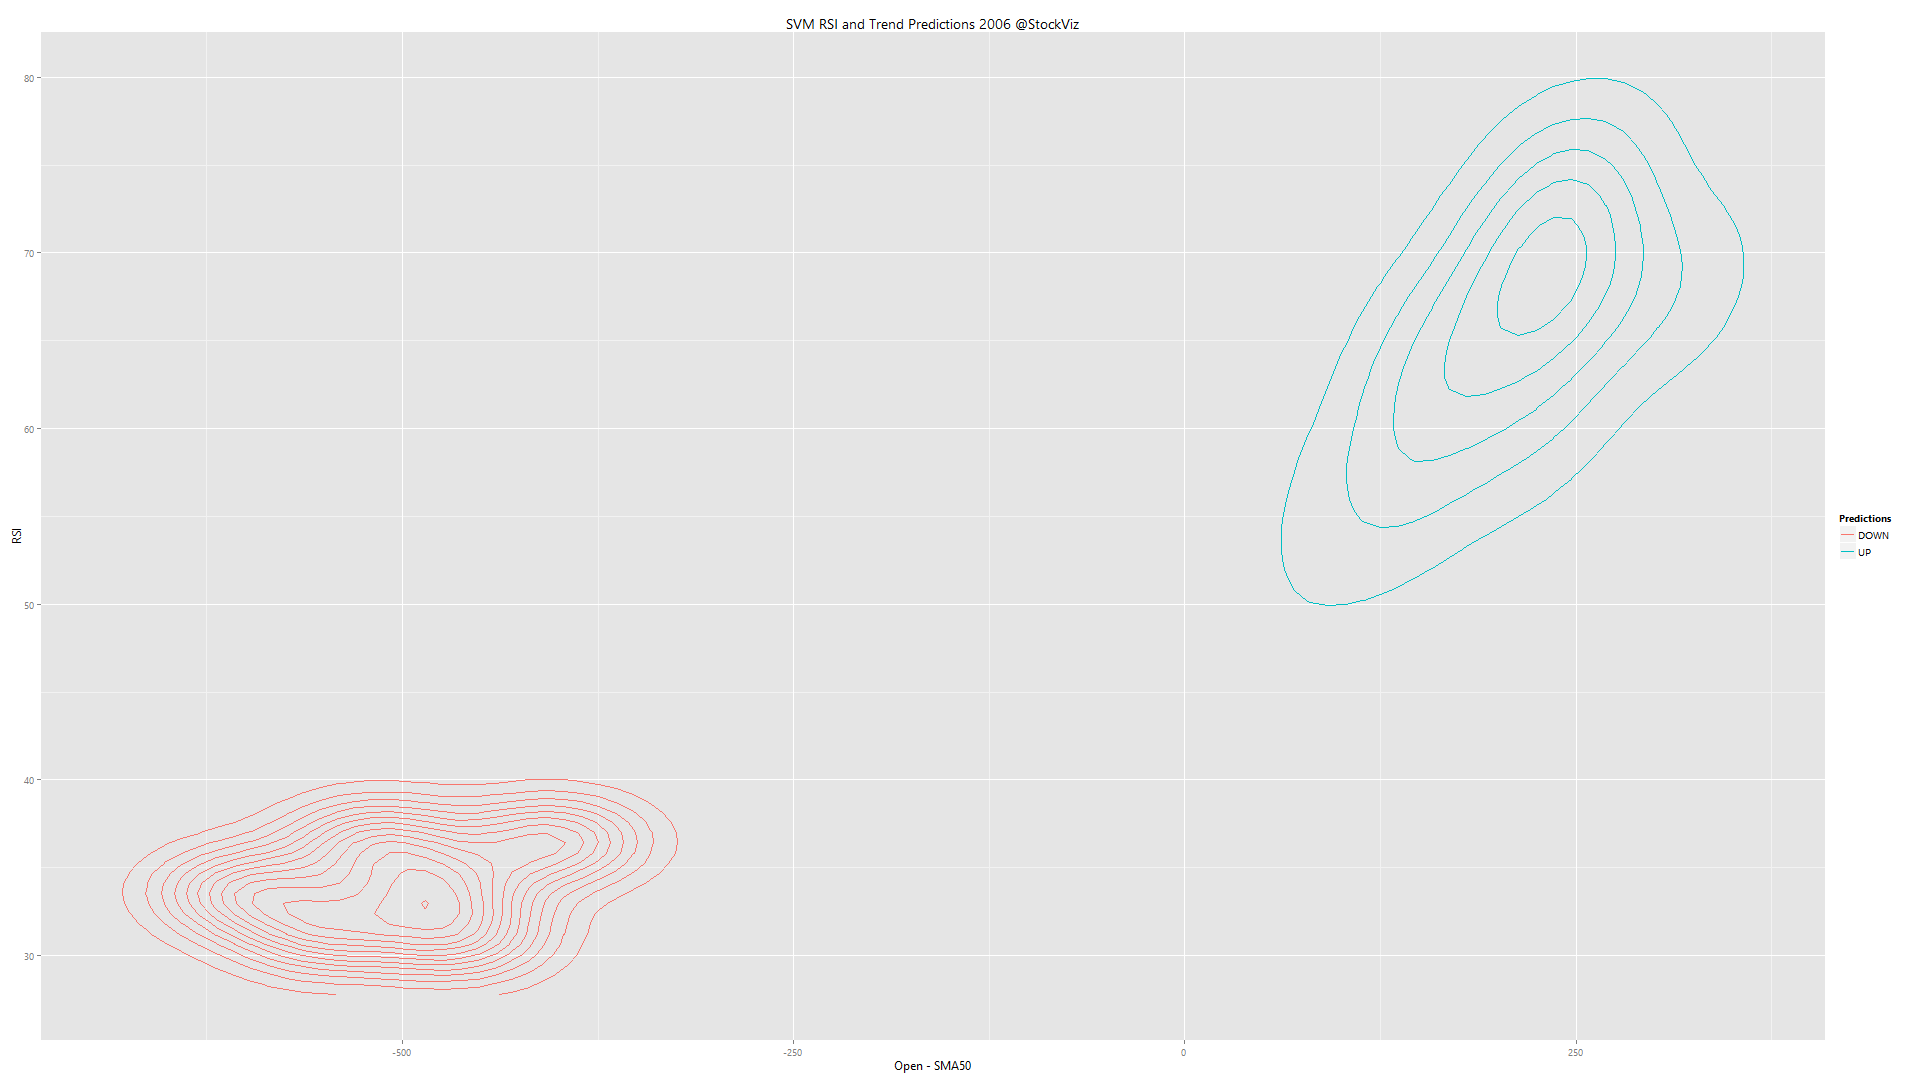
The kicker is that it followed the trend (x-axis) more than RSI (y-axis). In terms of predictive power, trend seems to be way more powerful than RSI, at least for the year 2006.
To check if we can actually setup any trading rules (trend x RSI = 4 combinations for buy/sell), we ran yearly training data through an SVM to check if there were any stable relationships. Here’s the video:
The contours change year to year, with little stability between them. Basically, a trading strategy based on RSI is going to be random.
Conventional wisdom has it that RSI values over 70 to represent overbought market conditions and under 30 to represent oversold market conditions. But where did these numbers, 70 and 30, come from? We already tested two naive RSI strategies that bombed spectacularly. We were curious as to what an SVM (Support Vector Machine) would do if we gave it a 14 day RSI and 50-day SMA of the Nifty index. This is what came out of it:
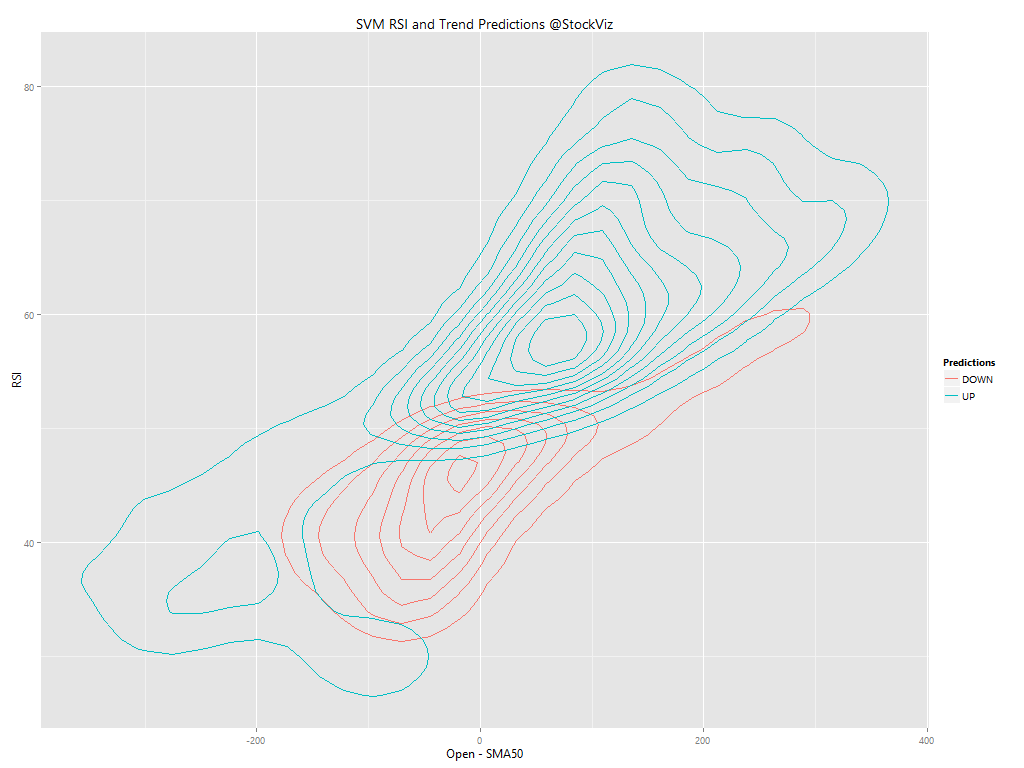
The bifurcation between long and short is pretty well defined. And is seems that trend overshadows RSI. Is RSI even relevant?
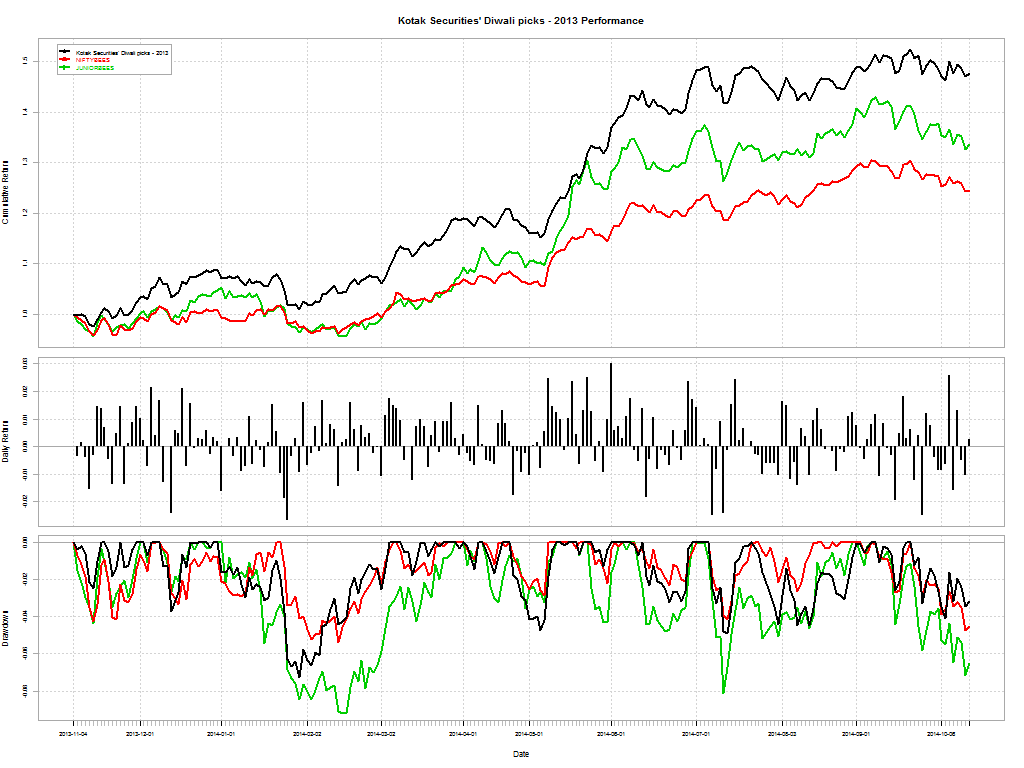
It is that time of the year again when brokerage houses try and pick stocks for “muhurat trading.” Let’s see how they fared with their 2013 picks. NIFTY is up +27% since last Diwali.
Kotak picked 11 stocks that returned about +50%. Sharpe: 0.16732
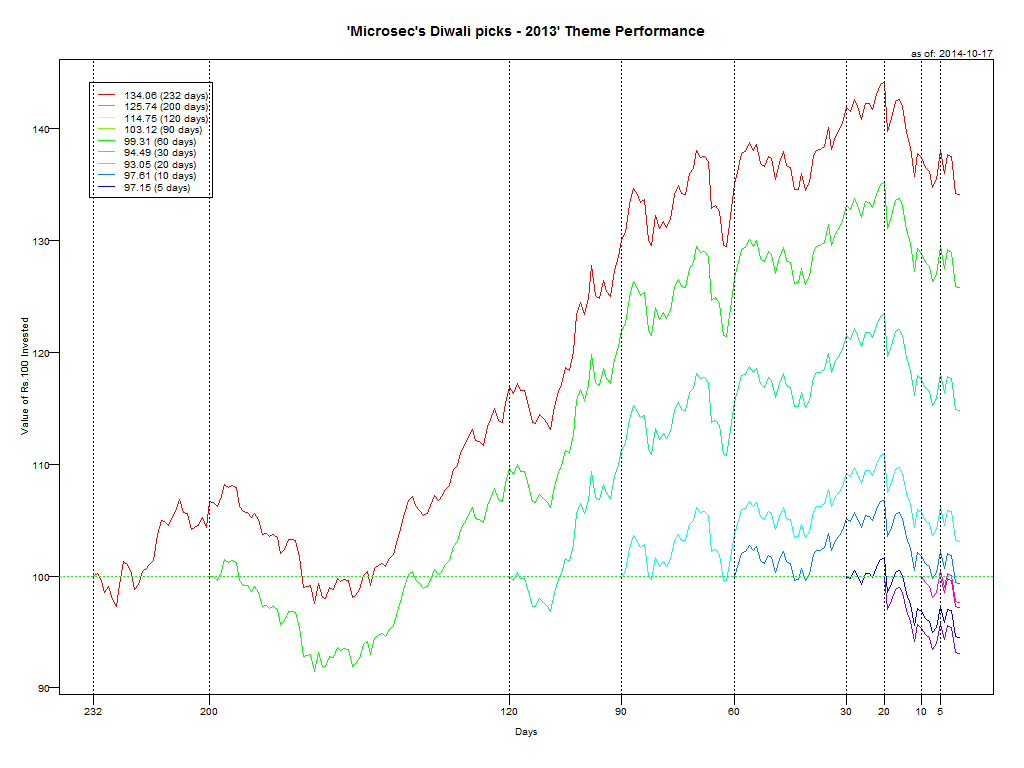
Microsec picked 9 stocks that returned about +37%. Sharpe: 0.12822; but their portfolio has been pummeled lately.
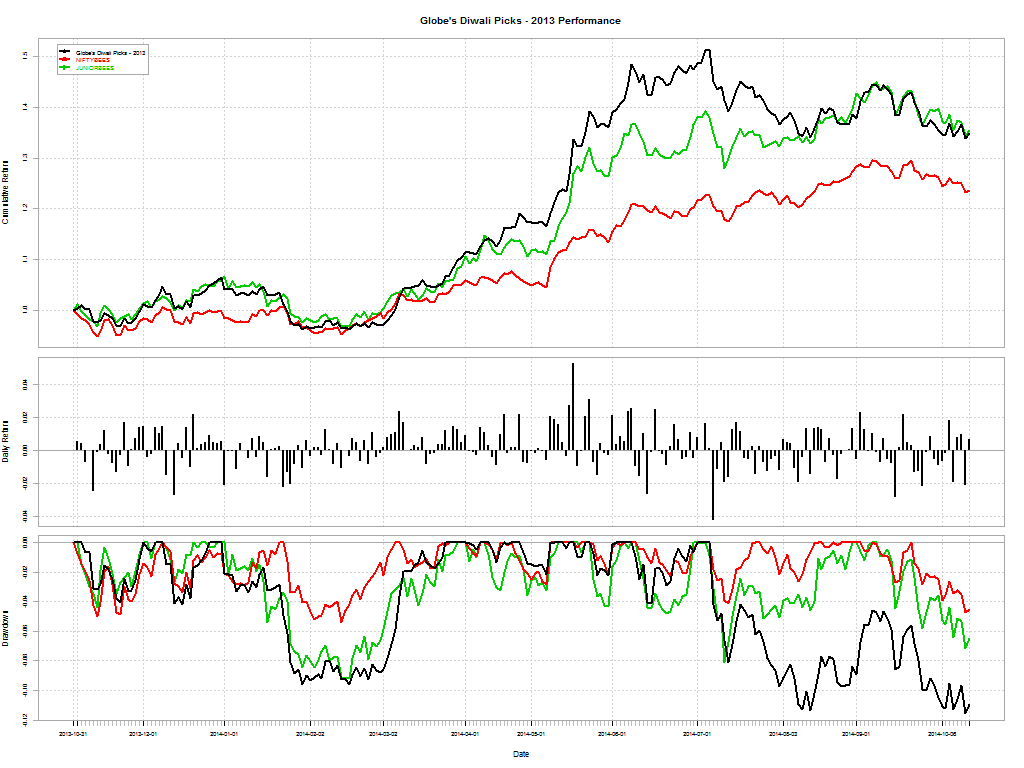
Globe’s 10 stocks returned about +37% but with a much lower Sharpe (0.11445) compared to Kotak and Microsec. It hit its peak sometime in July and its been sliding since then.
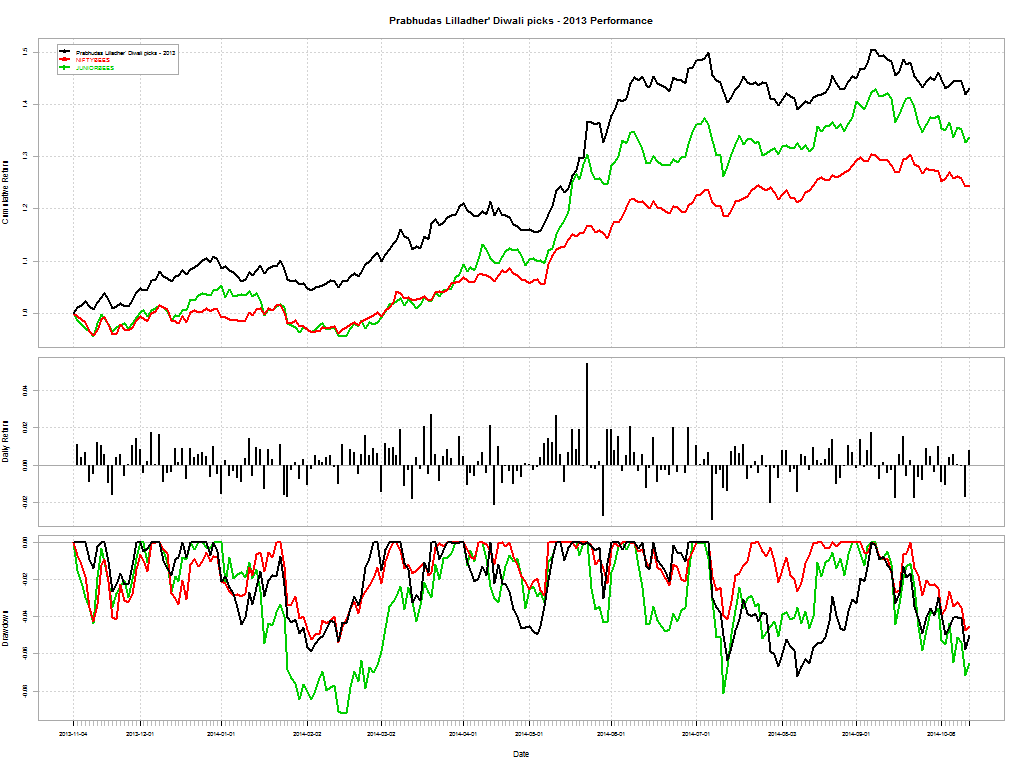
Prabhudas Lilladher picked 4 stocks. Got to admire their courage here. +45% since Diwali, Sharpe: 0.15509.
We have created new themes to track brokers’ 2014 Diwali picks. Kotak, Globe and ET have published their recommendations so far.
You can find all Broker Recommendations here.
ICICI came out with an interesting note on why they expects Indian bonds to rally. They outline 5 factors:
Related: Long-term Gilt Funds, where we layout the same thesis.
You can run our comparison tool here: FundCompare