There is always friction
One of our readers made a very astute observation yesterday:
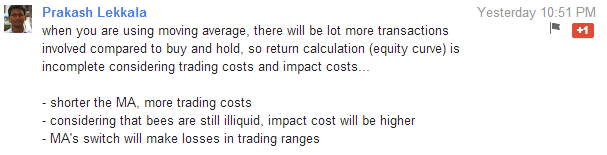
It is true that every strategy has friction. Friction in terms of trading costs, tracking error, whiplash, etc. So we put the 50-Day SMA CNX 100 that we discussed yesterday through the wringer to see what happens in the real world.
Modeling friction
We charge a pretty low brokerage of 0.2%. A two way buy and sell would cost 0.4%. Impact cost is probably 0.2%. For a total of 0.6% in friction. Lets round it up to 1% to give us a margin of comfort.
Whenever a trade happens, we will deduct 1% from the notional amount to account for this friction. From the start of 2010 to now, there were 1146 trading days, out of which, the strategy would have resulted in trades for 56 of them. Now lets compare the Raw 50-day CNX 100 with the Buy-and-Hold (B&H) and Friction scenarios.
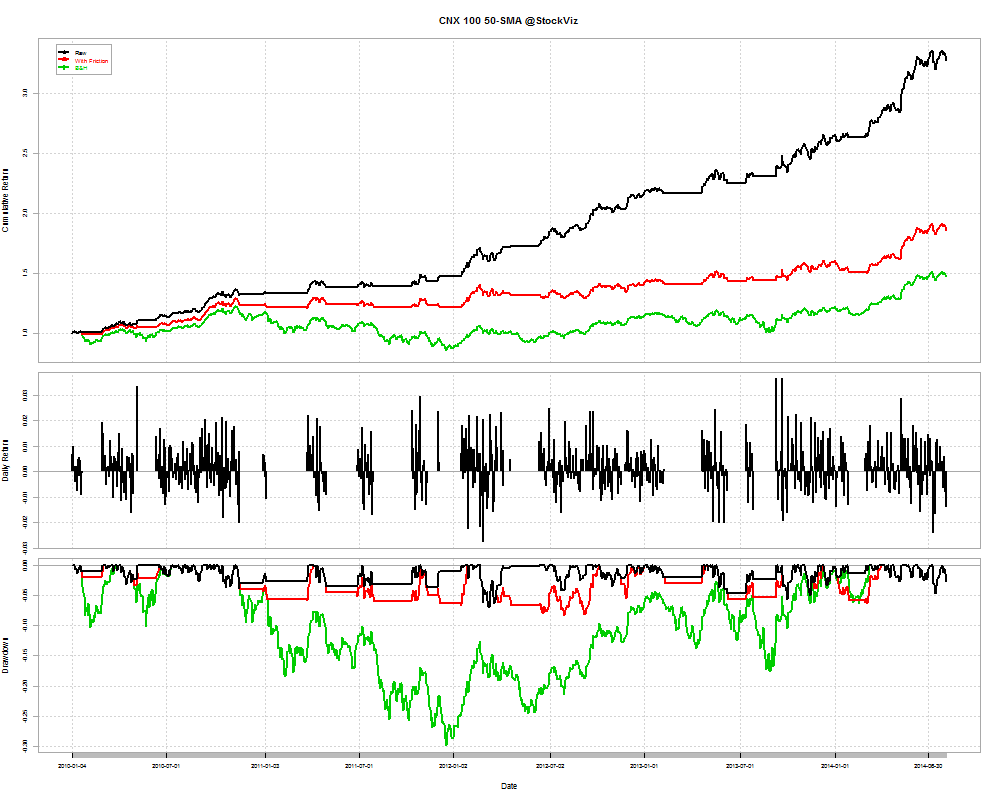
The investor still comes out as a winner with a cumulative return of 0.86 vs. 0.47 in buy-and-hold.
Accounting for tracking error
The above analysis used the CNX 100 index to model friction. However, in the real world, you cannot own fractional shares. This gives rise to tracking error. What would the numbers look like if we used the ETFs themselves?
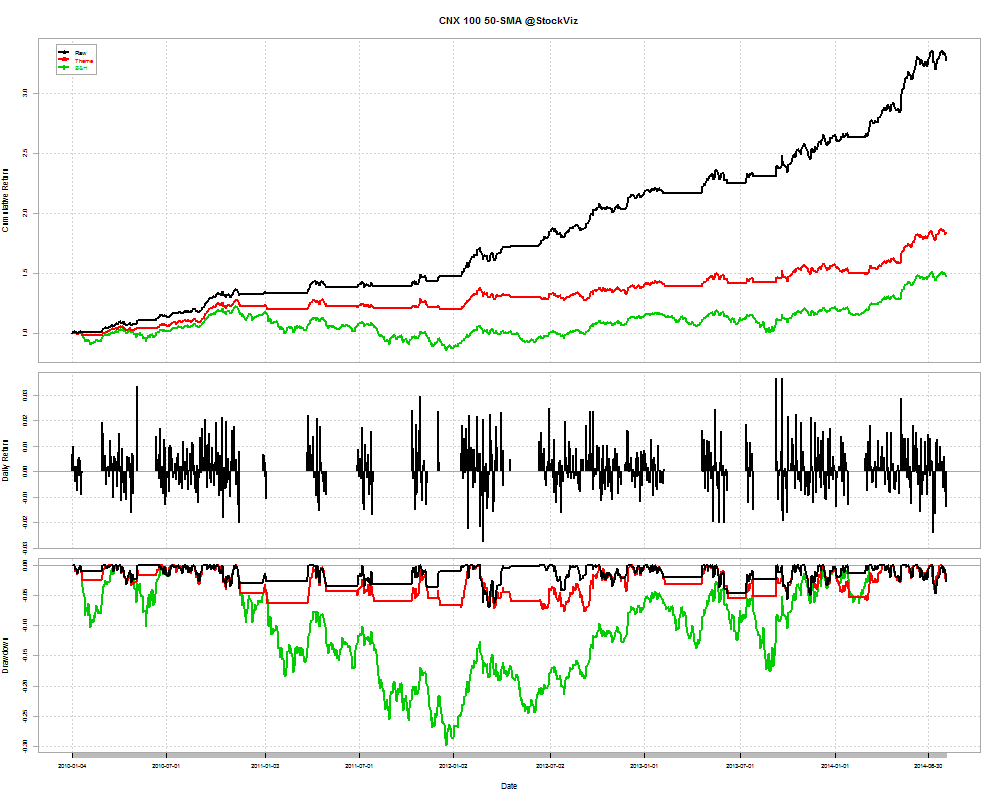
The investor still comes out as a winner with a cumulative return of 0.84.
Conclusion
Even after considering trading costs, impact costs and tracking error, this strategy comes out way ahead of a naive buy-and-hold strategy.
You can follow the Theme here.