Large-cap stocks
Large-cap stocks are less volatile, ceterus paribus, compared to mid-cap and small-cap stocks. For most first-time investors, the set of Top 100 Funds offers a straight-forward way of adding equity exposure.
| Fund/Scheme | IRR (2014) | Expense |
|---|---|---|
| Birla Sun Life Top 100 Fund -Growth Option | 48.27% | 2.82% |
| ICICI Prudential Top 100 Fund – Regular Plan – Growth | 37.71% | 2.77% |
| IDBI India Top 100 Equity Fund Growth | 40.05% | 2.87% |
| UTI – TOP 100 Fund- Growth Option | 40.68% | 2.43% |
Picking the right scheme
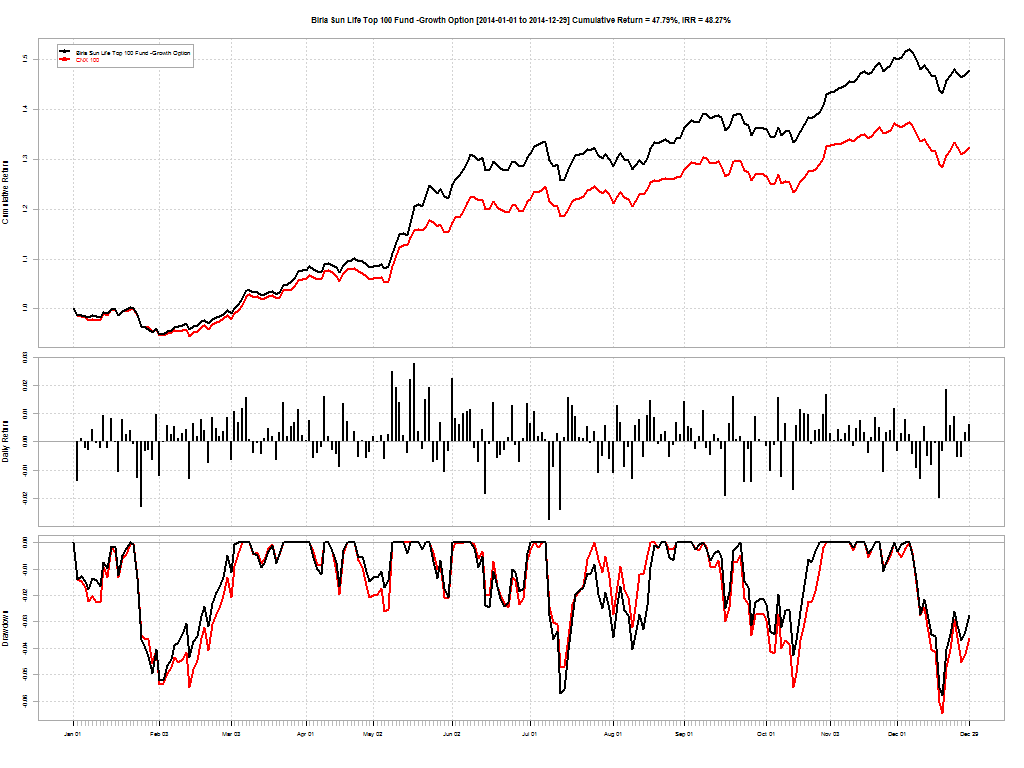
As an investor, you should care about two things: risk-adjusted returns and expenses. While the Birla fund gave better returns, it charged a higher fee compared to UTI. But are those higher returns sustainable? Investors should be willing to pay more for more. This is where the FundCompare tool can help.
Birla vs. UTI

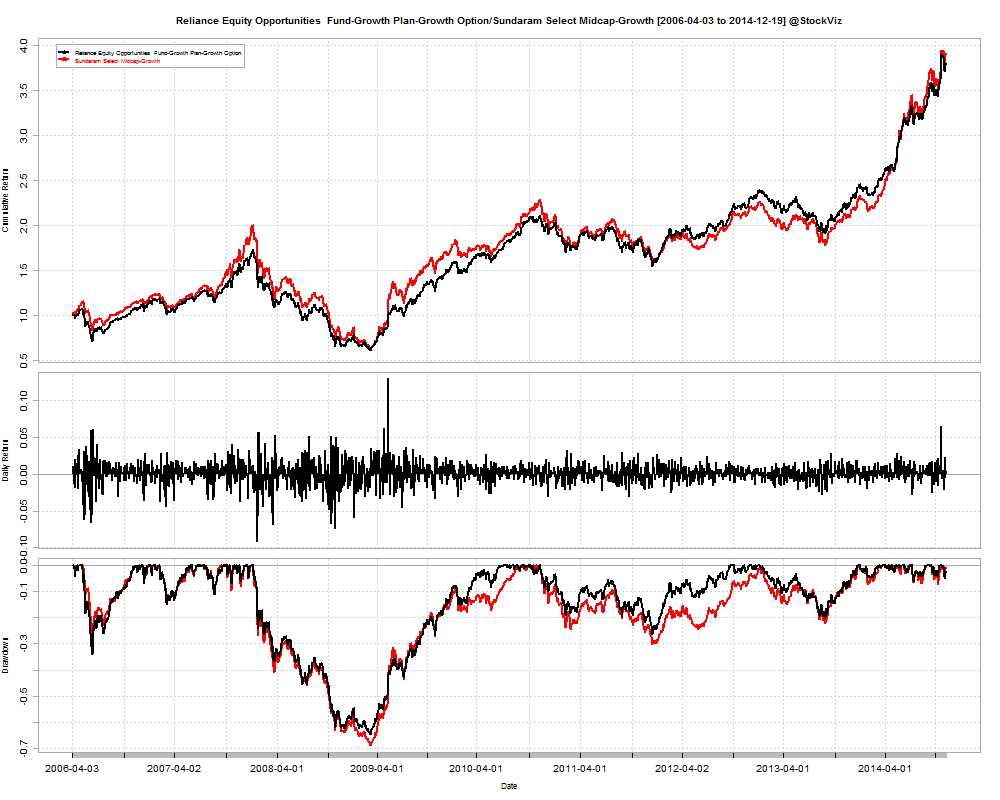
Between 2009-07-01 and 2014-12-29, Birla Sun Life Top 100 Fund (Growth Option) has returned a cumulative 155.00% with an IRR of 18.56% vs. UTI TOP 100 Fund (Growth Option)’s cumulative return of 108.35% and an IRR of 14.28%.
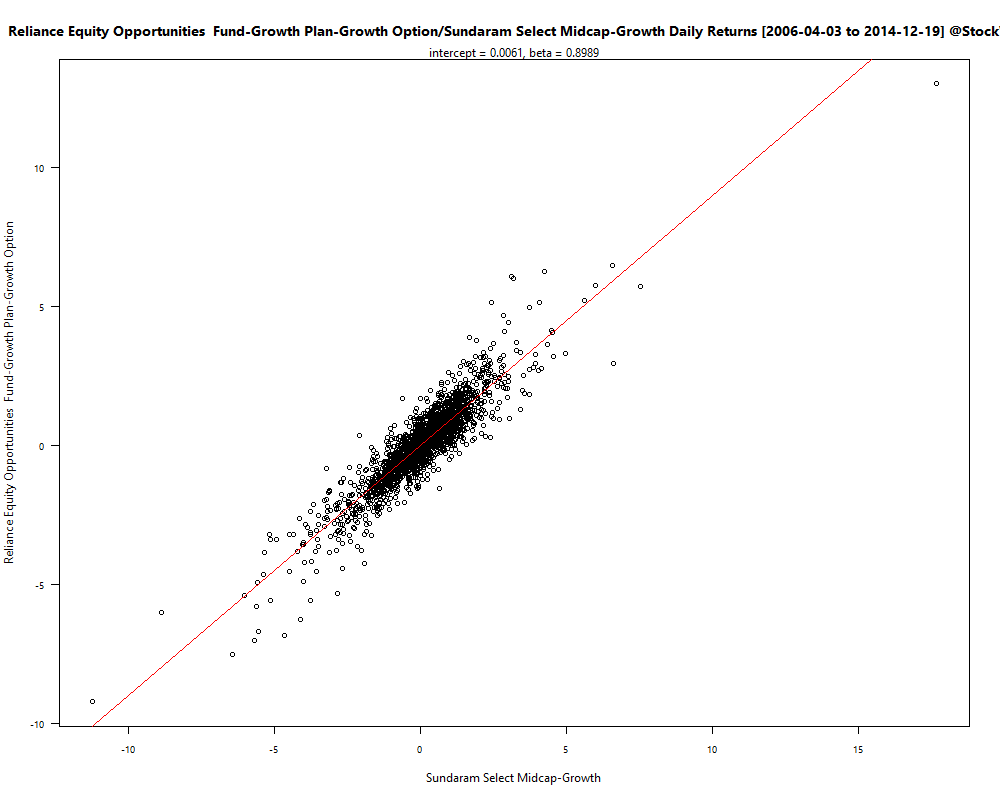
On the face of it, Birla’s higher fees seems worth it. But it looks like higher returns came at the expense of higher risk. Birla’s beta (vs. CNX 100) is 0.90761 vs. UTI’s 0.83478 and the latter had deeper drawdowns as well. However, the Sortino Ratio tilts the scale towards Birla’s fund: 0.10762 vs. UTI’s 0.09043.
Conclusion
If you are looking for large-cap exposure then go for Birla Sun Life Top 100 Fund.