Turning Momentum’s primary weakness into strength
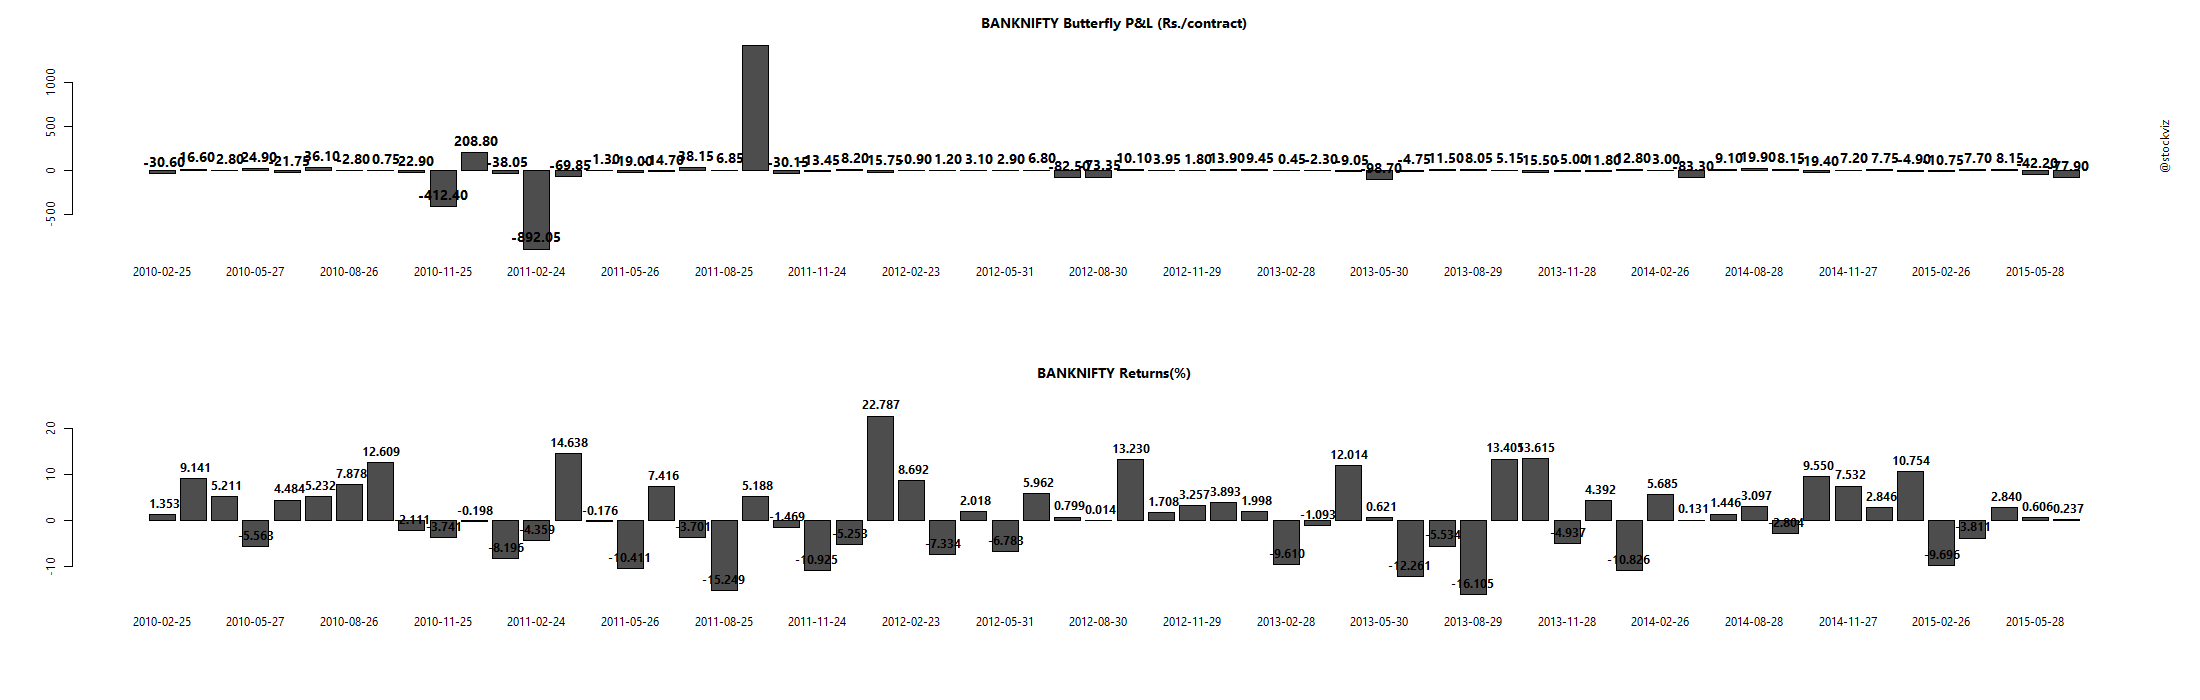
The biggest problem with any trend-following strategy is sudden reversals in trend. This fits nicely into the biggest problem with selling butterflies – that the underlying stays where it is. One thing that momentum stocks guarantee is that they will move big.
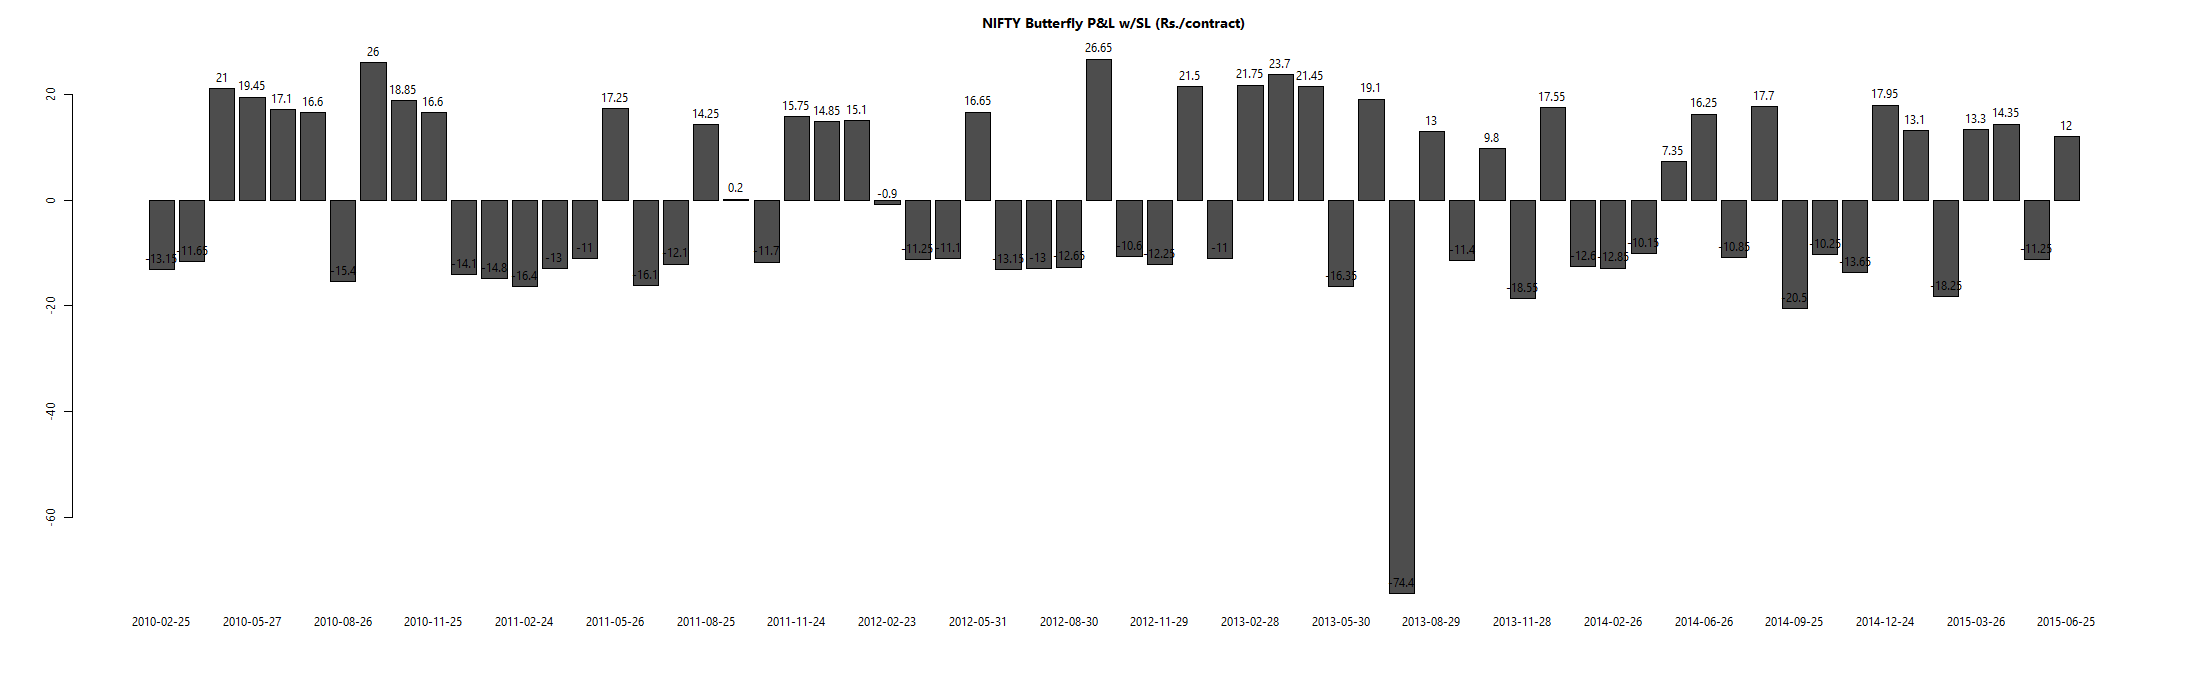
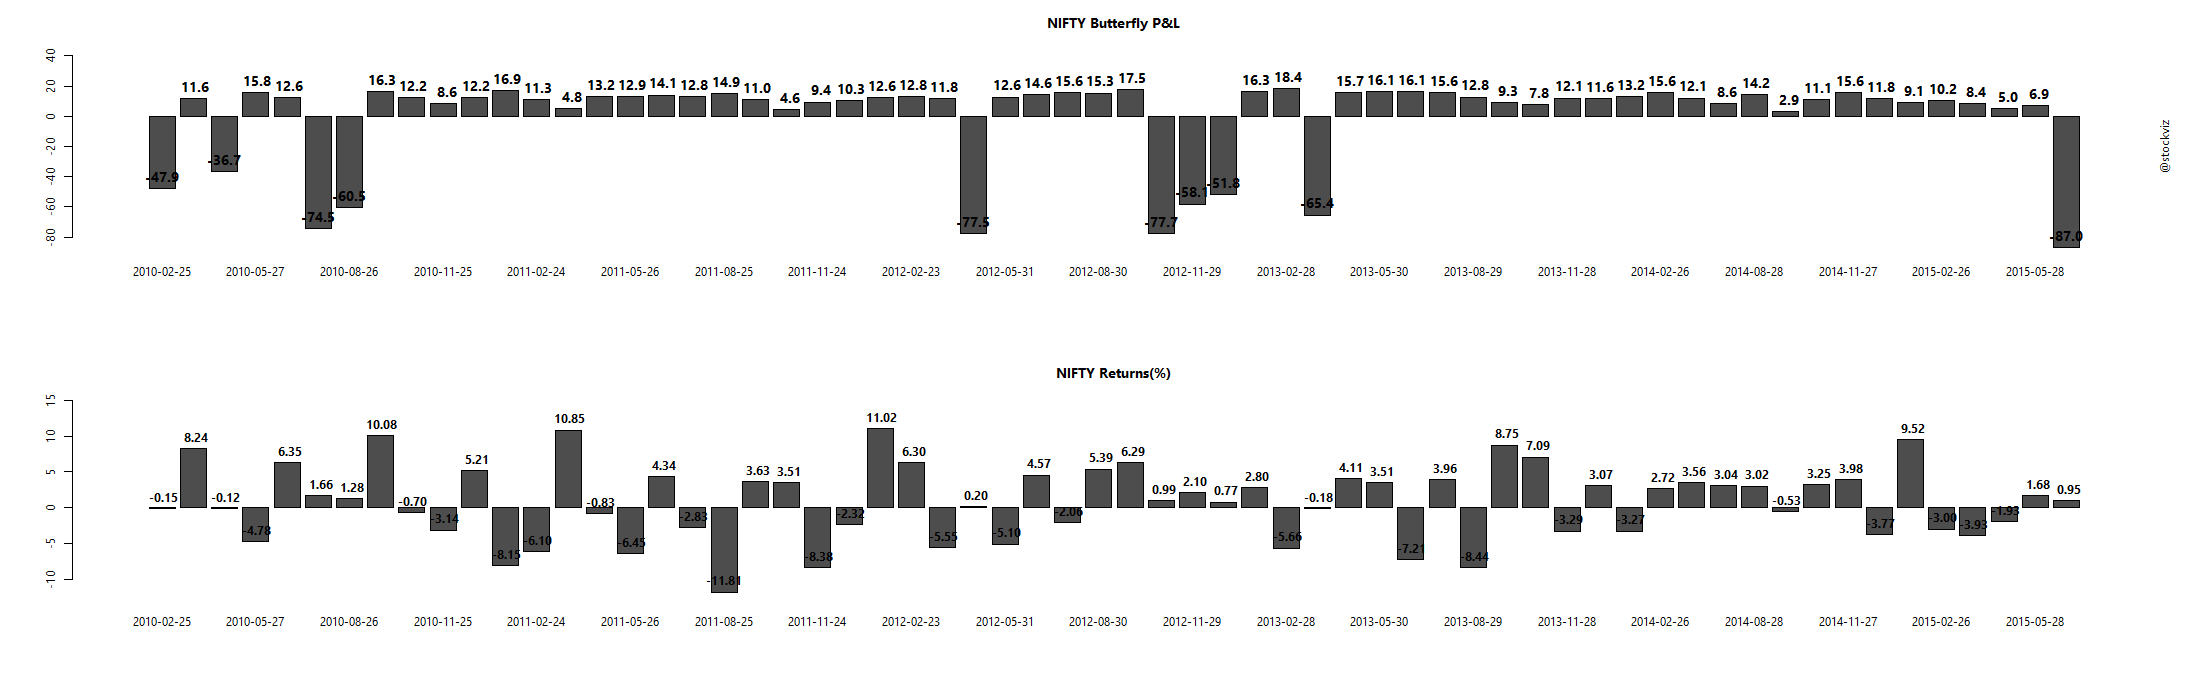
Our earlier attempts at developing a mechanical short-call butterfly strategy for the NIFTY failed because there would be months when the NIFTY would just end flat for expire very close to where it started after bouncing all over the place. Let’s see if using single-stock options overcomes this problem.
A quick back-test
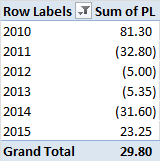
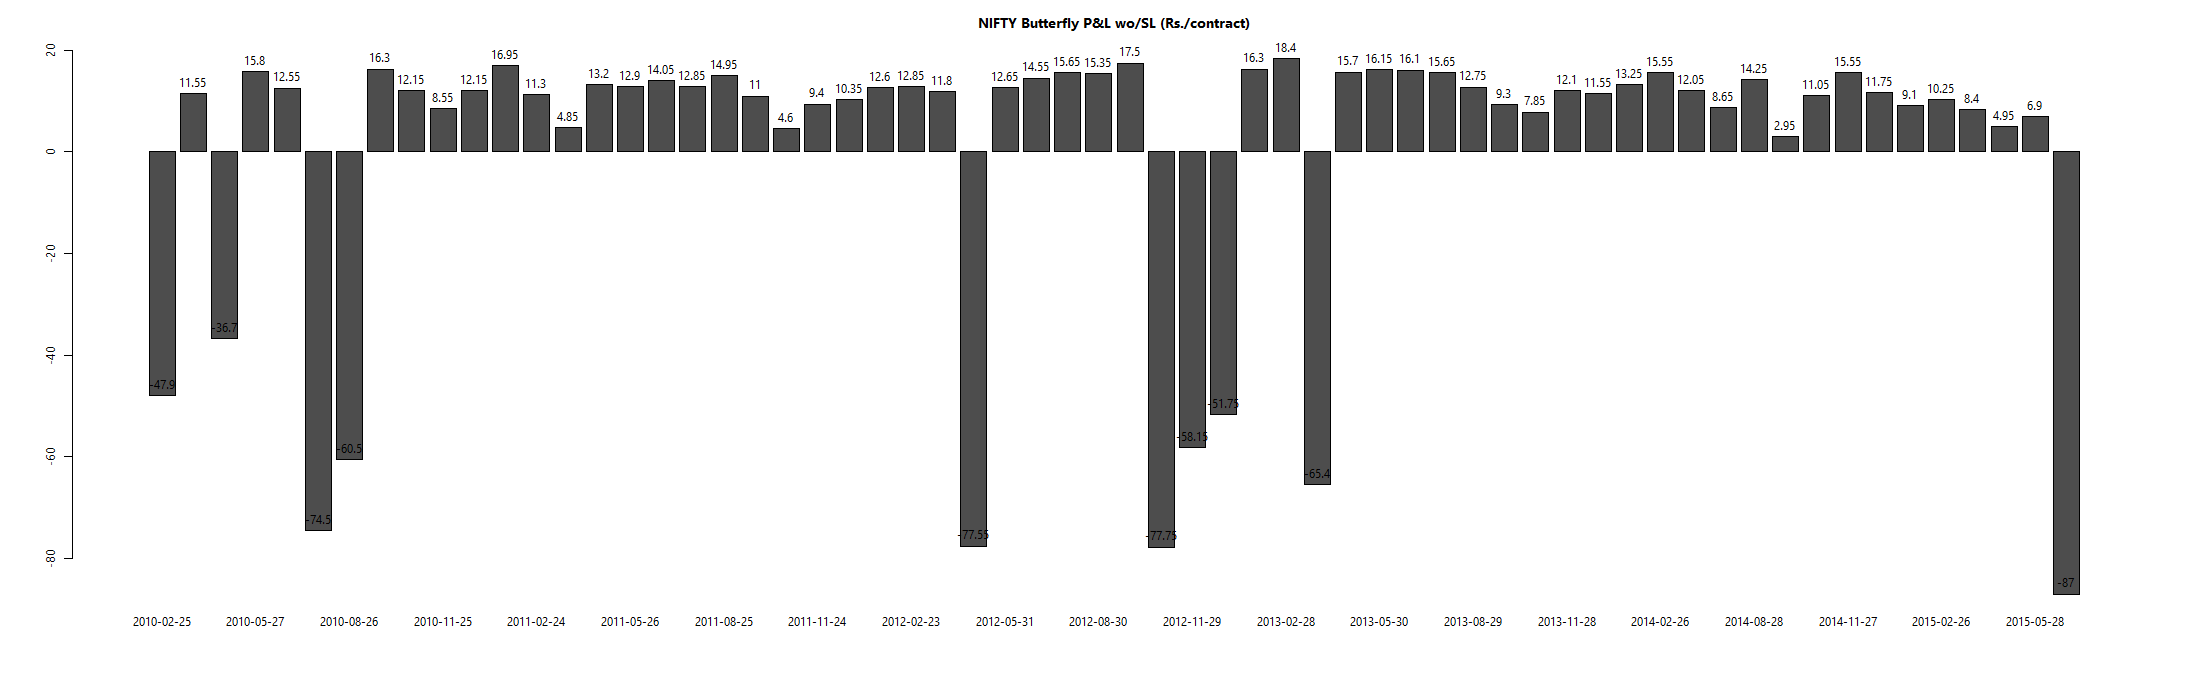
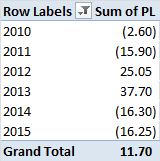
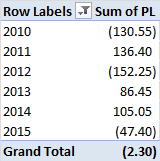
In order to hedge our bets, we consider only the top 3 and the bottom 3 stocks in our momentum universe. And then we apply a liquidity filter to ensure that we can actually carry out the trades. Trades are entered 10 days after expiry and held till expiry. No stop-loss is applied.
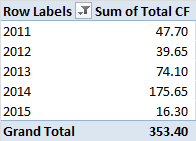
Conclusion
Using momentum to drive a short-call butterfly strategy holds promise. We have created a Theme for it – Shattered – to help traders access this strategy.