The dog years of 2010, 2011, 2012 and 2013
According to AMFI, these are the 5 largest funds at the end of March-2015:
| Scheme Name |
AUM (Cr.) |
| HDFC Equity Fund – Growth Option |
1,280,287
|
| HDFC Top 200 Fund – Growth Option |
1,009,121
|
| Reliance Equity Opportunities Fund-Growth Plan-Growth Option |
764,383
|
| HDFC MID-CAP OPPORTUNITIES FUND – Growth Option |
715,865
|
| ICICI Prudential Value Discovery Fund – Regular Plan – Growth |
645,946
|
What this means is that there is at least one person in your immediate network who would have invested in one of these funds.
Now let’s take a walk down memory lane. 2010, 2011, 2012 and 2013 were the worst years for the Indian economy. The RBI had messed up monetary policy leading to high inflation (double digits), there was a currency panic (rupee went from 45 to a dollar to 65), a never-ending series of scams and a government hell bent on redistribution. The only two asset classes that were doing well at the time were gold and real estate. GOLDBEES, the gold ETF, returned 13.25% (IRR) during that period. Fixed deposits were yielding around 11%. How would a typical investor react if his actively managed equity investments gave the following returns?
| Scheme Name |
IRR |
| HDFC Equity Fund – Growth Option |
7.00%
|
| HDFC Top 200 Fund – Growth Option |
6.74%
|
| Reliance Equity Opportunities Fund-Growth Plan-Growth Option |
12.00%
|
| HDFC MID-CAP OPPORTUNITIES FUND – Growth Option |
13.24%
|
| ICICI Prudential Value Discovery Fund – Regular Plan – Growth |
11.09%
|
Here is Gold (in red) vs. HDFC Equity Fund (in black):

Needless to say, most investors who dipped their toes into the equity markets in 2010 gave up after a couple of years and still believe that the whole mutual fund business is a scam.
First half of 2015
We are supposed to be in a bull market. But let’s see how the first half worked out for the HDFC Equity Fund:

IRR of -2.39%. And bonds lost money too (in June.) Bull markets are not immune to prolonged periods of a “sideways” market.
Diversification across assets
A standard response to most investing problems in diversification. Invest a little into a variety of asset classes – equities, commodities, real-estate, gold, bonds – and you will be fine.
The problem with diversification is that it always feels wrong. For example, there are “balanced” funds that are supposed to allocate between both bonds and equities. They end up having lower draw-downs because of this. If you compare the ICICI Prudential Balanced Fund with HDFC Equity Fund between 2010-2013, the latter has an IRR of 11.38% vs. 7.00% of the former. But during the bull market of 2014, the balanced-fund gave an IRR of 45.47% vs. the equity fund’s 53.83%. So the lower draw-down comes at the expense of performance. It is a huge cognitive burden for investors to live with.
The kind of assets you pick for diversifying into also matters. For example, there was this big thing back in the day about the “commodity super-cycle.” About how the insatiable appetite for all sorts of commodities from China would keep growing to infinity. Plus, commodities were supposed to uncorrelated with equities. So great for diversification, right? Here’s how Mirae Global Commodity Equity Fund compares to the HDFC Equity Fund:

Commodity stocks did turn out to be uncorrelated but not in a way that you would like. And the commodities themselves are bouncing along multi-year lows right now.
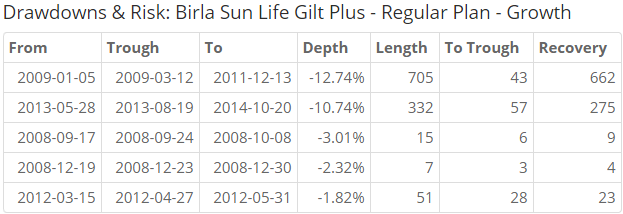
What about bonds? Surely, they are safe. But let’s not forget that in 2009 and 2013, gilts drew-down double digits and their long-term IRRs are between 7% and 10%.
Diversifying across geographies
What if you invested in international funds? After all, the rupee keeps going down, right? Depends on where you look. Between 2010 and 2013 (the dog years) the Birla Sun Life International Equity Fund – Plan A gave an IRR of 16.09% vs. HDFC Equity Fund’s 7%. But before you pat yourself on the back, between 2014 and now, the latter gave an IRR of 3.06% vs. 32.54% of the former. And Religare’s Pan European Equity Fund gave 1.50%.
Diversification means that your overall portfolio will trail behind the best performing asset class du jour. Psychologically, it is a very difficult thing to stick to.
Investing fads and broker recommendations
Of all the poor choices that investors can make, the worst is giving into investing fads. Back in 2004, there was this whole “India shining” marketing slogan. And now there is “make in India”, “smart cities”, “digital India”, etc. And almost every single time, fund houses come out with new schemes that tag along the slogan du jour. Here are some examples:
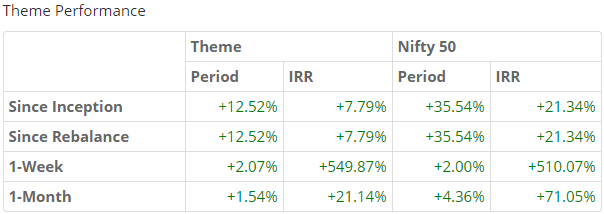
Morgan Stanley came out with their stock picks if Modi won (Theme created Dec 6, 2013):
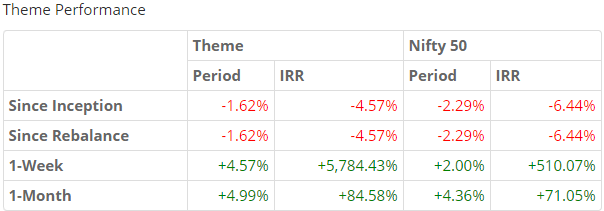
Here’s one on the Rail Budget (Theme, created Feb 26, 2015)
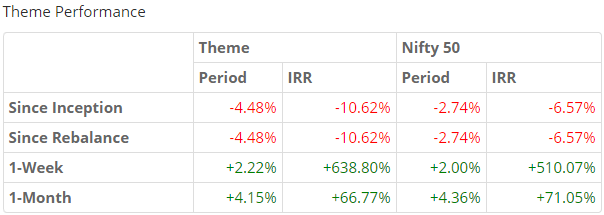
So much for betting on rate-sensitive stocks (Theme, created Feb 3, 2015):
You can browse through all these recommendations and lists under the “Broker Recommendations” section of our Themes page. We call it Doodh Ka Doodh Pani ka Pani.
Optimization vs. Maximization
The above examples highlight the problems of trying to maximize returns. There will always be an asset class, mutual fund or stock that is doing better than what you own. And there is an entire industry of tip-sheets, newsletter writers and subscription services that promise to pick the next winner.
However, we see investing as an optimization problem. We believe that drawdowns are an inseparable part of investing. Instead, we focus on getting the right mix of assets and strategies based on your risk appetite. And we make it supremely easy to stick to a plan.
For direct equity investors, this means getting Value and Momentum right. We have created Themes based on different approaches to value and momentum investing. Investors can then map our Themes to gain exposure to a specific set of strategies.
For mutual fund investors, this means getting portfolio risk right. We have created Themes based on the risk of the overall portfolio. Investors can now tune out the noise and focus on achieving their life goals.
Investing is not easy, but your journey as an investor will be so much more smoother with us. Get in touch with us now!