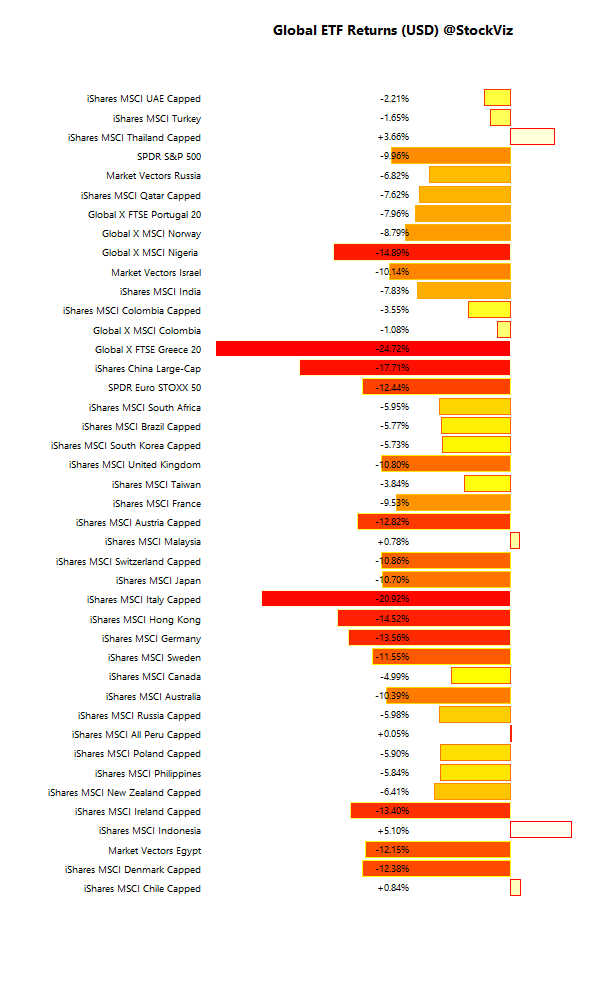
Global markets have sold off in tandem so far this year. The question on everyone’s mind is if markets are correlated during sell-offs, then is it possible to construct a “world markets indicator” that will allow traders to short the NIFTY?
Constructing an SMA index
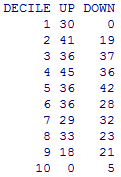
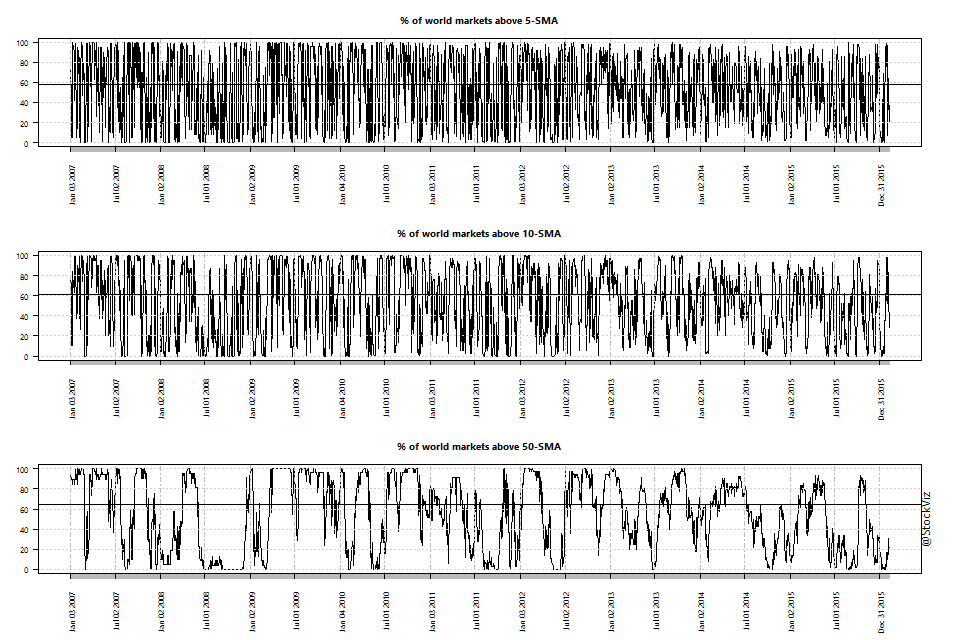
There are about 40 world index ETFs listed in the NYSE that provide a dollar based proxy to world equity markets. Using historical data, one can construct an index that tracks the fraction of these markets that are trading above their simple moving averages (SMAs.) If the index dips below a certain level, it could mean that a macro sell-off is in progress and one could proceed to short the Nifty. We constructed a 5- 10- and 50-day index of global market ETFs:
Using the SMA index to trade
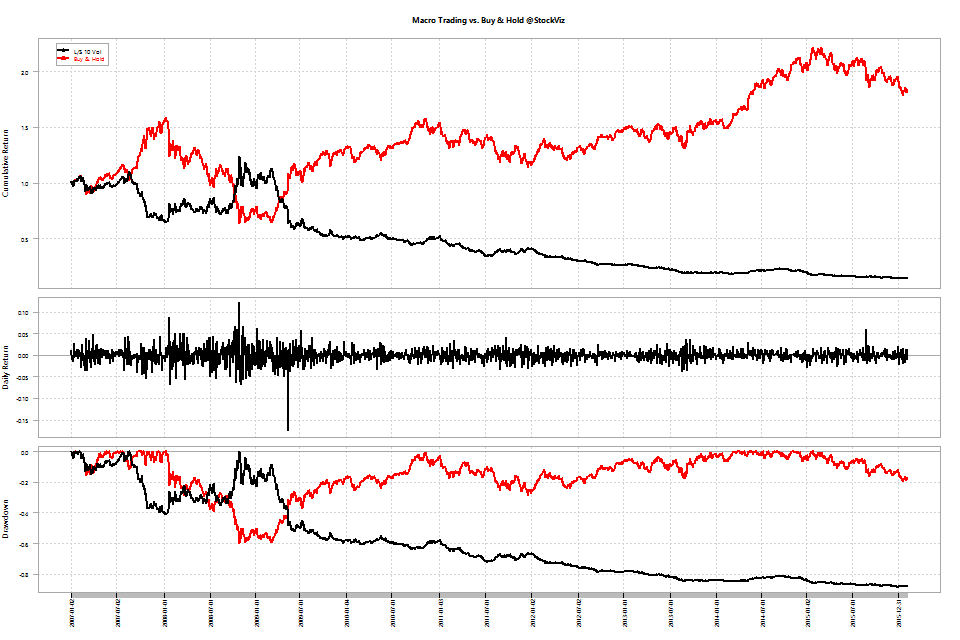
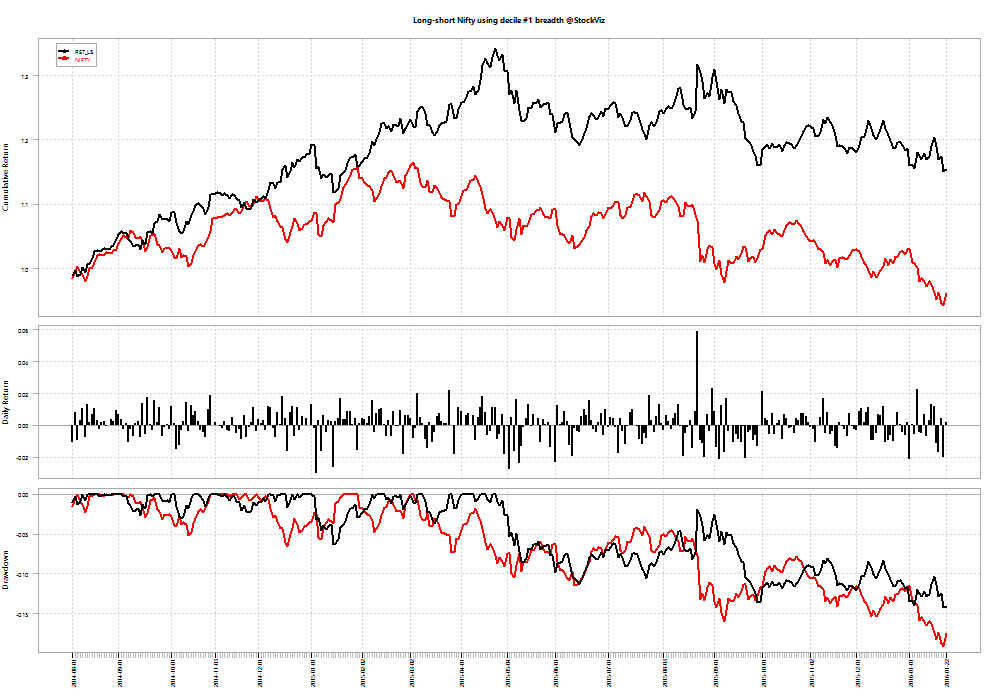
So what if we used the SMA indices to go long and short the NIFTY? What we did below was to go short the NIFTY if the fraction of world markets trading below their SMAs were below their historical medians and long otherwise.
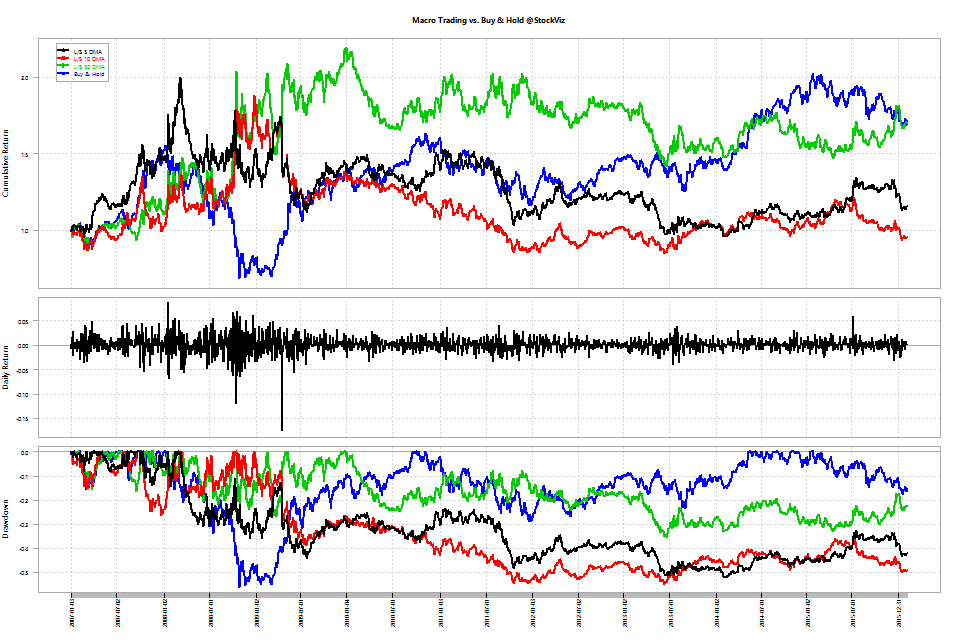
Between 2007 and now, the 5- and 10-day SMAs (black, red) under-perform a buy-and-hold (blue) strategy. However, the 50-day strategy (green) helped short the 2008 crisis and the current sell-off.
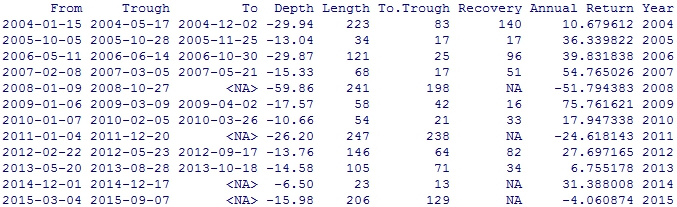
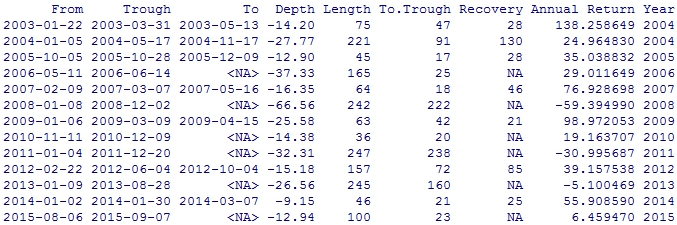
But let us zoom into the period between 2011 and 2014:
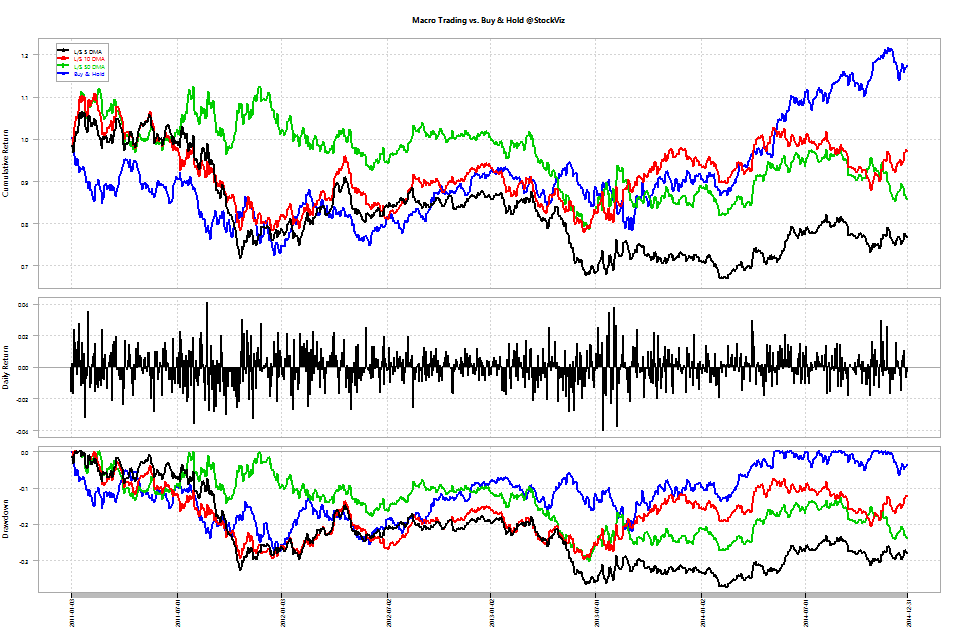
This is where macro under-performs buy & hold (negative returns vs. positive.)
Year-wise returns of the different strategies:
| Year |
5-day SMA |
10-day SMA |
50-day SMA |
Buy and Hold |
|
2007
|
50.58%
|
7.01%
|
12.03%
|
54.77%
|
|
2008
|
-2.51%
|
65.04%
|
69.88%
|
-51.79%
|
|
2009
|
-20.12%
|
-37.06%
|
18.47%
|
75.76%
|
|
2010
|
-4.11%
|
-23.86%
|
-19.11%
|
17.95%
|
|
2011
|
-24.00%
|
-16.30%
|
7.68%
|
-24.62%
|
|
2012
|
14.09%
|
16.66%
|
1.22%
|
27.70%
|
|
2013
|
-19.15%
|
6.02%
|
-8.94%
|
6.76%
|
|
2014
|
1.07%
|
-1.97%
|
-1.17%
|
31.39%
|
|
2015
|
13.56%
|
-4.39%
|
25.32%
|
-4.06%
|
|
2016
|
-4.77%
|
-4.60%
|
-6.13%
|
-7.04%
|
Conclusion
- Given the volatile nature of the SMA World Indices, expect to take a fairly large hit on trading costs.
- The 50-SMA based strategy under-performed buy and hold in 6 out of 9 years.
- The 50-SMA based strategy under-performed buy and hold in 3 consecutive years – 2012, 2013 and 2014 – making it a hard strategy to be faithful to.
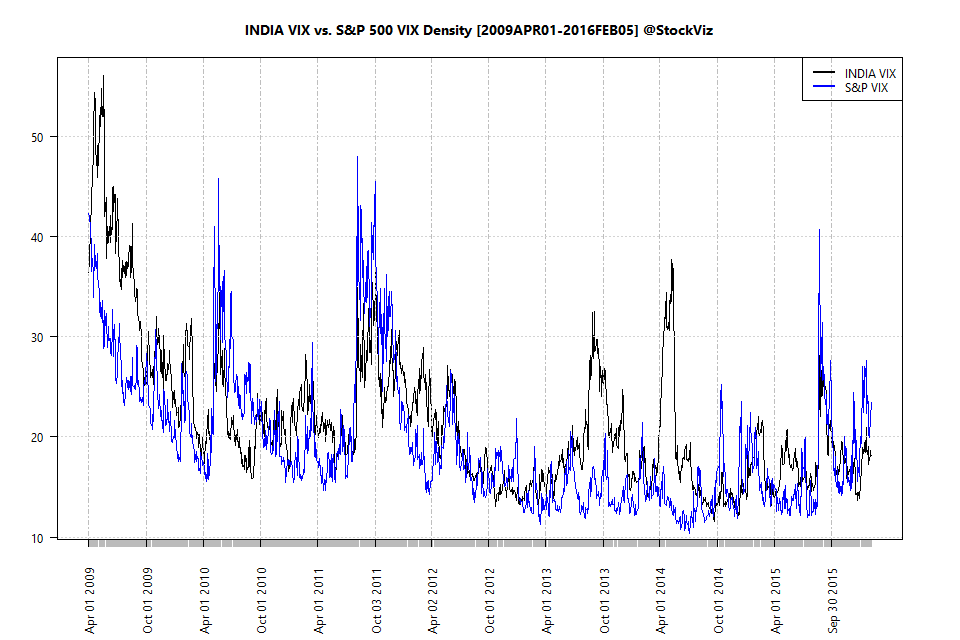
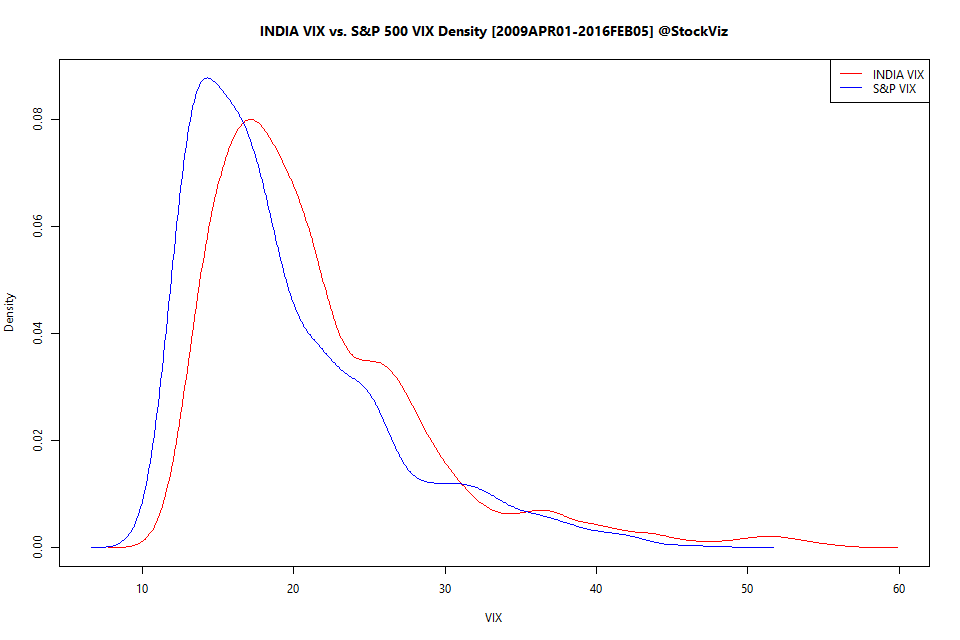
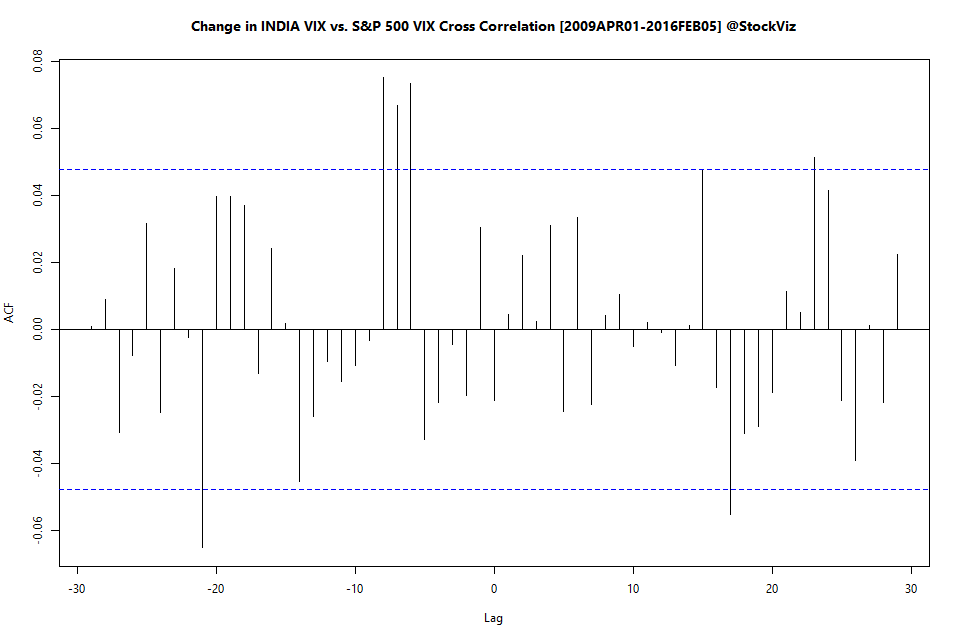
Related: India VIX vs. SPX VIX