The Turn of the Month Effect
A recent paper in the Financial Analysts Journal looks at the Turn of the Month effect on equities. Equity Returns at the Turn of the Month, John J. McConnell and Wei Xu:
The turn-of-the-month effect in U.S. equities is found to be so powerful in the 1926–2005 period that, on average, investors received no reward for bearing market risk except at turns of the month. The effect is not confined to small-capitalization or low-price stocks, to calendar year-ends or quarter ends, or to the United States: This study finds that it occurs in 31 of the 35 countries examined. Furthermore, it is not caused by month-end buying pressure as measured by trading volume or net flows to equity funds. This persistent peculiarity in returns remains a puzzle in search of an answer.
Does it apply to Indian markets?
The study skips over the Indian markets. So we did a quick test on the CNX 100 index to check if the effect holds. Here’s the cumulative return chart between a Buy-and-Hold CNX 100 strategy (B&H, black) and a Turn-of-the-Month CNX 100 strategy (TOM, red):
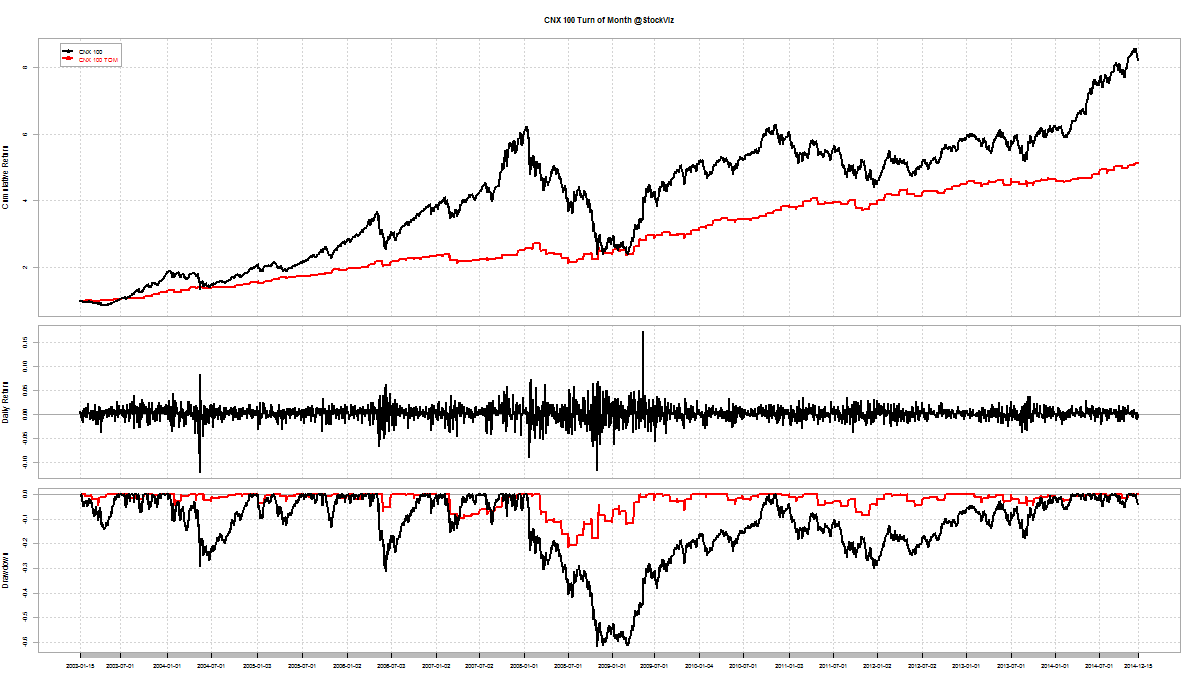
Although the TOM strategy has lower-drawdowns, the B&H wins – both in terms of tax advantage and trading costs. The Turn-of-the-Month effect doesn’t seem to apply to Indian equities.