Back in January last year, we had taken a brief look at Invesco’s India Mid N Small Cap Fund and ICICI Prudential Value Discovery Fund and concluded that even through Religare is marginally better than ICICI, there was nothing there to swing the decision one way or the other. Here’s an update:
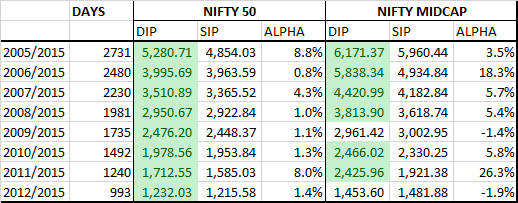
Between 2015-01-01 and 2016-08-11, Invesco India MID N SMALL CAP Fund has returned a cumulative 12.59% with an IRR of 7.64% vs. ICICI Prudential Value Discovery Fund’s cumulative return of 12.99% and an IRR of 7.88%. (http://svz.bz/2bf7jzy)
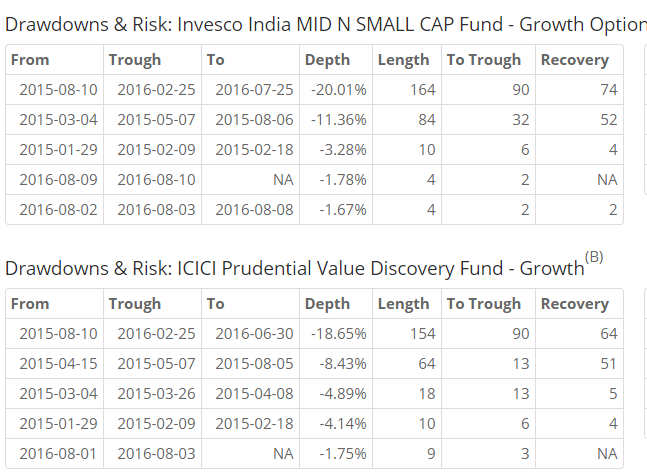
In terms of performance, they are still on top of each other. However, Value Discovery has had shallower draw-downs, making it an easier fund to hold.
Invesco’s fund is way smaller than ICICI’s. For those who prefer a smaller fund, Invesco’s would be a way to go. However, overall, the status quo remains.