More often than not, simple models outperform complicated ones. Inspired by some recent academic research that showed that linear regressions yielded better momentum performance, we did a quick backtest to check if building a linear model through recent 12 and 1/3/6-month performance and creating a portfolio using its next-month predictions made sense.
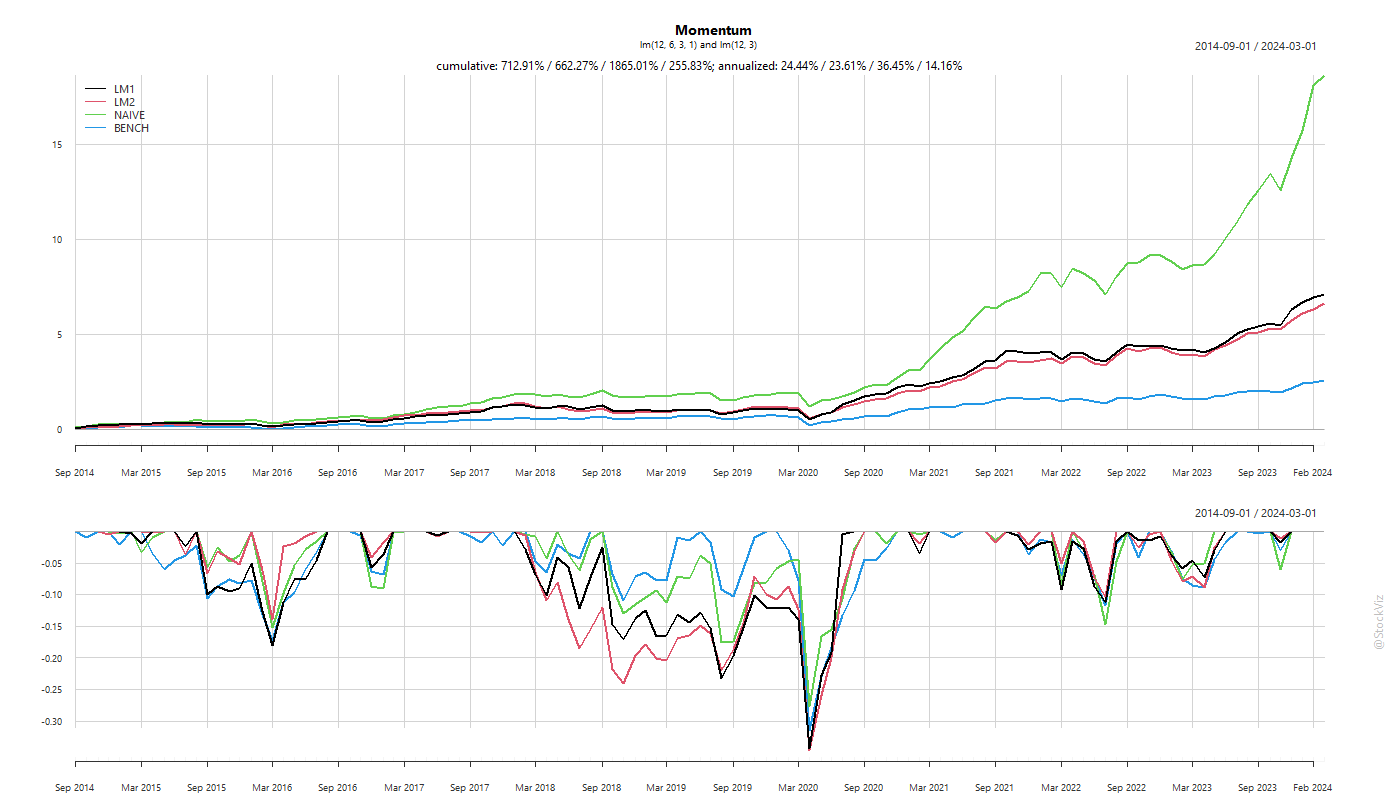
Counter-intuitively, a naïve momentum strategy outperformed linear models.
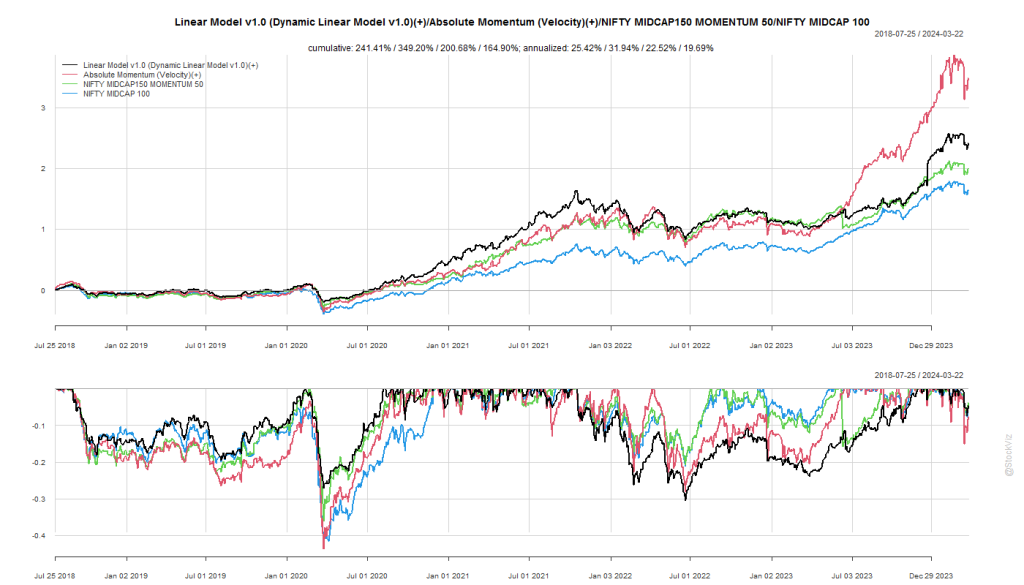
This is not our first run-in with linear regressions. Our Dynamic Linear Model strategy simply regresses prices to a 45* line and ranks them based on goodness of fit.
Most of the time, of all the different ways to skin the cat, the simplest is the best one.
Code on github.