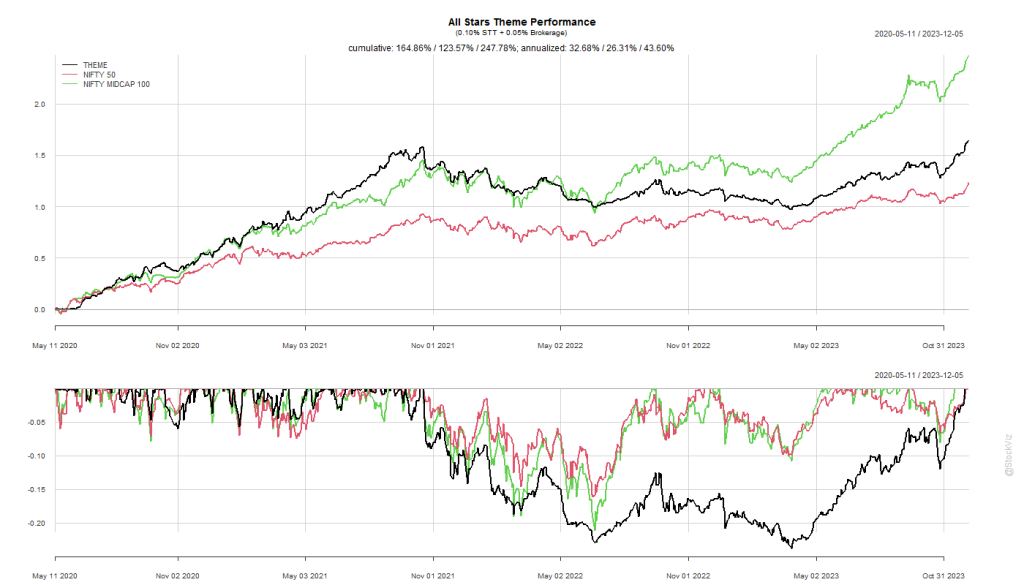
In an earlier post, we discussed how the risk-free rate influences the Sharpe Ratio. Another problem with using lifetime Sharpe to gauge investments is that if you are in the middle of a bull market, then everything looks good.
For example, our All Stars strategy recently hit a Sharpe of 2.0, which is sort of a holy grail in investing. However, if you had looked at it a few months ago, when it was still recovering from a drawdown, you would’ve stayed clear of it. So, what changed? The everything rally in stocks.
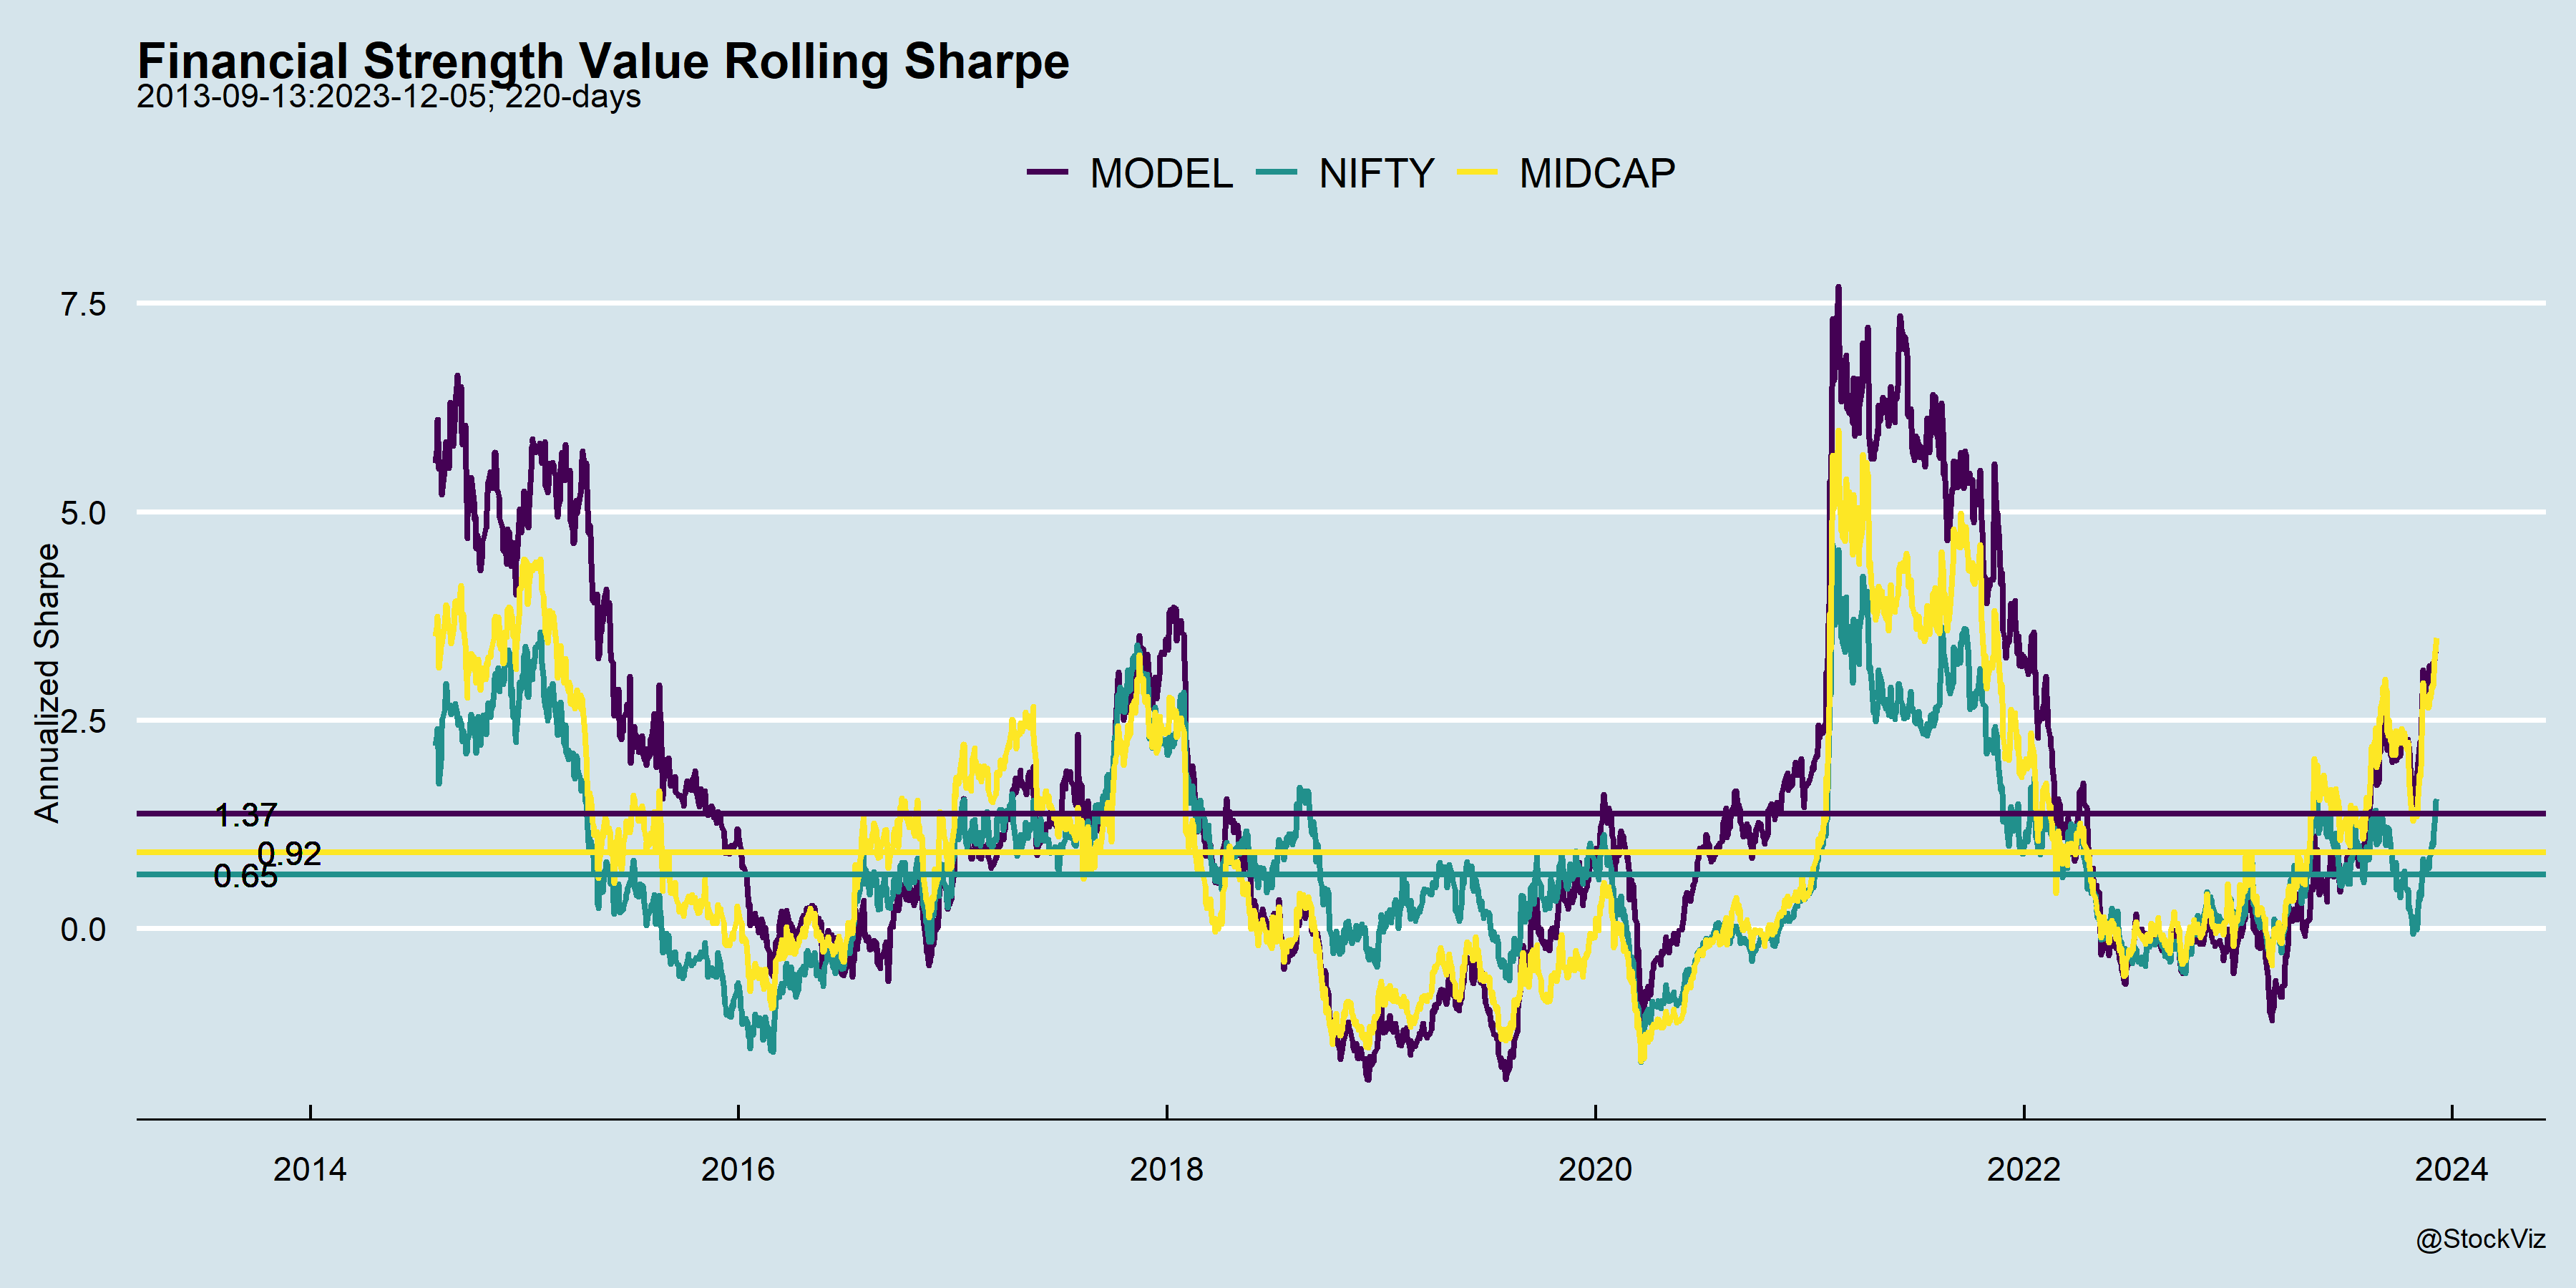
One way to avoid falling into this trap is to also look at the rolling Sharpe ratio over the life of the strategy.

While this is particularly true for momentum strategies that all look exceptional in bull markets, value strategies are not immune to this effect either.
Lifetime metrics are also sensitive to launch dates as well. Long running strategies would’ve seen their fair share of market ups and downs compared to newer ones launched during bear markets.

Rolling metrics will help investors get a better idea about strategy performance.