Previously, we explored using Meta’s Prophet library to predict VIX. It turned out that simply extrapolating the last value of the index worked better (Prophet for VIX). In fact, locf (last one carried forward) works better than GARCH(1, 1) and most other approaches. Can the same be said about Conditional Gaussian Mixture Models?
We used the cgmm python library to forecast 20-day forward VIX and compared its root-mean-squared errors (rmse) to those of locf‘s.
locf is pretty hard to beat.
Especially so when the VIX index itself is volatile.
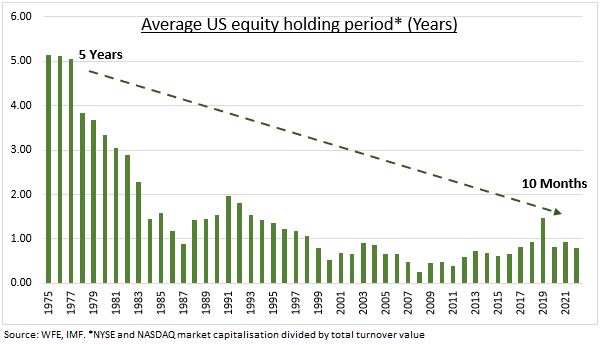
When you buy a stock, you buy a piece of business, not a quote from a broker. – Naved Abdali
There was a time when people actually believed that buying a stock meant that you were buying a piece of the underlying business. However, we have strayed far, far away from that. The average holding period of equities keeps dropping and everything has become trading sardines.
If we are all traders anyway, why not trade with leverage? Or so goes the clarion call of brokers offering the Margin Trading Facility.
Here’s how it works:
Initial Margin: You pay a portion of the total trade value from your own funds. Broker Funding: Your broker provides the remaining amount to complete the purchase. Collateral: The stocks you buy are pledged as collateral to the broker. Interest: The broker charges daily interest on the borrowed funds.
Margin Trading Facility (MTF) has become a more significant revenue stream than traditional brokerage fees. And the market has been expanding.
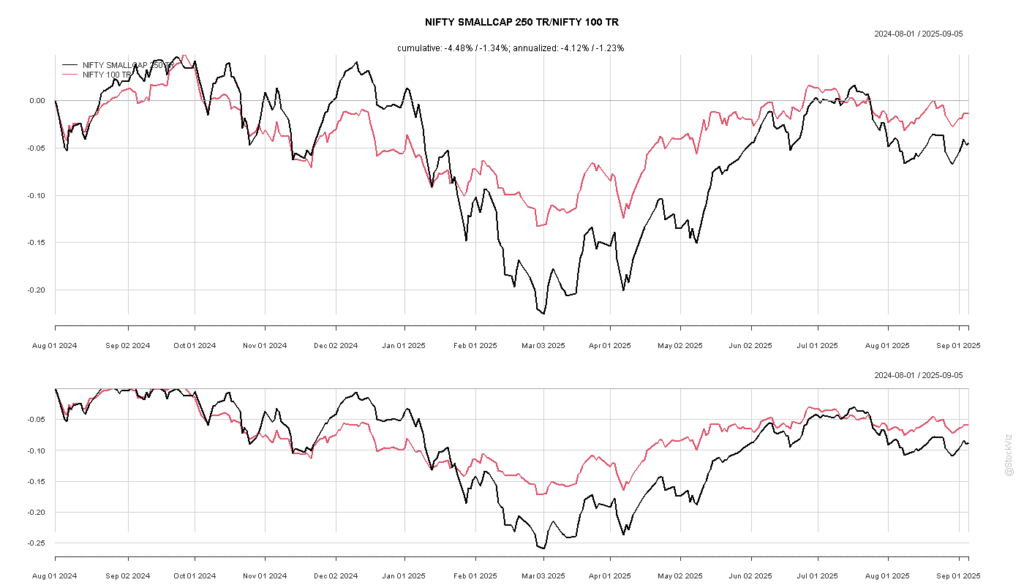
Judicious application of leverage, especially on low-volatility portfolios, does make sense. However, the ground reality is different. As a percentage of free-float capitalization, its mid/small-cap momentum stocks that are being financed on margin.
For example, back in August 2024, almost 75% of Motilal Oswal Nifty Smallcap 250 ETF’s free-float capitalization was financed by MTF. If a situation were to have arisen where most of the traders who had bought this on leverage couldn’t meet a margin call, the broker’s risk management team would’ve just dumped this in the market. Given the already abysmal liquidity situation of that ETF, it would have been enough to trigger a cascade of stop-losses, further dislocating the market.
As it turned out, the index would proceed to go down 25% by March 2025.
Currently, more than 15% of Nazara – a company who’s entire business model has been legislated out of existence – is financed under MTF. I hope traders know that MTF is a full recourse loan?
As much as leverage exposes you to risk, there’s another side to this equation. Keeping track of the most leveraged stocks can help you identify margin liquidations and profit from it. However, the pain of liquidations will be felt by many but the profit will go to the few.
You can keep track of all this in our Margin Report updated daily.
While the concept of volatility smirk is simple, the pattern itself is unstable. For example, different expiries have different shapes.
And these shapes change across days as well.
One way to keep track of these changes is by fitting a model through the implied volatilities. Here, we fit a parabola (y = ax2 + bx + c). a, the coefficient of strike_pct2, gives a measure of the narrowness/steepness of the smirk.
By sampling the curve and tracking these coefficients, you can begin to form an opinion on what is “normal” vs. a trading opportunity.
More often than not, real time feeds are exposed as web socket streams. Web sockets are extremely sensitive to network glitches. Glitches – when the connection drops for a very small span of time – will cause your market data to lag badly as your client tries to reconnect/re-establish the feed, eventually leading to catastrophic failure.
The problem with glitches is that it is hard to work around. A complete drop in the connection can be handled by a router that can switch over to a backup connection. Glitches are more sinister.
For example, we have broadband connections from three different service providers (Hathway, Excitel and BSNL) to make sure our systems can stay connected. They all have varying degrees of stability and customer service. Here are the number of glitches per hour over the last few days:
You can work around 1-2 glitches an hour by making your re-connection logic more robust. However, there is no getting around the Hathway level of glitches.
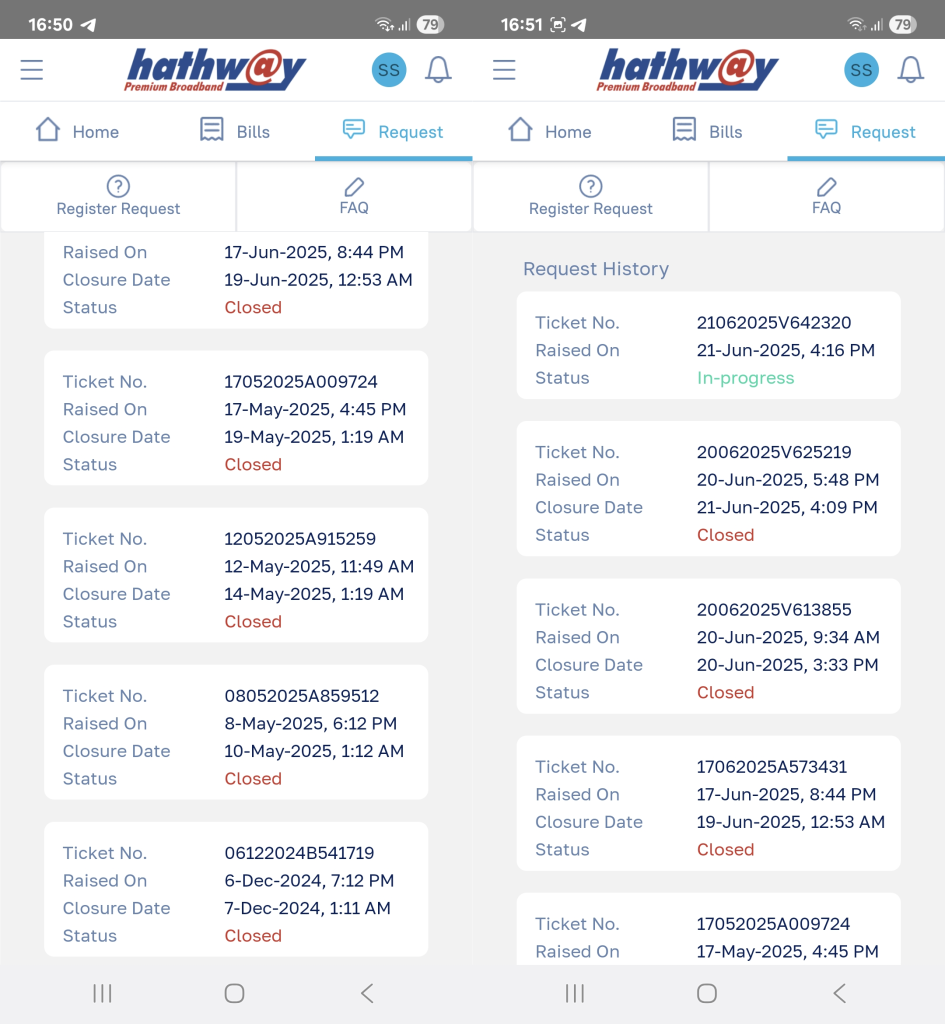
If your service provider itself is not monitoring for glitches, then explaining the problem to them is impossible. Support tickets get closed because “network is connected.” Here is a history of our support tickets with Hathway – an ongoing saga with no end:
As you scale, monitoring your infrastructure becomes increasingly important. Be aware that your service provider could be (willfully) blind to the specific issues you are facing – their job might depend on them not solving it. And, always have a backup and a backup for your backup.
The python code to monitor for glitches and the R code to draw the charts are on github.
The volatility risk premium (VRP) is the difference between implied volatility and realized (or actual historical) volatility. Implied volatility is, on average, overpriced compared to realized volatility.
The VRP exists because investors are essentially “selling insurance” when they sell implied volatility.
Volatility is negatively correlated with equity returns; typically, volatility increases when equity markets decline. Therefore, a short volatility position is implicitly “long equity risk”. Since equities are generally expected to earn an equity risk premium (ERP) over the risk-free rate, strategies that are implicitly long equity risk should also be abnormally profitable. This is why short volatility strategies tend to be profitable on average.
Just like how you can get long ERP by getting long an equity index, you should be able to get long VRP by programmatically shorting options and delta-hedging them. Volatility becomes a beta that you allocate towards.
Building Blocks
An option’s value changes relative to the price of the underlying – the rate of this change is called delta.
Gamma is the rate of change of delta given a change in the price of the underlying. As the underlying price moves, an option’s delta does not remain constant; gamma quantifies how much that delta will change.
Since we are only interested in volatility and not price, we can hedge out this delta. Delta-hedging a basket of options mitigates the exposure to the directional movement of the underlying. Profitability becomes solely determined by the volatility (not direction) of the underlying.
Vega is the rate of change of an option’s value relative to a change in implied volatility (IV). If IV rises or declines by one percentage point, the value of the option is expected to rise or decline by the amount of the option’s vega, respectively.
When you short options, you have negative gamma (you don’t want large price movements) and negative vega (you don’t want IV to rise). You hope for low realized volatility and falling IV. However, you have positive theta — time works in your favor.
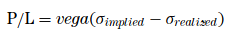
Theoretically, a delta-hedged short option position’s P&L = vega(IV – RV).1
Construction
Historically, NIFTY ATM option Implied Volatility across days-to-expiry, looks like this:
So, theoretically, if you shorted 30dte ATM calls and exited them at 7dte, your P&L distribution will look like this:
And the same thing with puts:
If you are willing to treat volatility as just-an-other beta, then by creating programmatic delta-hedged short ATM straddle/strangle portfolio, you can get long this beta.
Just as it is with ERP, one could build models to time VRP. Having a beta portfolio as a benchmark should help.