Sharpe Ratios are often used to sort through competing investments. It is the original “risk adjusted returns.” It’s a mathematical expression of the insight that excess returns over a period of time may signify more volatility and risk, rather than investing skill (investopedia, wikipedia).

Rb or Rf, the risk-free return, is usually cumbersome to handle. So, typically, it is either set to zero or a constant value. The problem is that rates vary over time and has an impact on the relative ordering of investments.
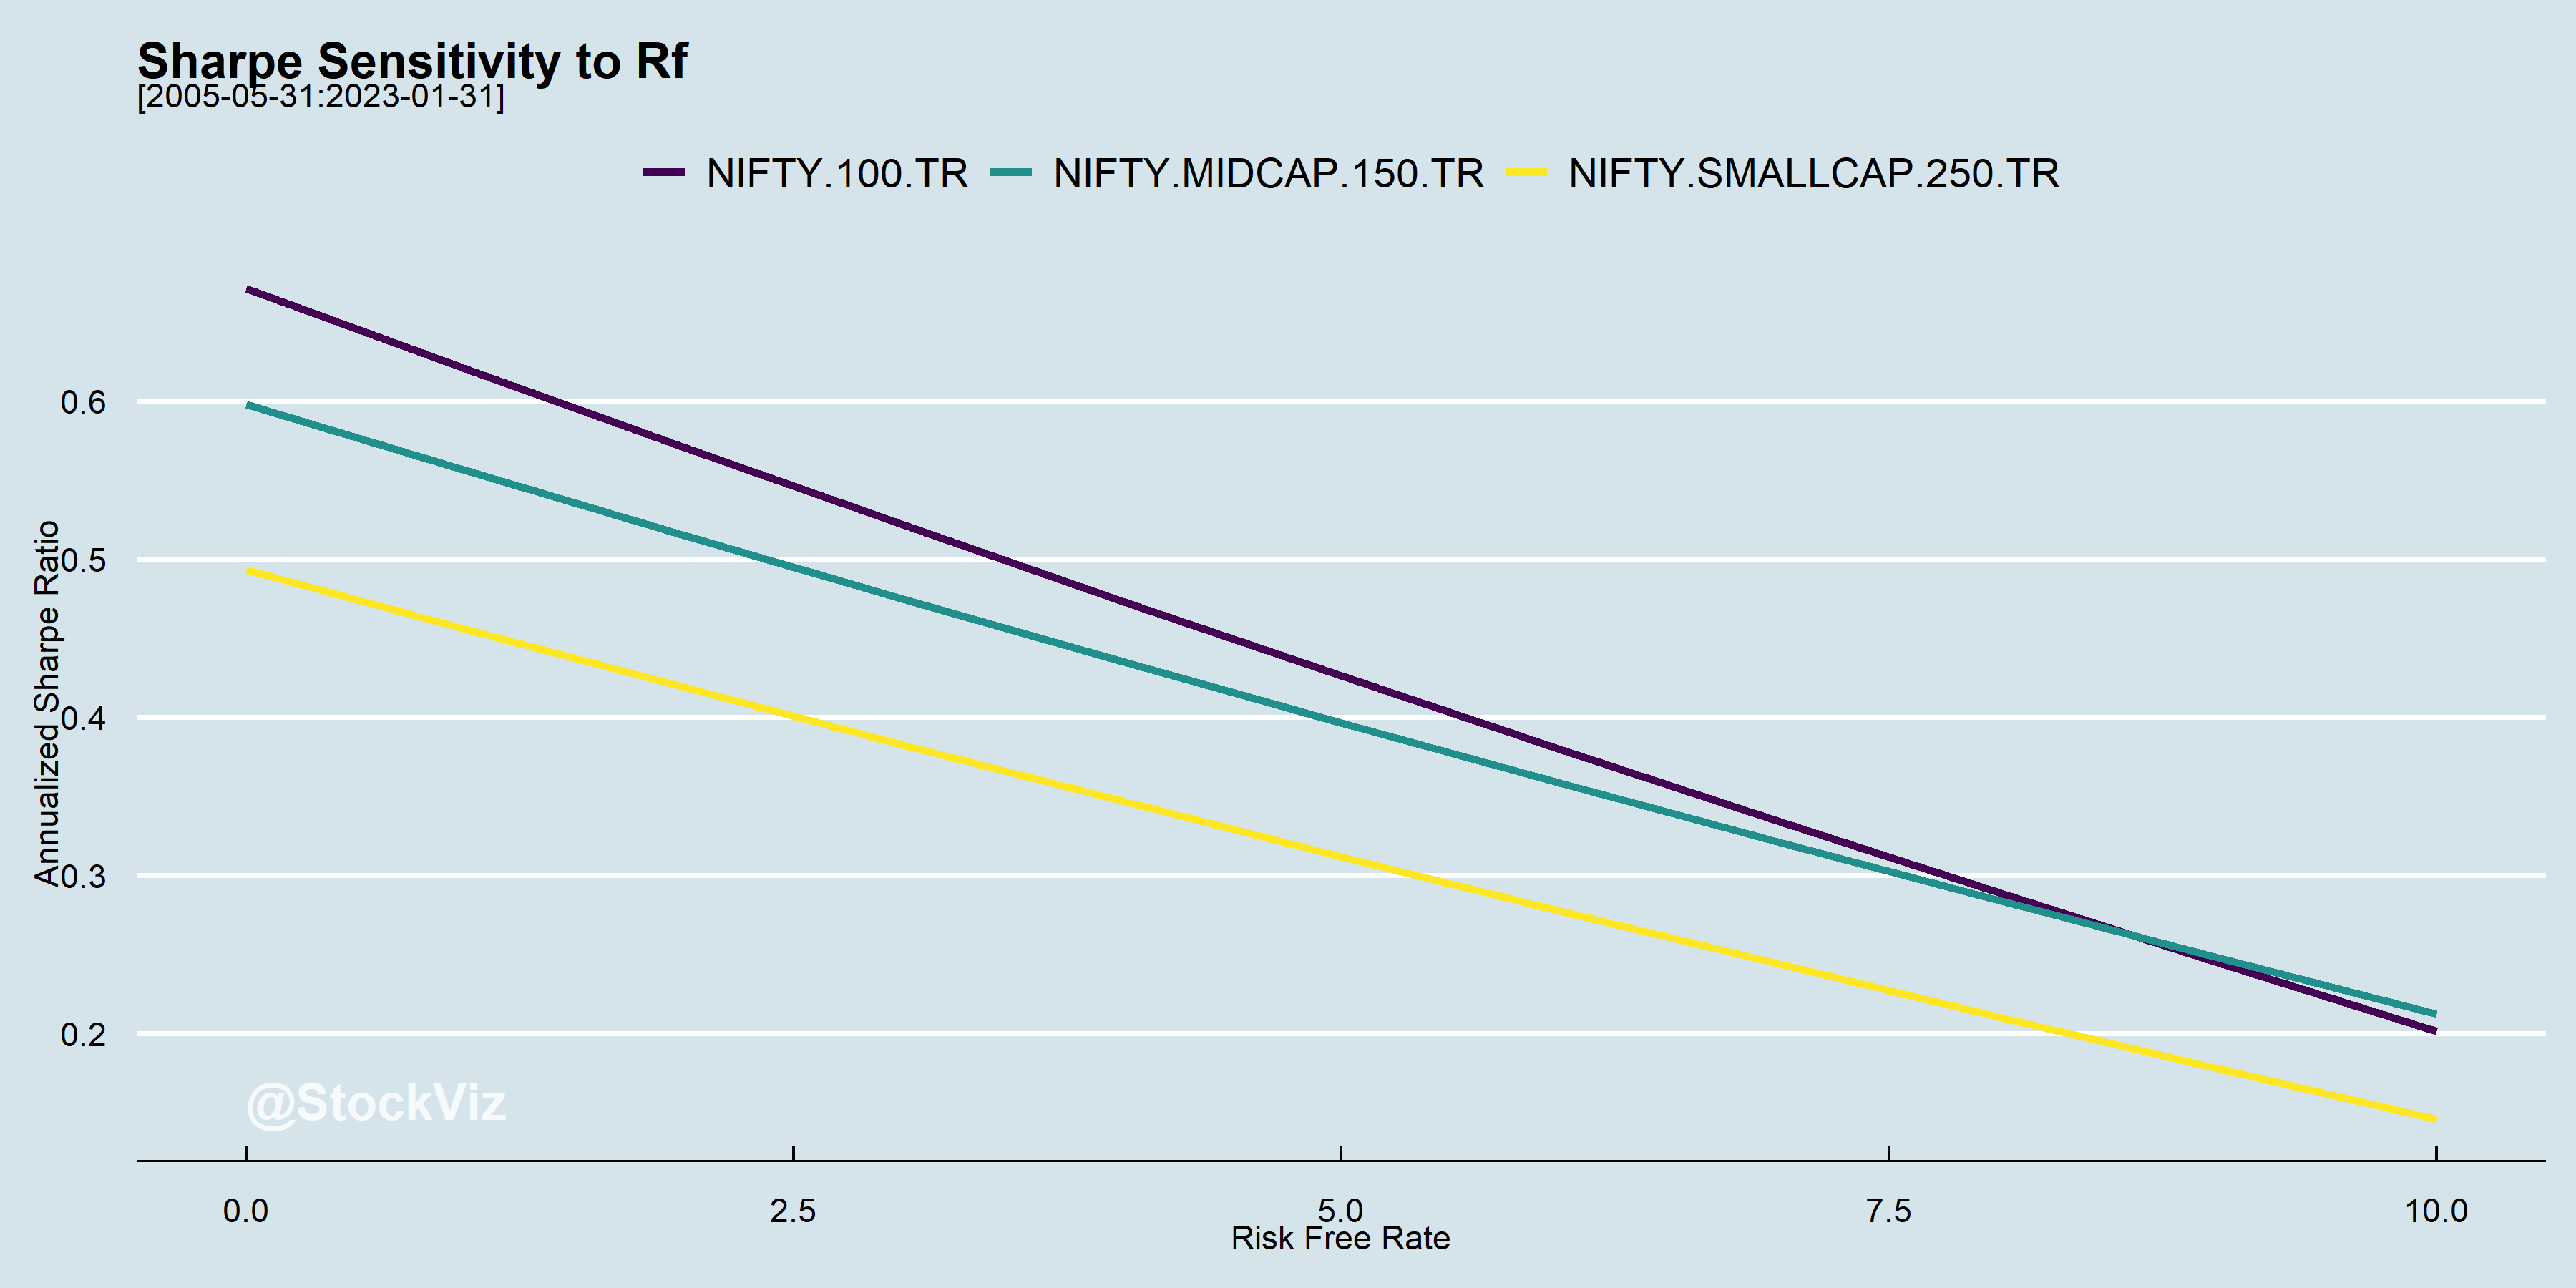
At high interest rates, SR(mid-caps) > SR(large-caps)
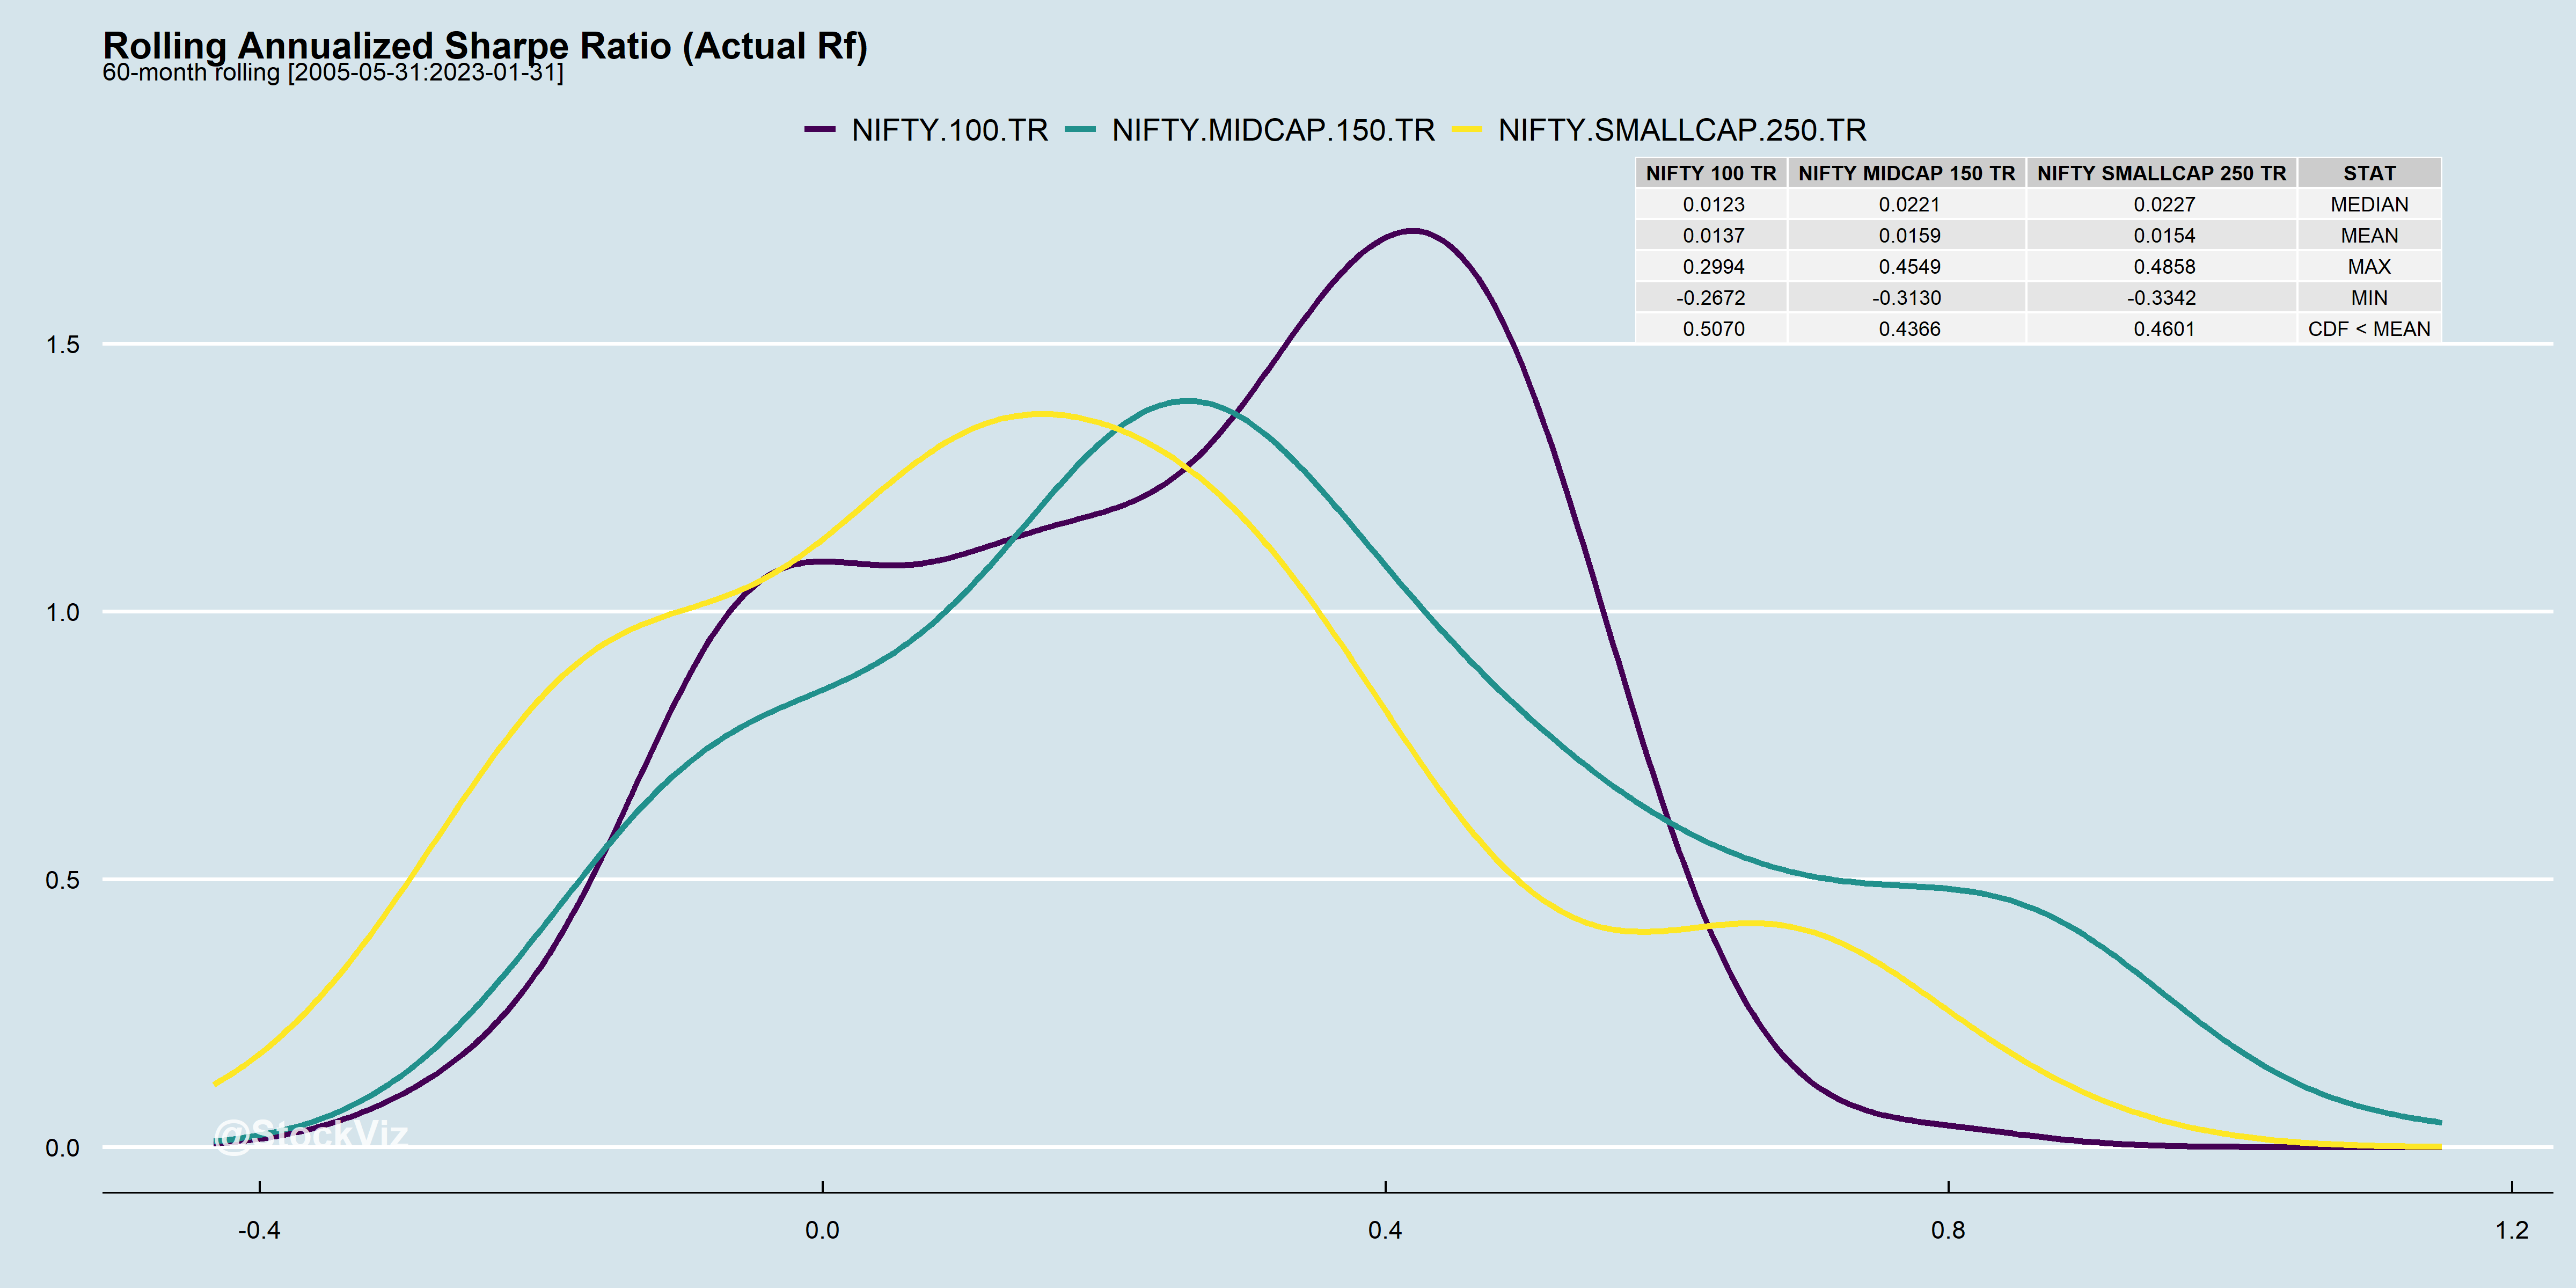
Ideally, you want your Sharpes to be positive and stable. Unfortunately, that is never the case.
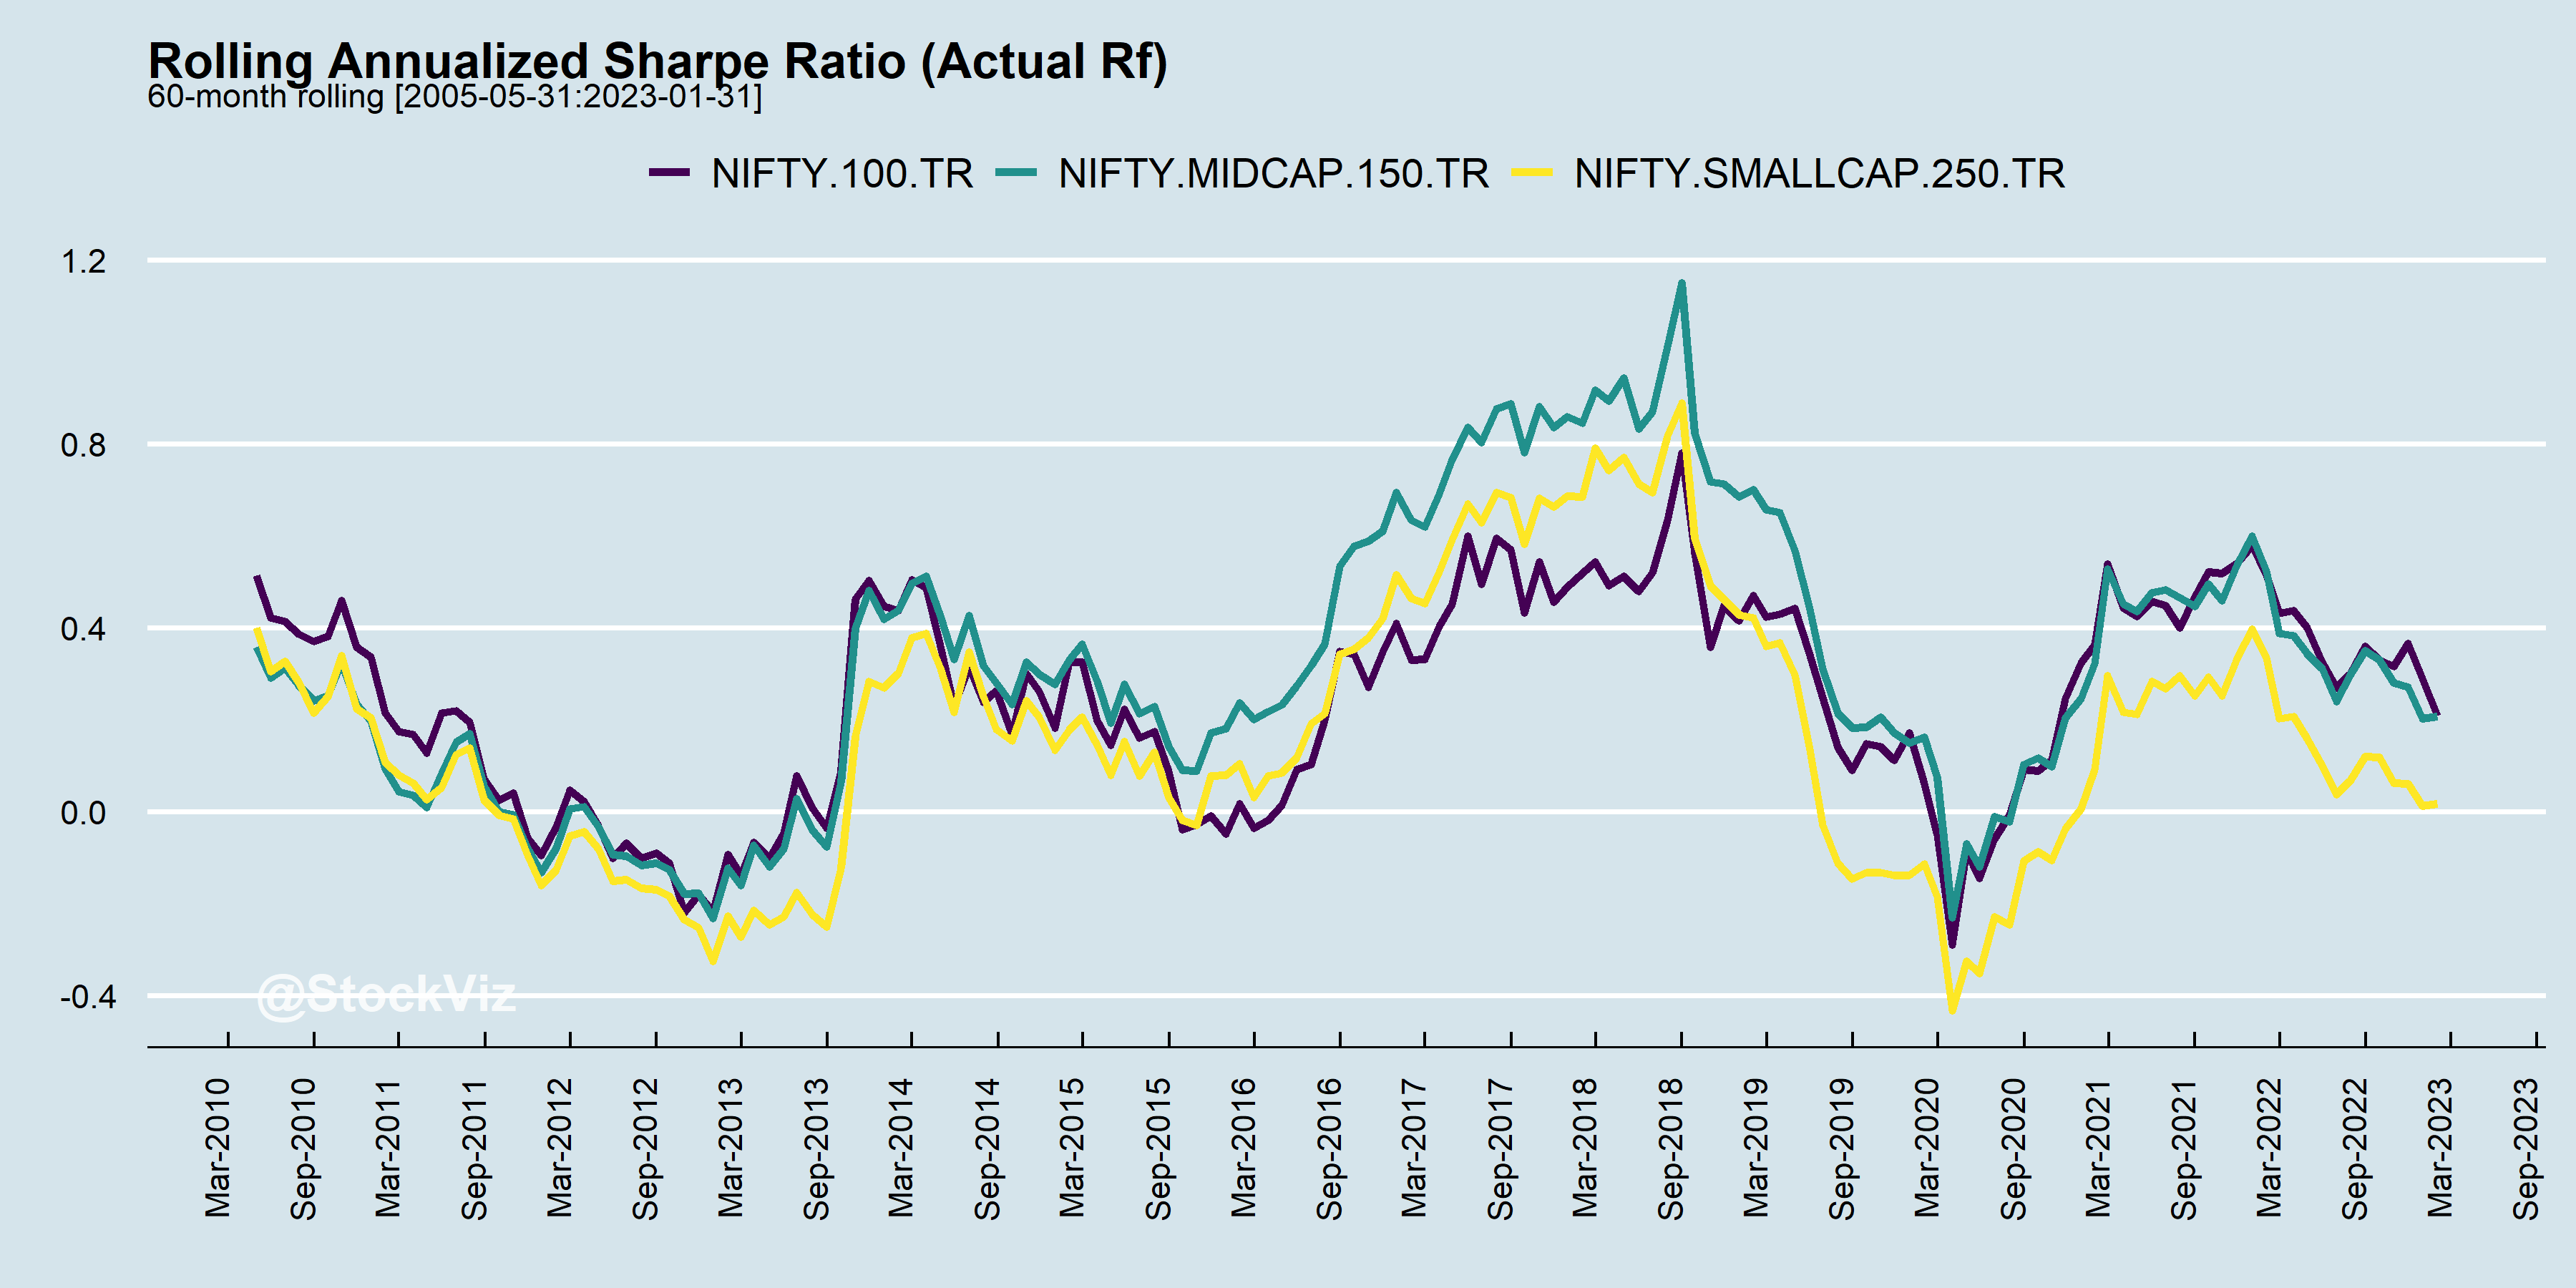
During bull markets, Sharpes trend up and reverse course in bears.
At the end of the day, it boils down to whether the returns are worth the risk.
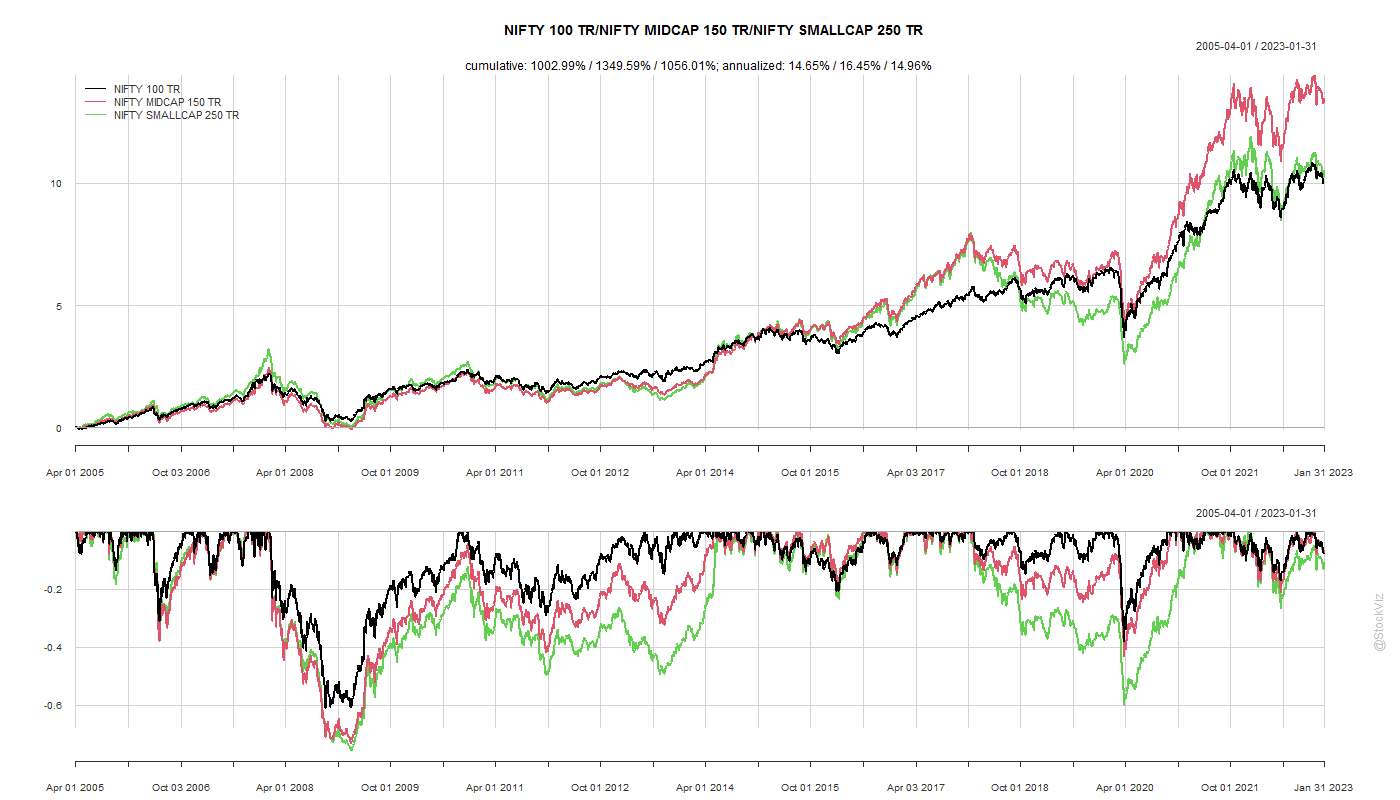
You might very well be trying to catch lightening in a bottle.
For more index stats, visit our Index Metrics dashboard.