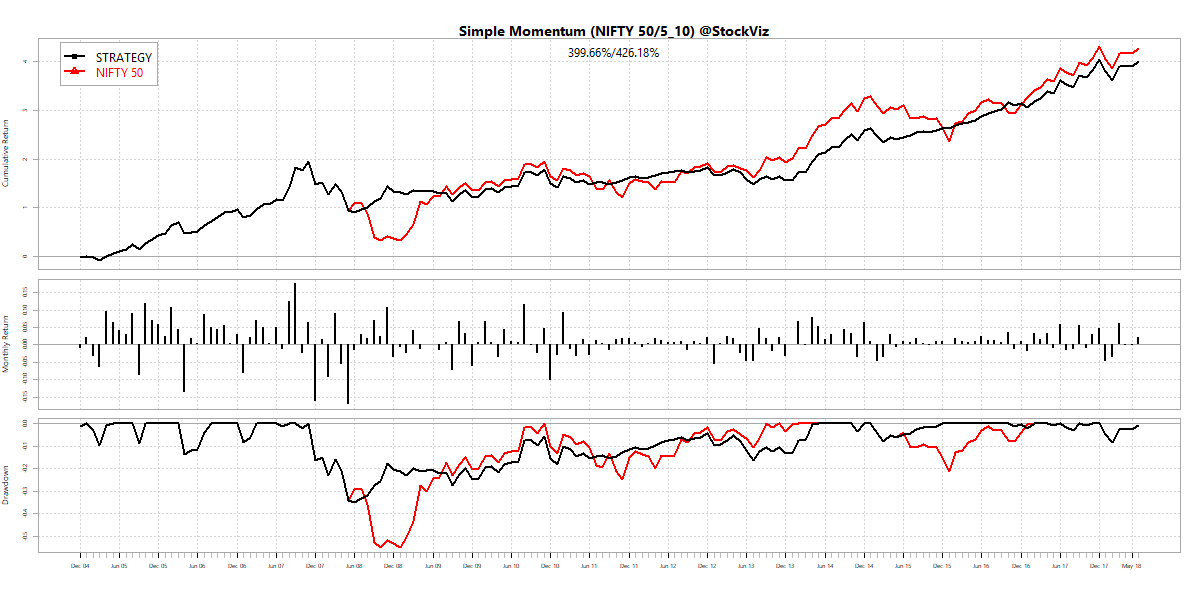
Compare and Plot multiple time-series datasets
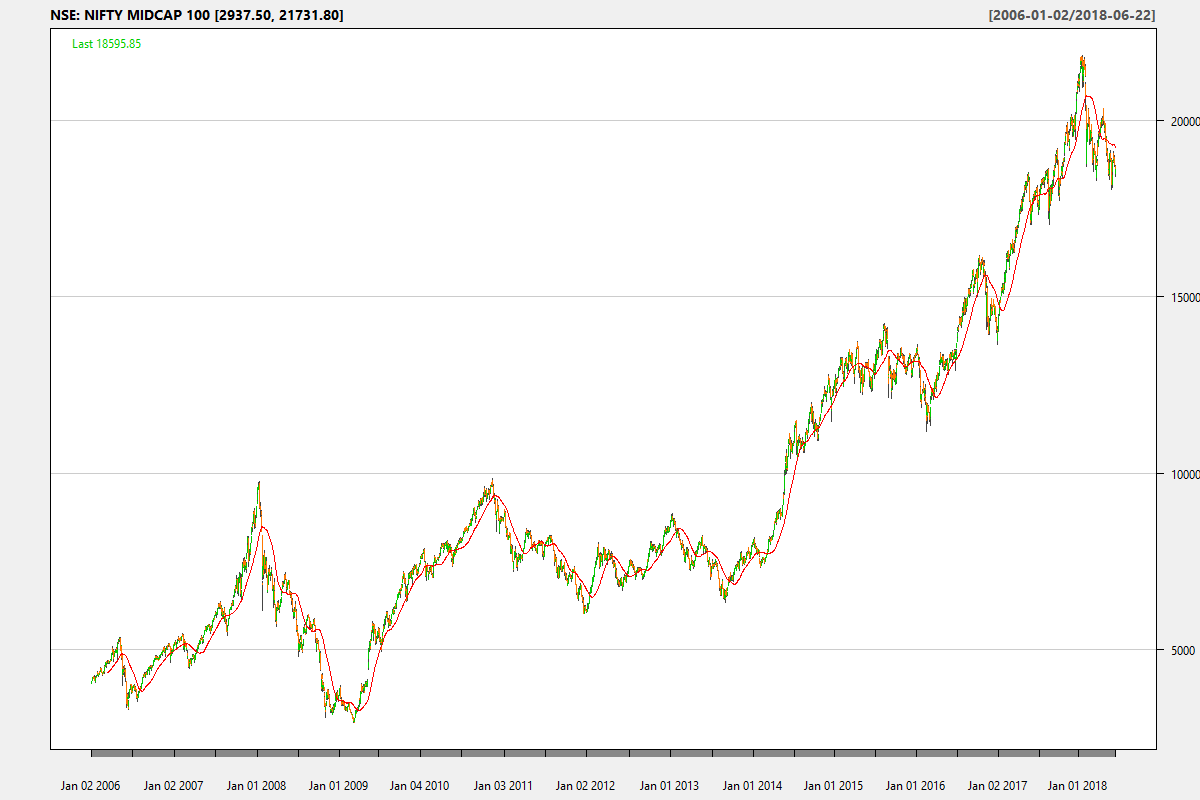
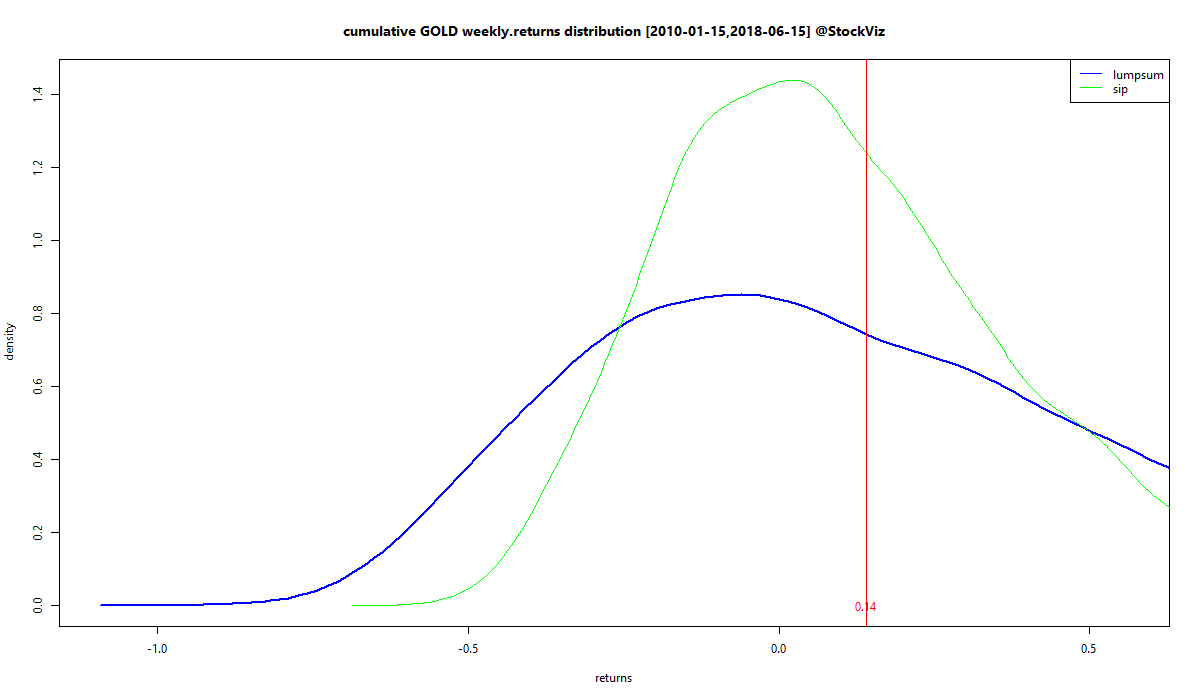
Ever wondered how the dollar adjusted NIFTY MIDCAP 100 index performed vs. US Midcaps? Wonder no more! You can now quickly run a comparison using our new Compare tool.
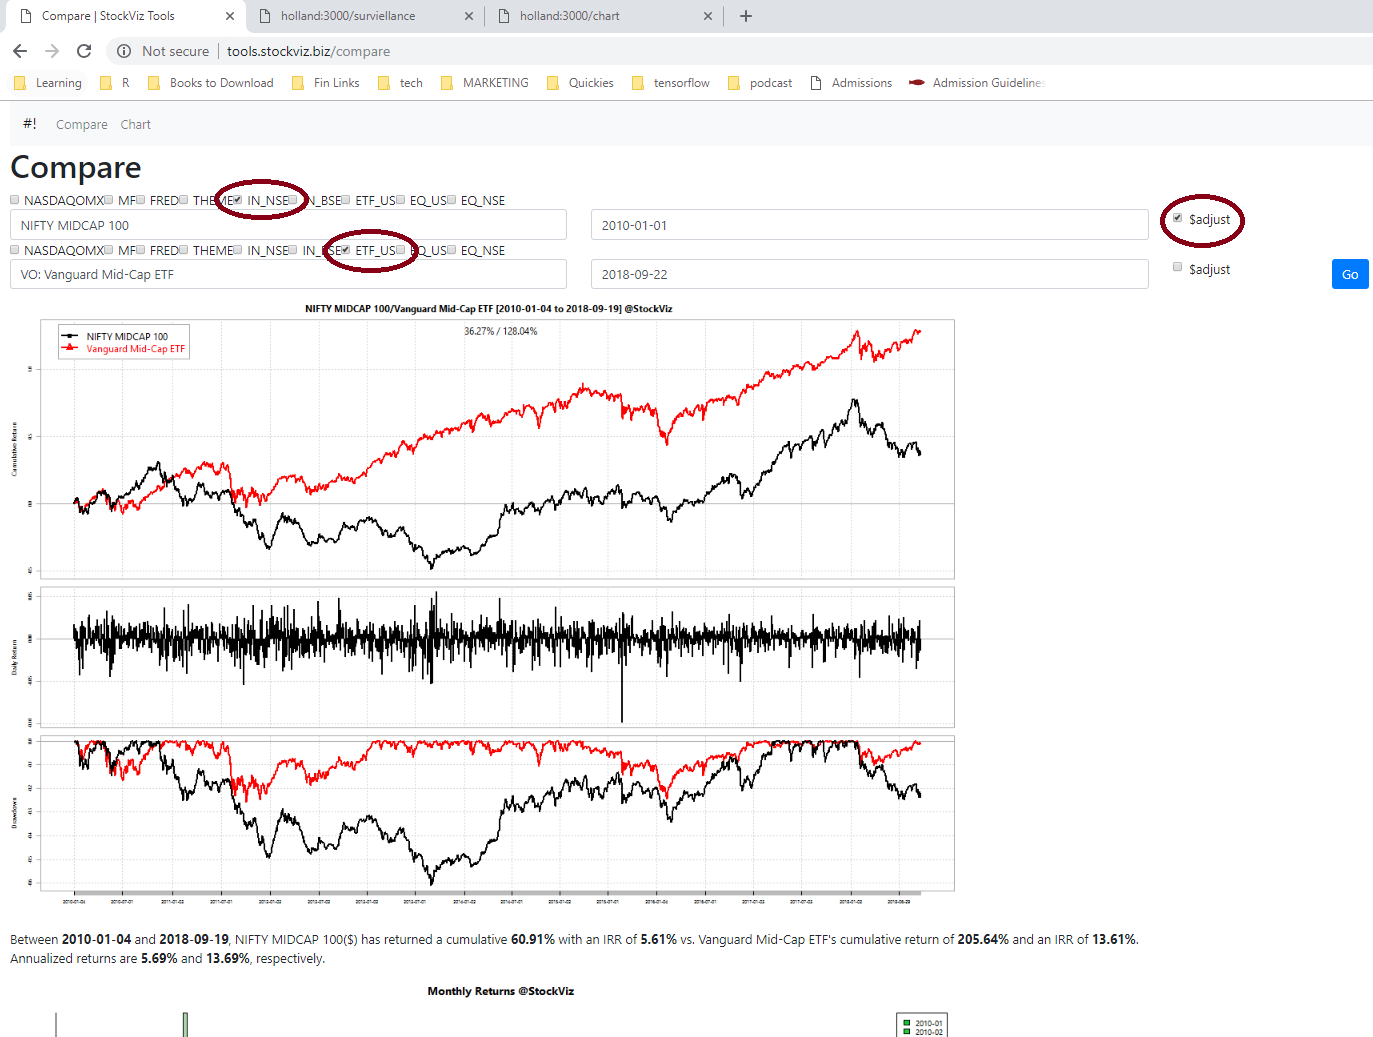
We have made a large number of datasets available:
| NASDAQOMX | The NASDAQ OMX TR USD Dataset |
| MF | A pruned set of Indian mutual funds |
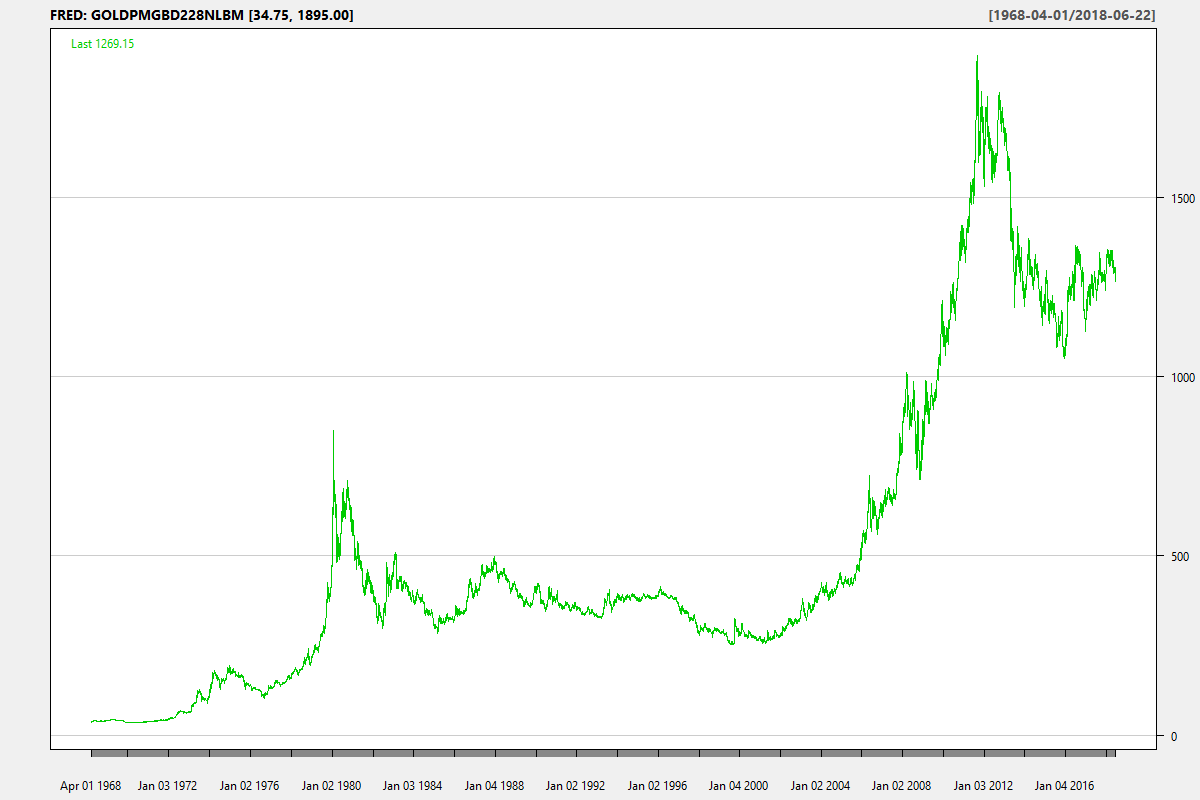
| FRED | The St. Louis FRED dataset |
| THEME | StockViz Themes |
| IN_NSE | Indices available on the NSE |
| IN_BSE | Indices available on the BSE |
| ETF_US | US listed ETFs |
| EQ_US | US listed Stocks |
| EQ_NSE | Stocks listed on the NSE |
| EQ_BSE | Stocks listed on the BSE |
| MCX | Commodity futures listed on MCX |
| NCDEX | Commodity futures listed on NCDEX |
The “THEME” comparison tools also gives you the impact of STT and brokerage costs on returns.
So, now you can compare pretty much anything with everything.
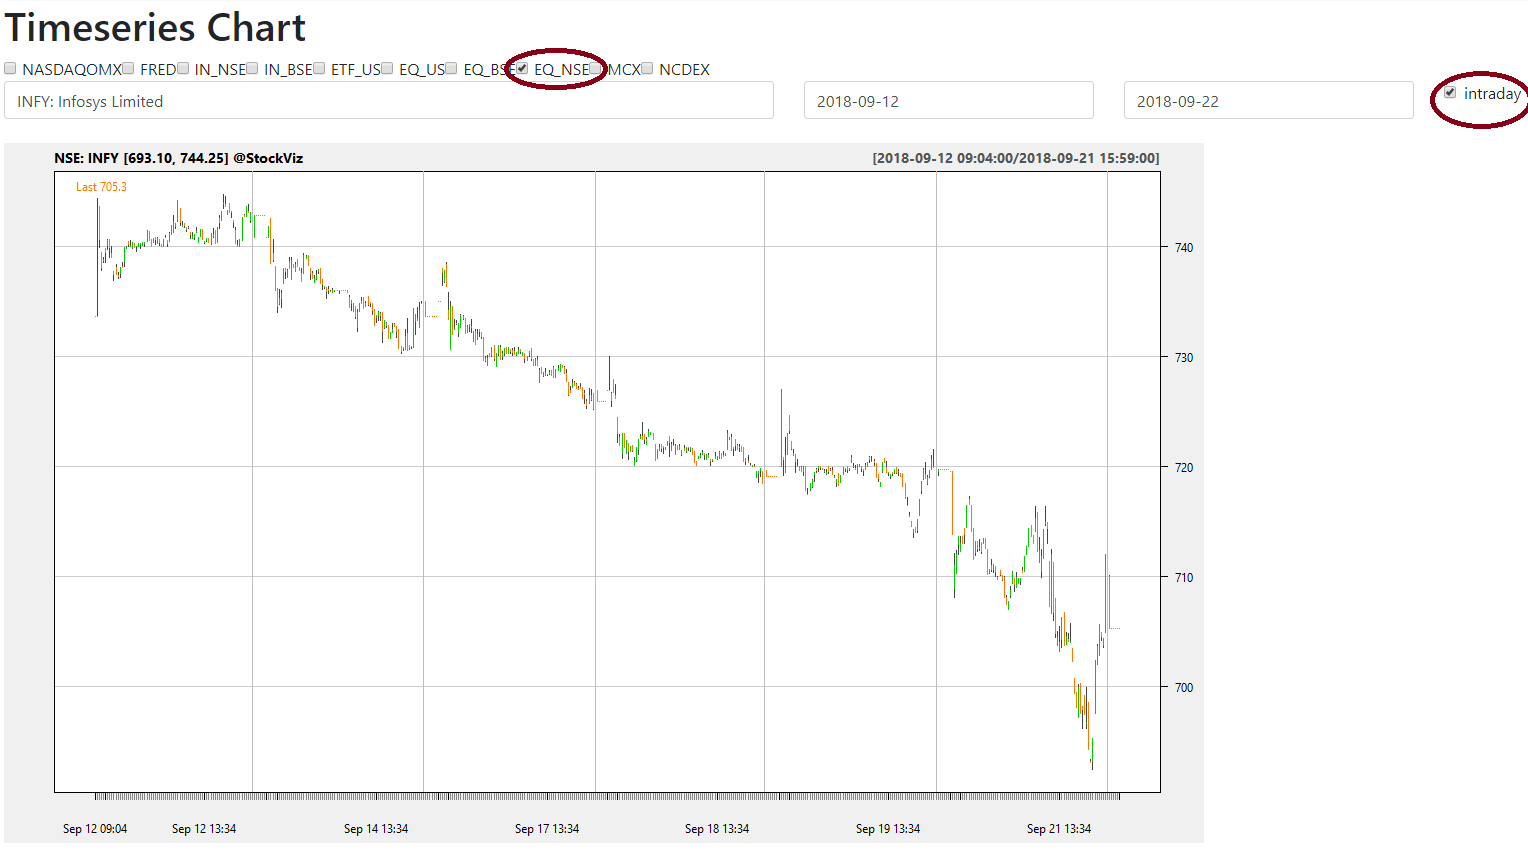
When it comes to plotting a single time-series, we have made intraday prices on stocks listed on the NSE available. You can run these 10-days at a time:
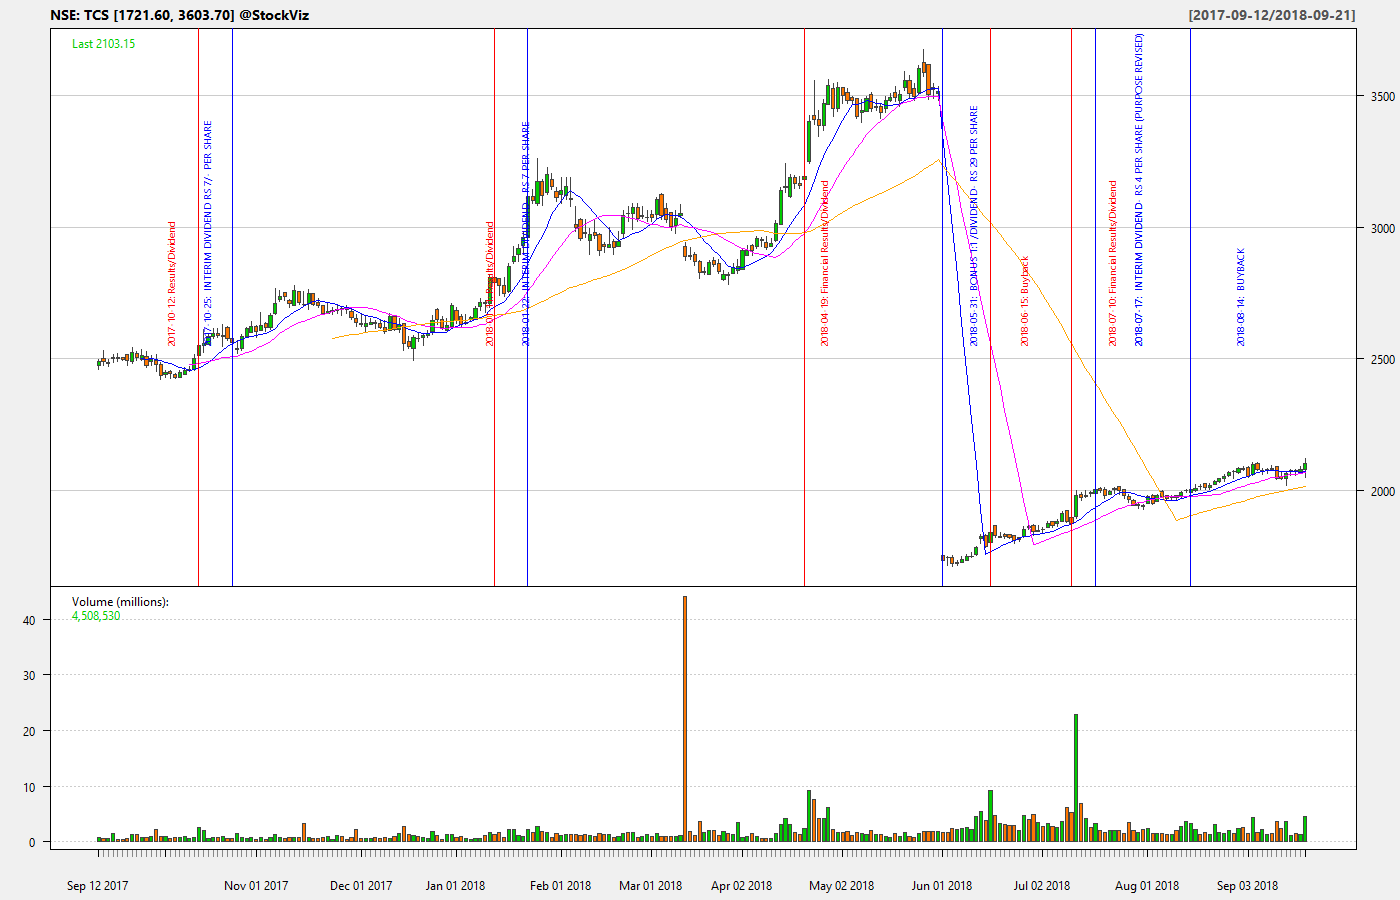
The daily chart of NSE stocks also marks important corporate actions:
Keeping it free
The biggest challenge we faced was managing data storage costs. Earlier, we tried to upload all the data to the cloud but we quickly ran into performance bottlenecks and costs overruns. So we went back to the drawing board and designed a hybrid solution where the data and the analytics reside within our firewalls and only results are displayed to the user. This allows us to keep these tools free and open to everybody.
I want more!
If you want to see something here that would be of interest to other investors/traders, please WhatsApp us (+918026650232) with your ideas!