Midcaps, proxied by the NIFTY MID100 FREE index, have given an annualized return of over 18% from 2001 through August-2016. That is a 12x return over 15 years. Sounds good when you say it that way, doesn’t it? Take a look at how Rs. 1 has grown over the years:
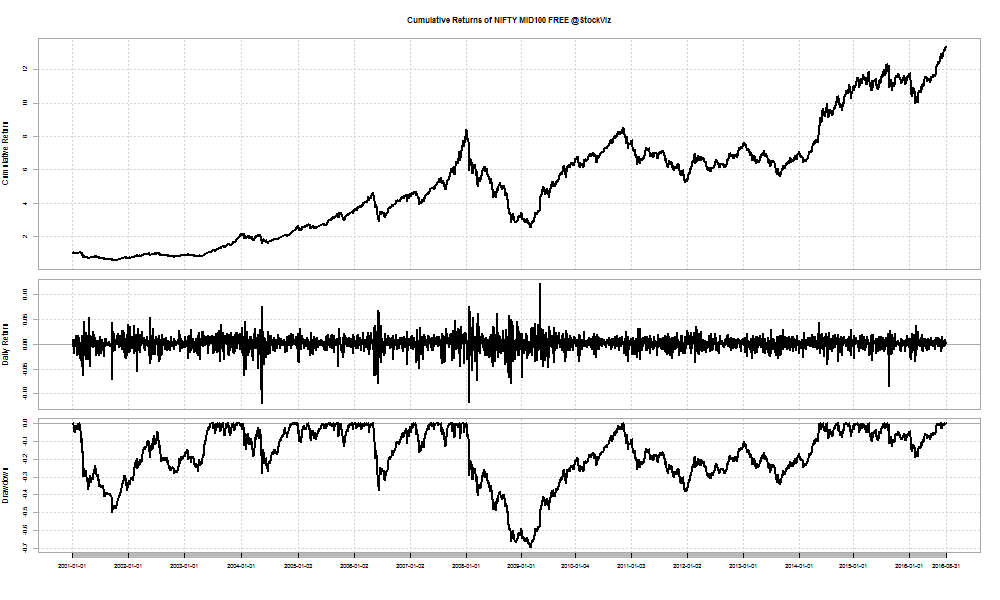
Now, zoom into the bottom-most chart – the drawdown chart:
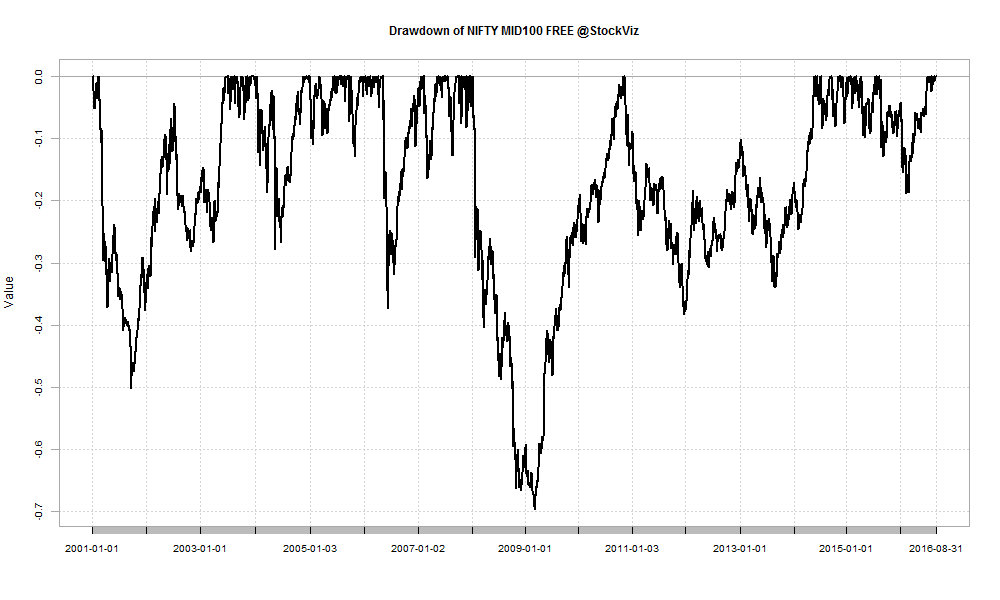
The point-to-point drawdown chart is horrific enough. Investors saw a 70% loss during the Global Financial Crisis (GFC) in 2008/09. 30% drawdowns occur with regular frequency. Investors make it worse by looking at their investments too often.
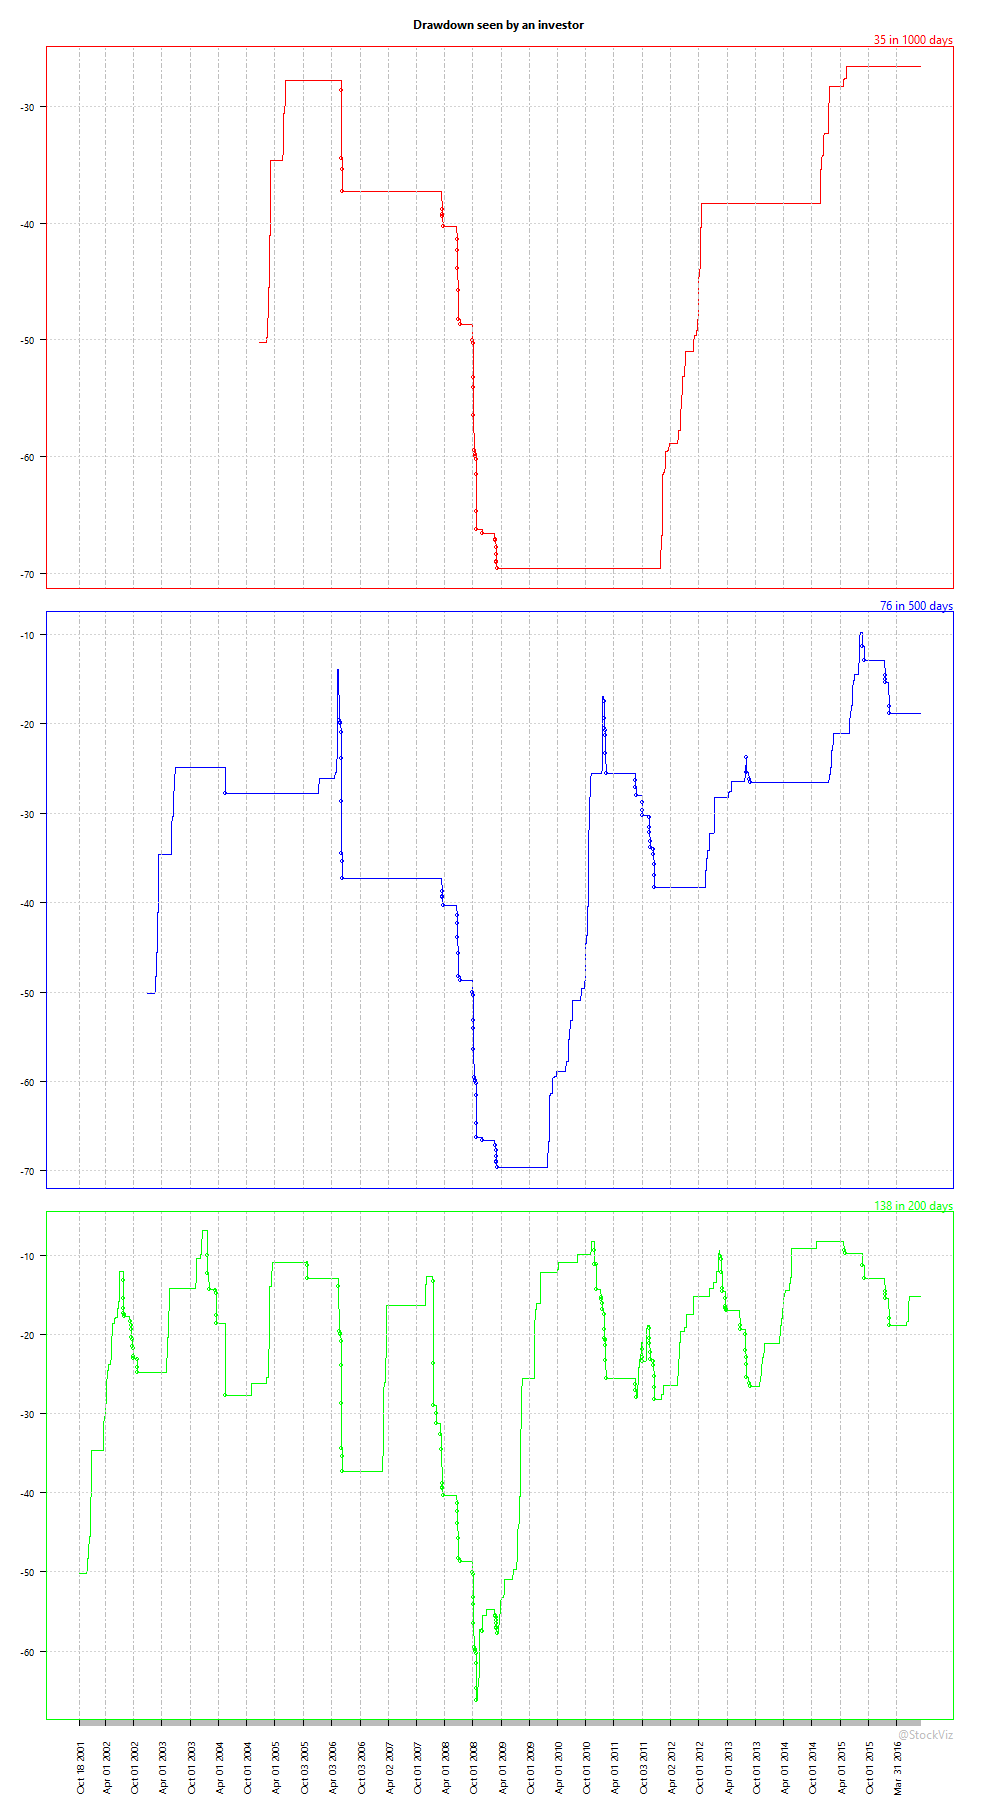
For example, if an investor saw the returns of his portfolio once every 1000 days (4-5 years,) he would not have seen more than 35 drawdowns during the period. Move the observation to every 200 days (about a year,) and the number ticks up to 138. The more you check your portfolio, more the number of losses that you see:
New investors have rightfully taken the SIP route to saving in equities. However, they would be doing themselves a disservice if they expect a fixed-deposit like consistency in equity returns.
For the quant inclined, code for this analysis can be found on Github.
Related: Definition: Drawdown