Dynamic allocation
Ideally, you should buy stocks of companies when they are undervalued and sell them when they are overvalued. But what if the entire market is overvalued? Does it still make sense to try and find “bargains?” When valuations revert to mean, all stocks get dragged down with the rest of the market. To avoid this scenario, there are some funds that use broad-market valuations to dictate total exposure to equities vs. bonds/arbitrage. If this strategy works correctly, then drawdowns should be lower and long-term returns should beat a buy-and-hold strategy.
Let us pick the most popular of these dynamic allocation funds – the Franklin India Dyn PE Ratio FoF – and see how it works in practice.
Franklin India Dynamic PE Ratio Fund of Funds
According to MorningStar, the Dynamic PE Fund holds ~50% of its corpus in Franklin India Bluechip Fund. Instead of comparing the Dynamic fund to an index, lets see how it compares if you just bought and held the underlying fund.
Between 2007-01-02 and 2015-07-20, Franklin India Dynamic PE Ratio Fund of Funds has returned an IRR of 11.44% vs. Franklin India Bluechip Fund’s IRR of 12.67%
The draw-downs have been lower, but the returns have tracked buy and hold.
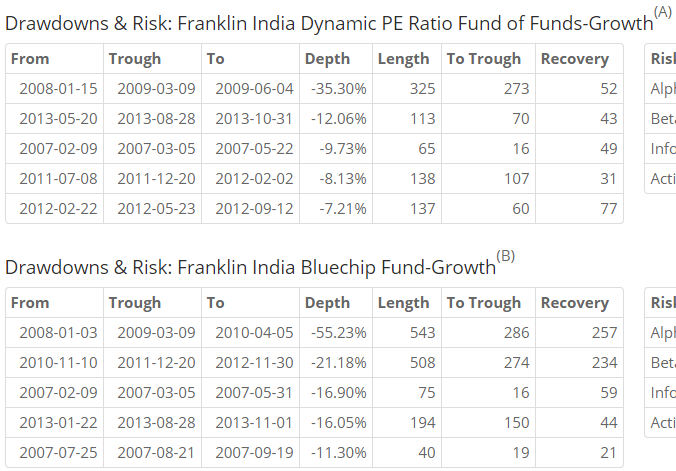
The twist in this story is the tax angle. To be treated as an equity fund for tax purposes, at least 65% of the corpus should be in equities. The Dynamic PE fund ends up being treated as a debt fund – so you end up paying tax on capital gains. Whereas if you just B&H the underlying equity fund, you pay no tax if you hold it beyond a year.
The Principal SMART Equity Fund
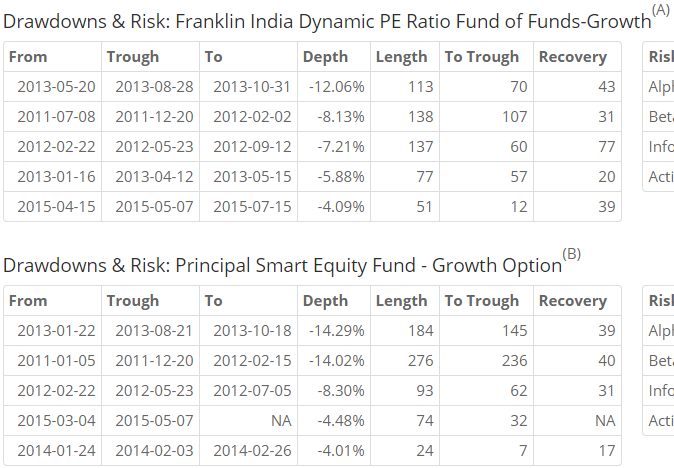
One way that fund managers have tried to work around the tax angle is to invest in arbitrage strategies instead of debt. For example, if you look at Principal’s SMART Fund (SMART from Factsheet – June2015,) even though they have only 43% in equities, the fact that they have 35% in cash-future arbitrage makes the fund an equity fund for tax purposes.
Between 2011-01-03 and 2015-07-20, Franklin India’s Dynamic PE Ratio Fund has returned an IRR of 10.28% vs. Principal Smart Equity Fund’s IRR of 11.86%
The slightly better performance came at the cost of higher draw-downs:
Who should invest?
These funds are good if you are scared about draw-downs and want some reassurance that you will not be buying overvalued stocks. However, not buying overvalued stocks is something that should be expected of all fund managers, irrespective of what the fund is called.
We can argue that shallower draw-downs help investors stick to the investment plan. They are less likely to panic and exit at the bottom. However, this where a good financial adviser earns his keep – holding the investor’s hand during volatile markets and helping him stick to the plan.
This could be a good fit for someone who is nearing the end of their savings phase and want an investment with lesser potential draw-downs. However, the same can be achieved at the portfolio level with a pure equity and a pure bond/arbitrage fund.
This leads us to the conclusion that these funds are good if you have a trust deficit and information problem. i.e. you don’t trust that a long-only equity fund will retrace its draw-down, don’t trust your investment adviser to stick around when the market tanks and don’t have a good portfolio level view on how your investments are allocated.