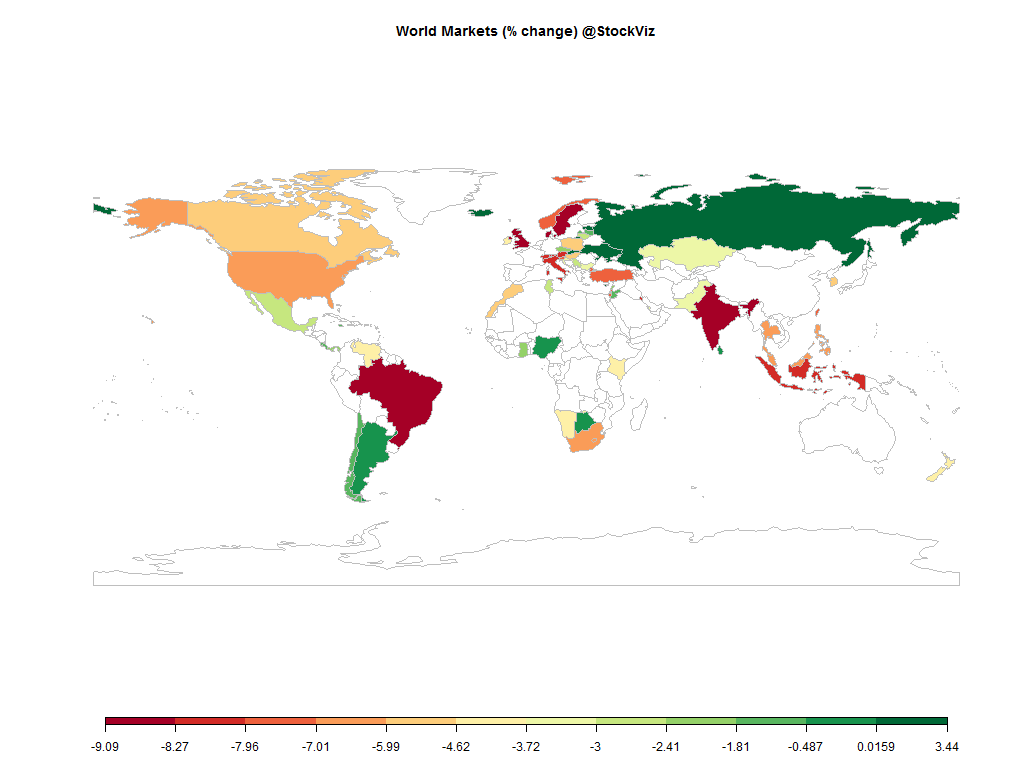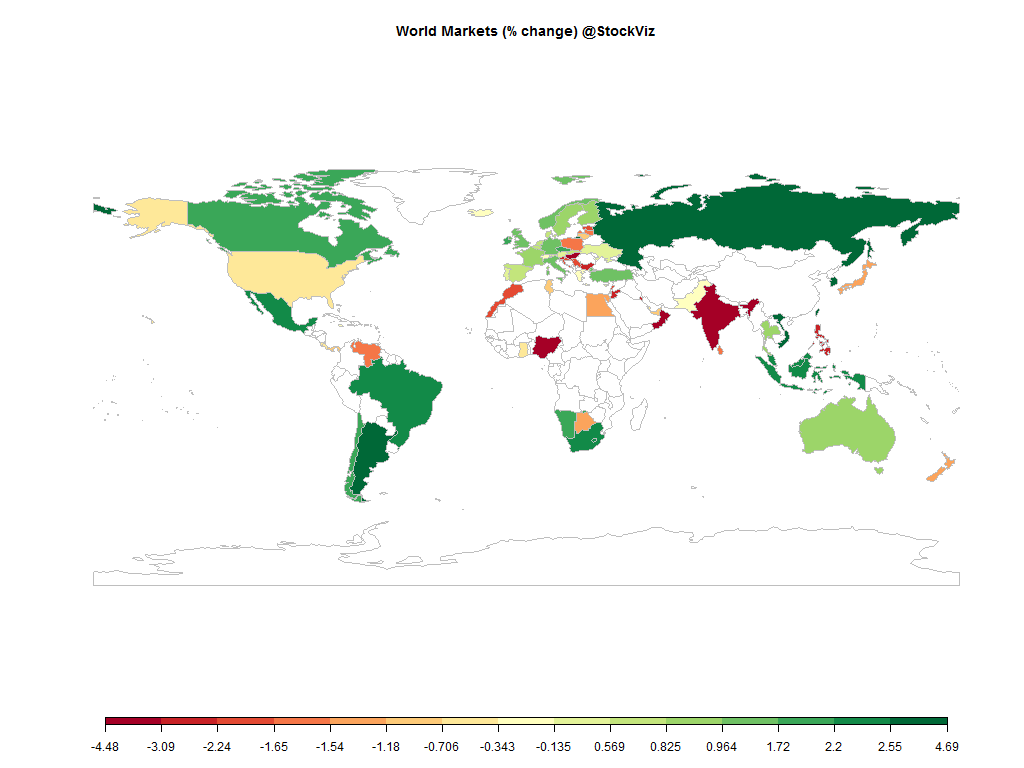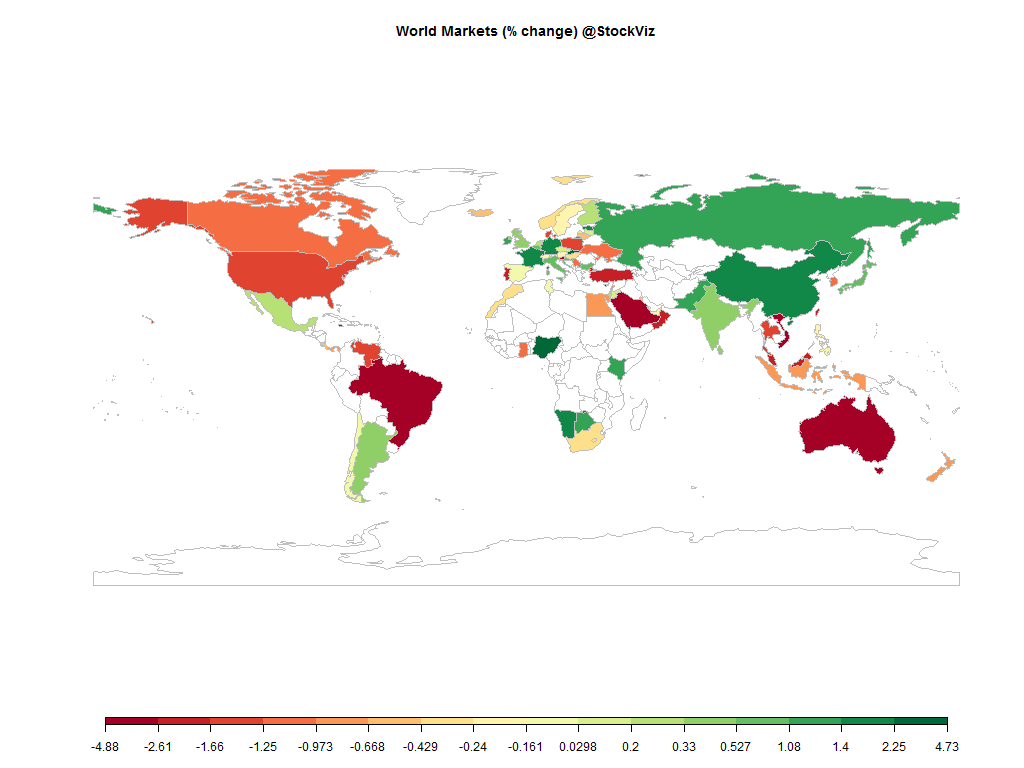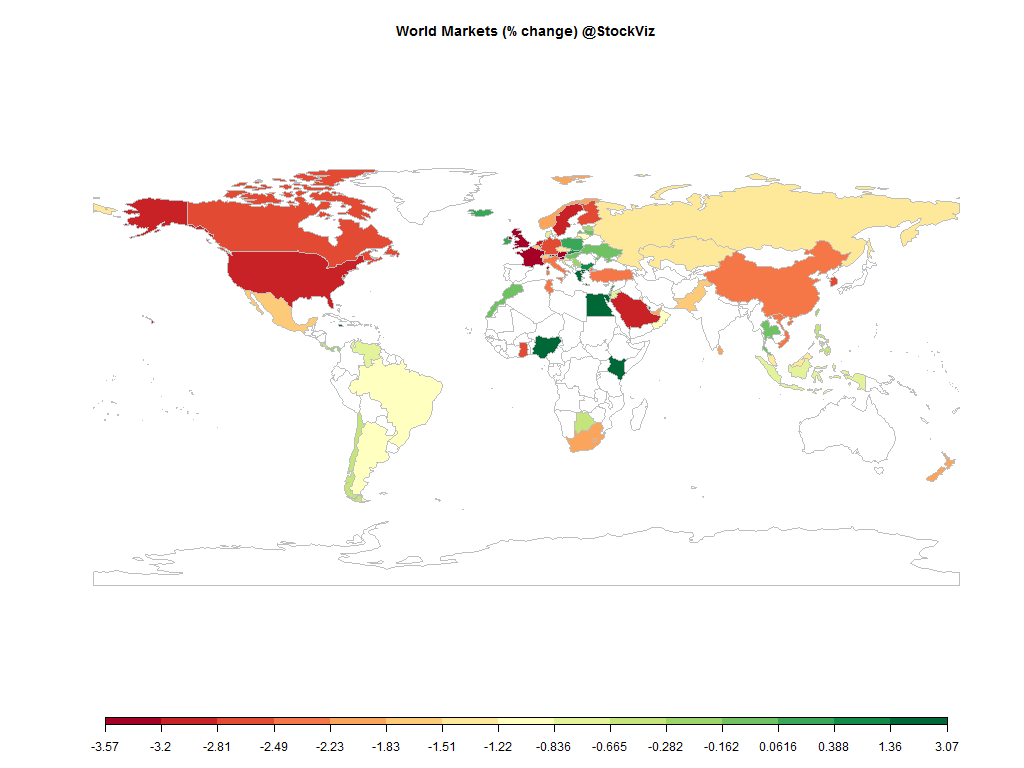
Equities
| MINTs | |
|---|---|
| JCI(IDN) | -0.69% |
| INMEX(MEX) | -1.58% |
| NGSEINDX(NGA) | +2.36% |
| XU030(TUR) | -2.29% |
| BRICS | |
|---|---|
| IBOV(BRA) | -1.17% |
| SHCOMP(CHN) | -2.23% |
| NIFTY(IND) | -4.34% |
| INDEXCF(RUS) | -1.22% |
| TOP40(ZAF) | -1.88% |
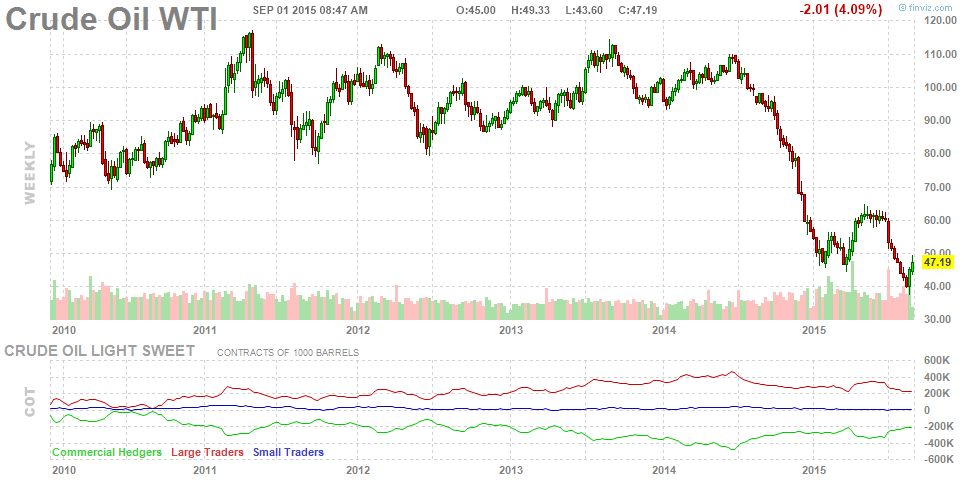
Commodities
| Energy | |
|---|---|
| RBOB Gasoline | -7.45% |
| Ethanol | +1.32% |
| Natural Gas | -2.28% |
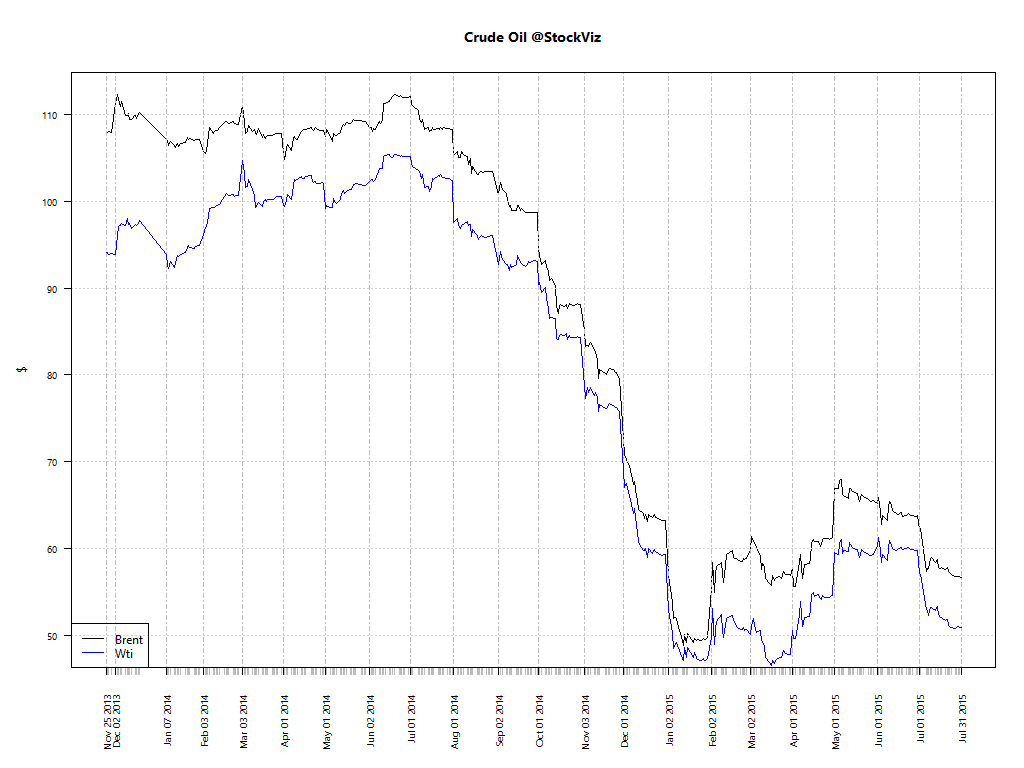
| WTI Crude Oil | +1.10% |
| Brent Crude Oil | -1.08% |
| Heating Oil | +0.74% |
| Metals | |
|---|---|
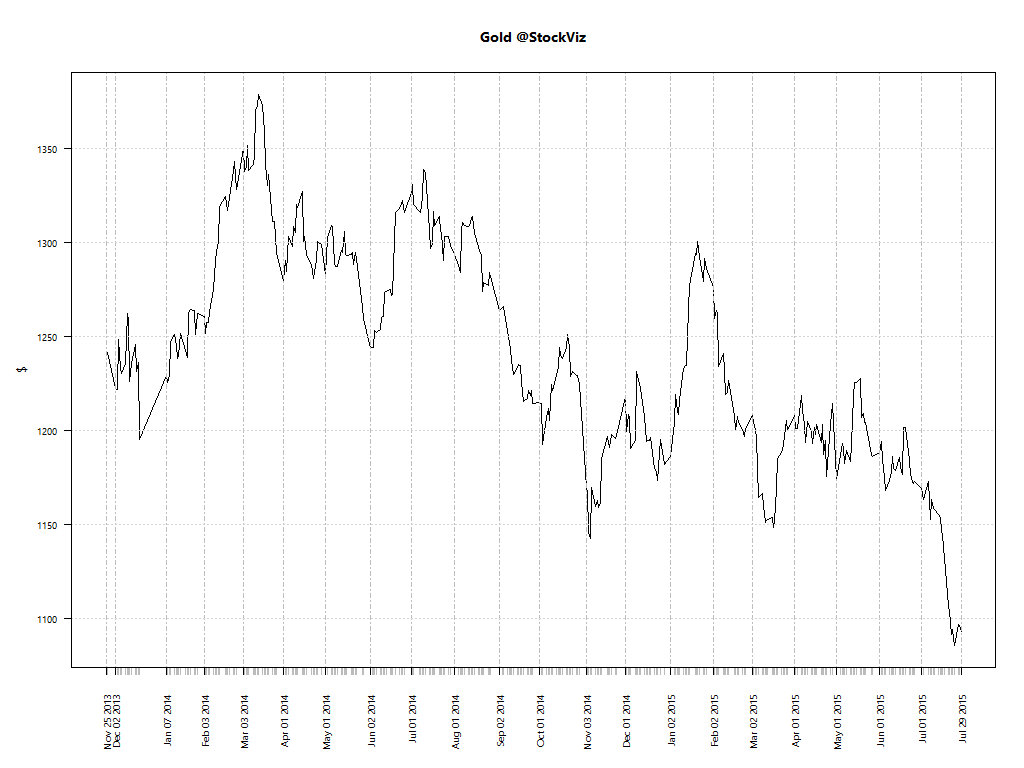
| Gold 100oz | -0.98% |
| Platinum | -2.53% |
| Silver 5000oz | +0.69% |
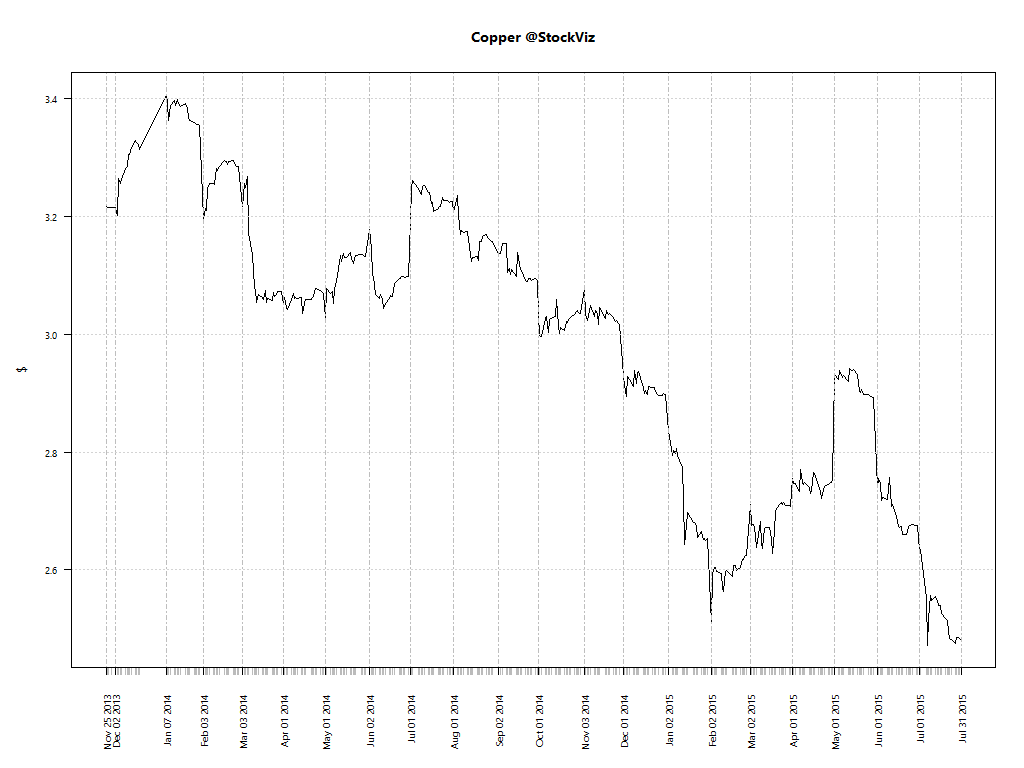
| Copper | -0.43% |
| Palladium | -2.30% |
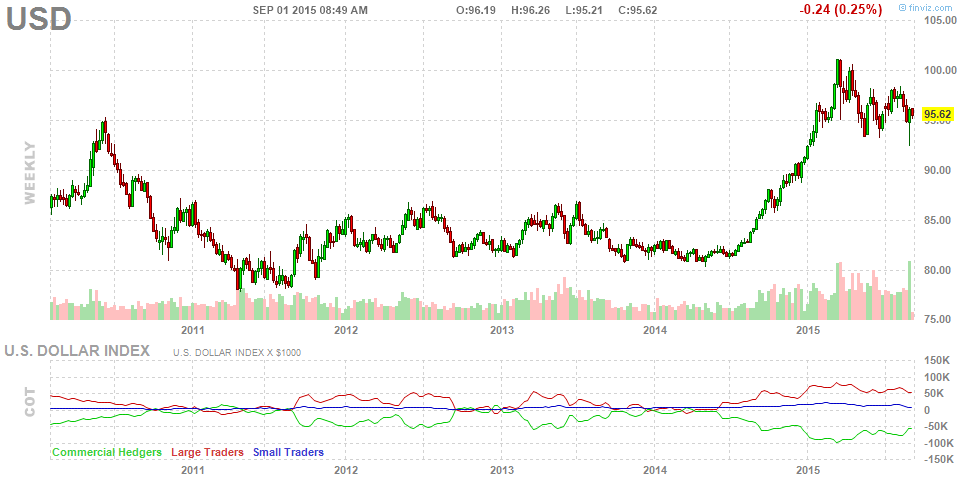
Currencies
| MINTs | |
|---|---|
| USDIDR(IDN) | +1.36% |
| USDMXN(MEX) | +1.03% |
| USDNGN(NGA) | +0.04% |
| USDTRY(TUR) | +2.88% |
| BRICS | |
|---|---|
| USDBRL(BRA) | +7.20% |
| USDCNY(CHN) | -0.53% |
| USDINR(IND) | +0.46% |
| USDRUB(RUS) | +4.73% |
| USDZAR(ZAF) | +4.06% |
| Agricultural | |
|---|---|
| Cattle | -3.81% |
| Lean Hogs | +3.91% |
| Lumber | -1.47% |
| Sugar #11 | +2.65% |
| White Sugar | +2.26% |
| Cocoa | +2.79% |
| Orange Juice | +1.51% |
| Soybean Meal | -2.37% |
| Coffee (Arabica) | -4.06% |
| Soybeans | -1.96% |
| Wheat | -4.08% |
| Coffee (Robusta) | +1.66% |
| Corn | -3.79% |
| Cotton | -1.87% |
| Feeder Cattle | -0.74% |
Credit Indices
| Index | Change |
|---|---|
| Markit CDX EM | -0.65% |
| Markit CDX NA HY | -1.01% |
| Markit CDX NA IG | +3.80% |
| Markit iTraxx Asia ex-Japan IG | +9.23% |
| Markit iTraxx Australia | +3.94% |
| Markit iTraxx Europe | +3.26% |
| Markit iTraxx Europe Crossover | +16.42% |
| Markit iTraxx Japan | +2.03% |
| Markit iTraxx SovX Western Europe | +0.09% |
| Markit LCDX (Loan CDS) | +0.00% |
| Markit MCDX (Municipal CDS) | -1.50% |
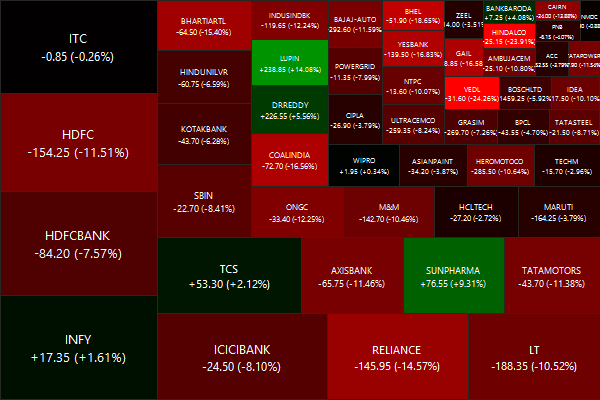
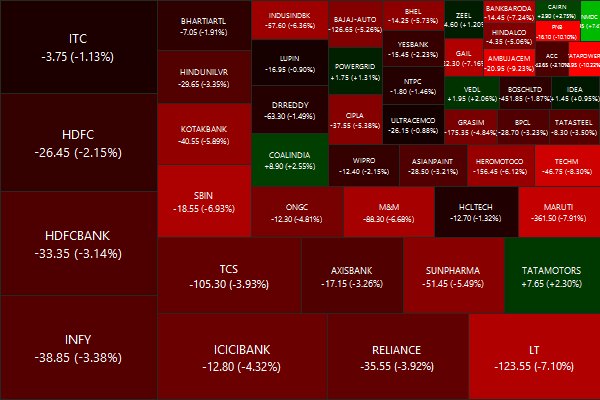
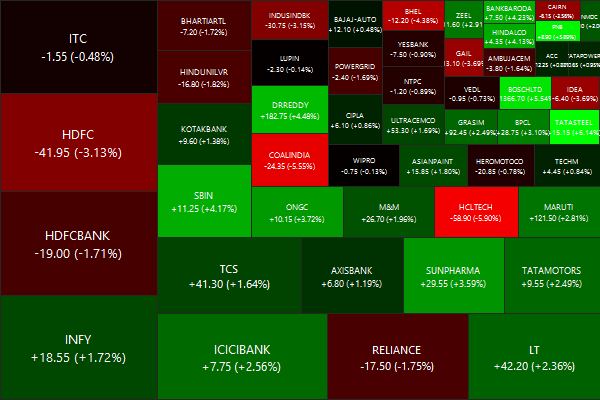
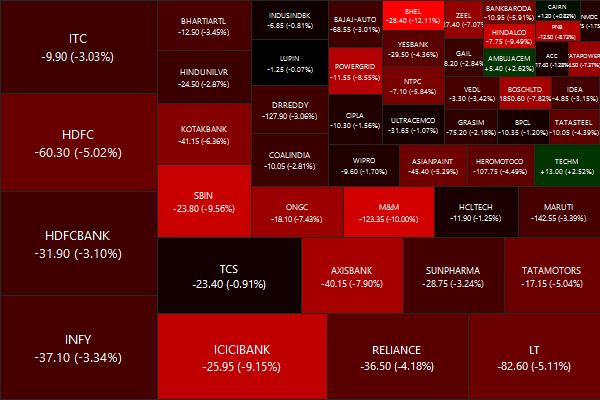
Nifty Heatmap
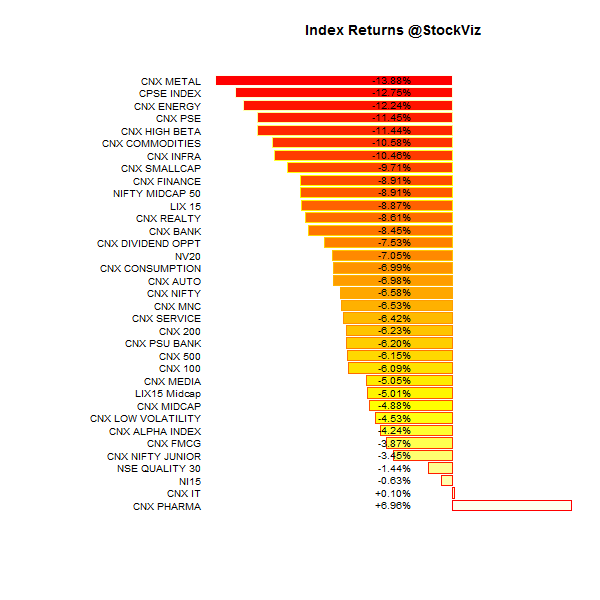
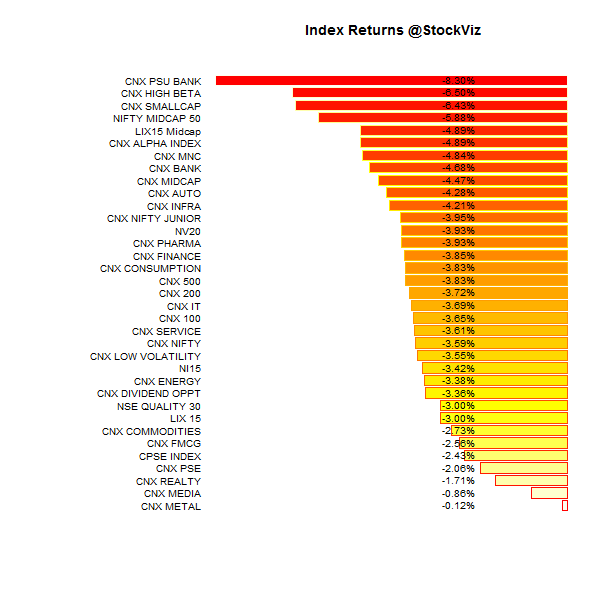
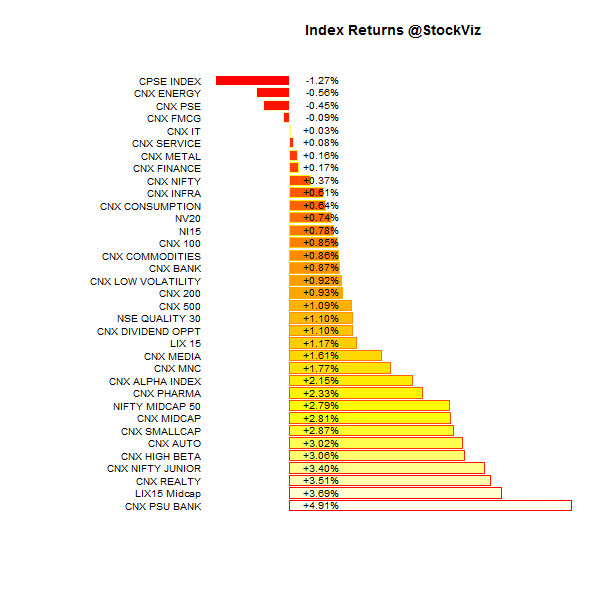
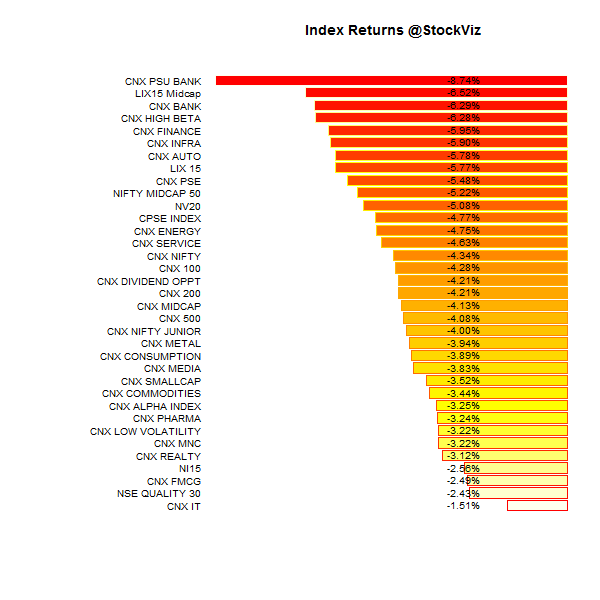
Index Returns
For a deeper dive into indices, check out our weekly Index Update.
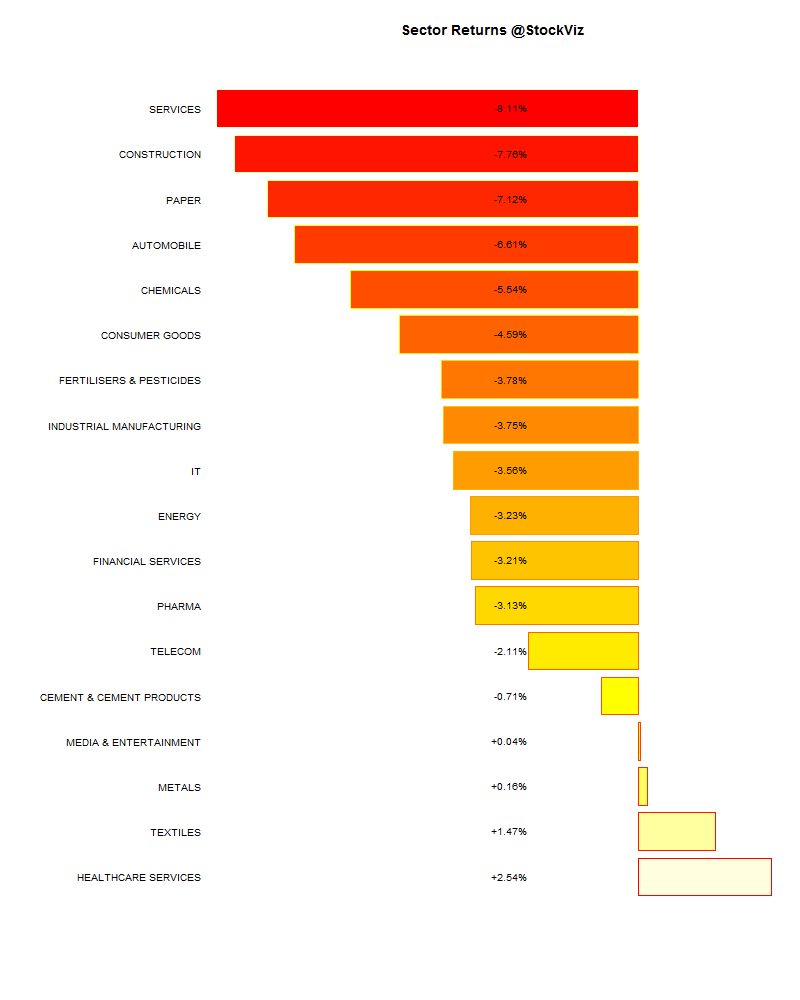
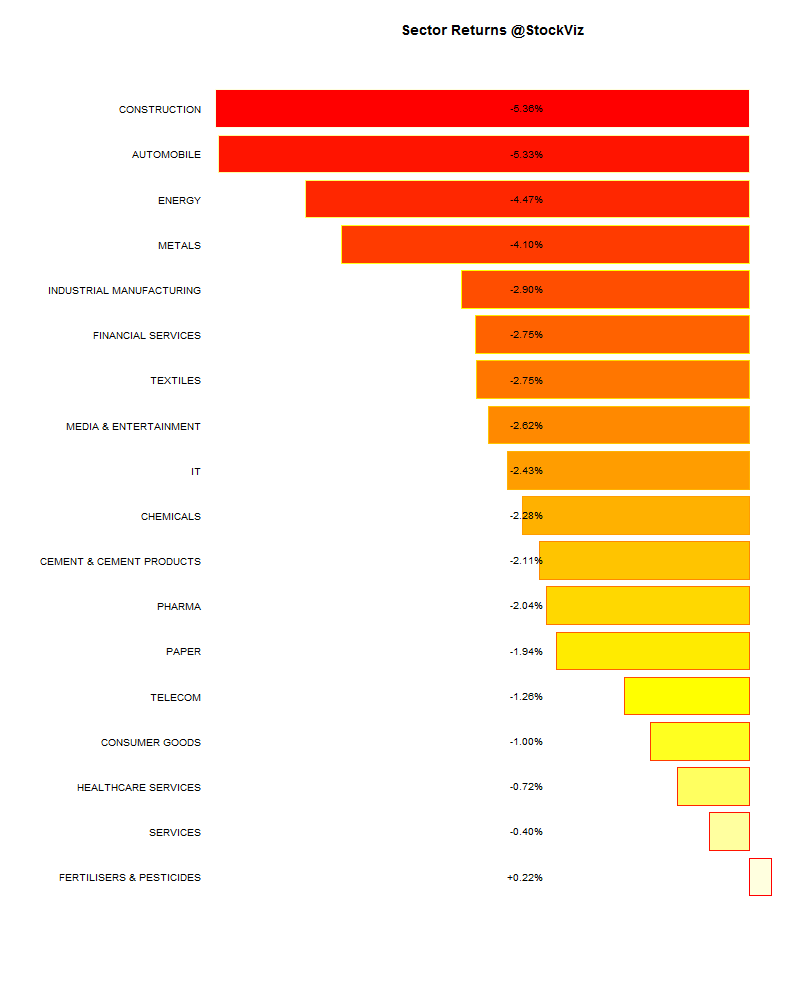
Sector Performance
Market Cap Decile Performance
| Decile | Mkt. Cap. | Adv/Decl |
|---|---|---|
| 1 (micro) | -3.55% | 74/61 |
| 2 | -3.57% | 65/69 |
| 3 | -1.10% | 68/66 |
| 4 | -1.12% | 70/65 |
| 5 | -1.60% | 65/69 |
| 6 | -1.91% | 65/69 |
| 7 | -1.03% | 63/72 |
| 8 | -0.72% | 69/65 |
| 9 | -0.28% | 70/64 |
| 10 (mega) | -1.63% | 68/67 |
Top Winners and Losers
| INFRATEL | +4.33% |
| RELCAPITAL | +4.48% |
| SRTRANSFIN | +4.74% |
| GLENMARK | -12.64% |
| BHEL | -12.11% |
| UNIONBANK | -10.37% |
ETF Performance
| GOLDBEES | -0.27% |
| JUNIORBEES | -2.75% |
| CPSEETF | -3.83% |
| NIFTYBEES | -4.04% |
| INFRABEES | -5.82% |
| BANKBEES | -5.93% |
| PSUBNKBEES | -9.29% |
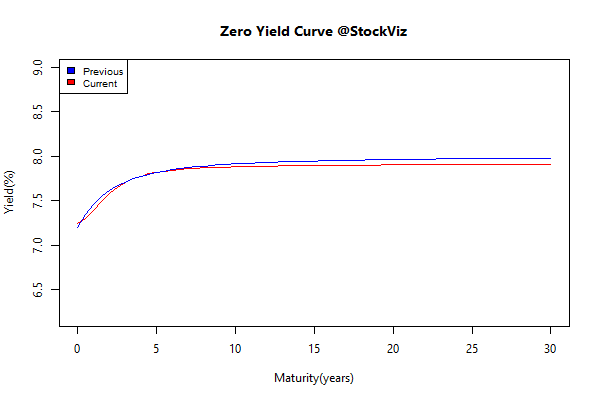
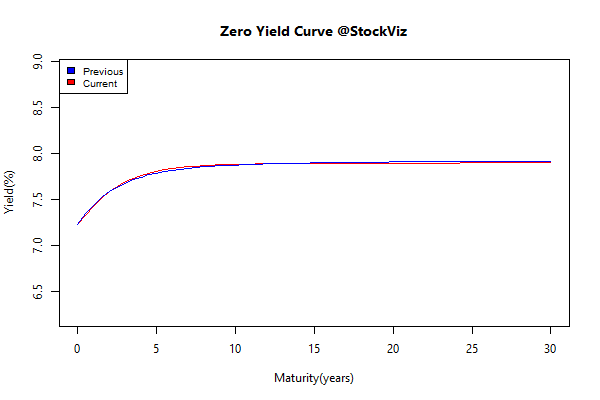
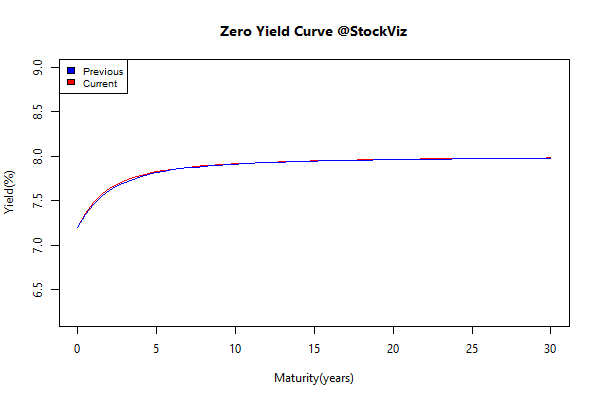
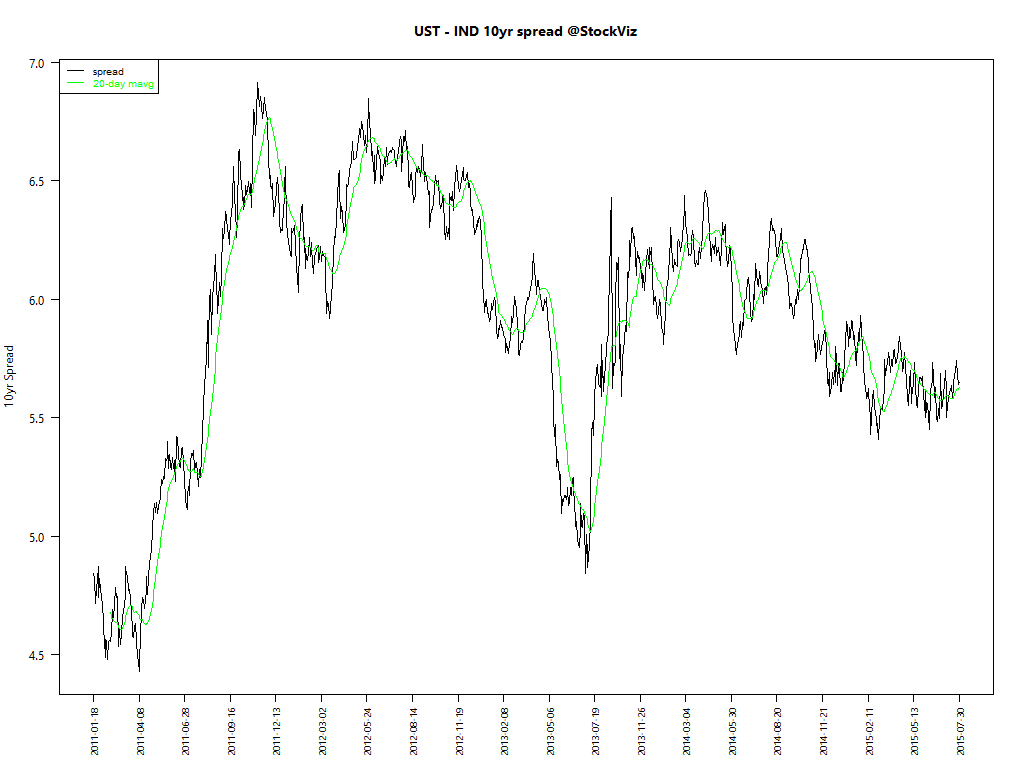
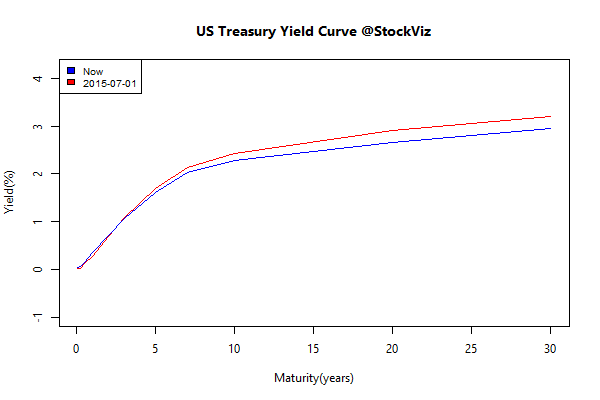
Yield Curve
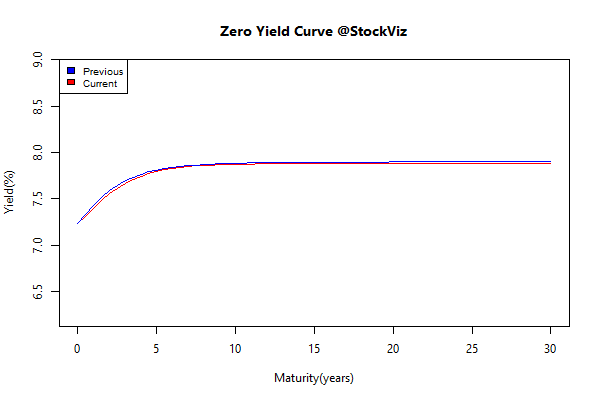
Bond Indices
| Sub Index | Change in YTM | Total Return(%) |
|---|---|---|
| 0 5 | -0.01 | +0.15% |
| 5 10 | -0.02 | +0.23% |
| 10 15 | +0.02 | +0.02% |
| 15 20 | -0.06 | +0.67% |
| 20 30 | -0.01 | +0.20% |
Investment Theme Performance
| ADAG stocks | -0.92% |
| Tactical CNX 100 | -1.99% |
| Balance Sheet Strength | -2.61% |
| ASK Life | -2.78% |
| PPFAS Long Term Value | -2.94% |
| The RBI Restricted List | -3.32% |
| Next Trillion | -3.68% |
| CNX 100 Enterprise Yield | -3.76% |
| Low Volatility | -3.97% |
| Magic Formula | -4.26% |
| Financial Strength Value | -5.05% |
| High Beta | -5.20% |
| Momentum | -5.33% |
| Quality to Price | -5.41% |
Equity Mutual Funds
Bond Mutual Funds
Thought for the weekend
For publicly listed companies, its owners are its shareholders. It is they who claim the profits of the company, potentially in perpetuity. It is they who exercise control rights over the management of the company from whom they are distinct. And it is they whose objectives have primacy in the running of the company.
Yet despite its durability and success, across countries and across time, this corporate model has not gone unquestioned. Recently, these questions have come thick and fast, with a rising tide of criticism of companies’ behaviour, from excessive executive remuneration, to unethical practices, to monopoly or oligopoly powers, to short-termism. These concerns appear to be both strongly-felt and widely-held.
So who owns them?