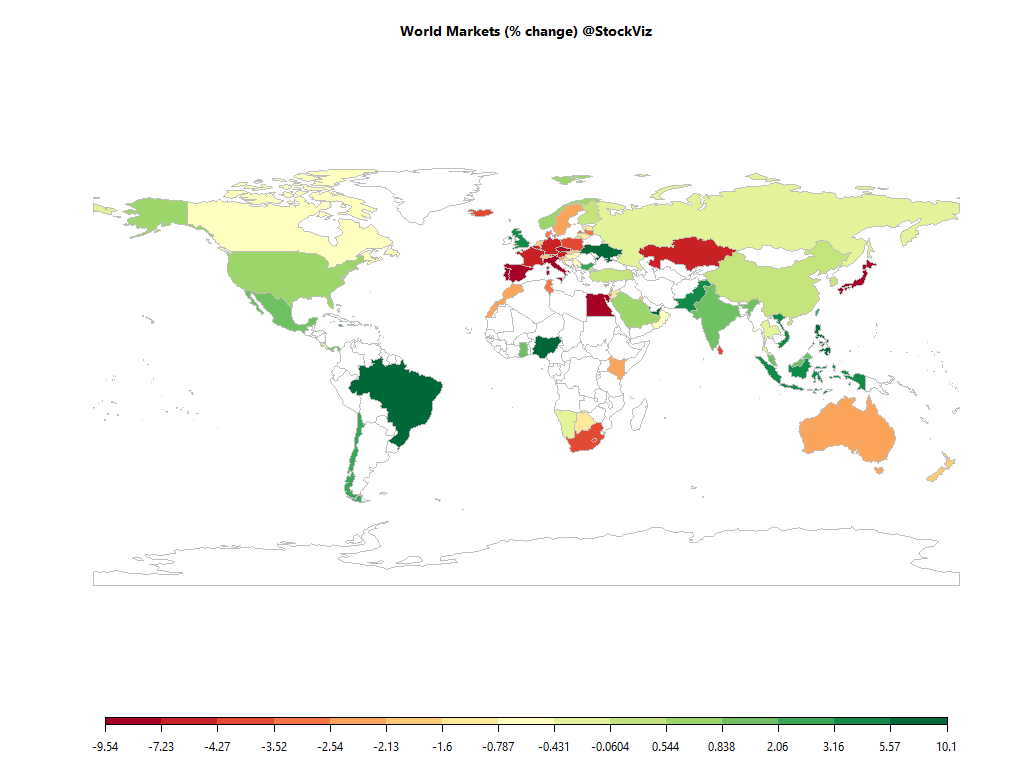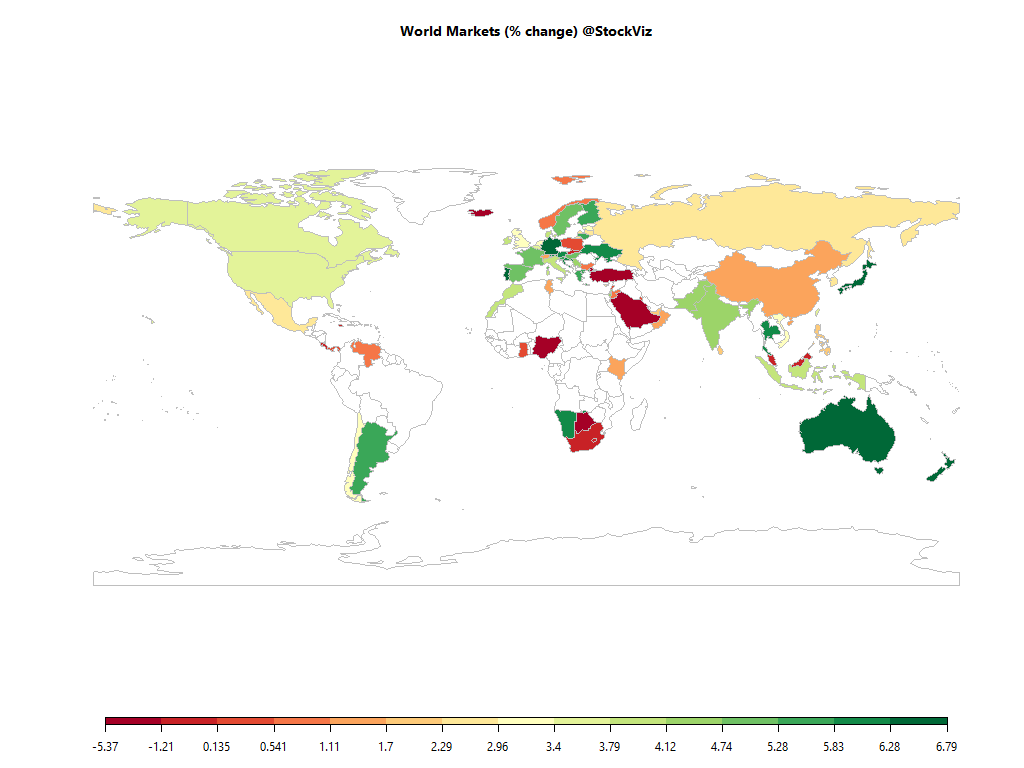
Equities
| MINTs | |
|---|---|
| JCI(IDN) | +3.97% |
| INMEX(MEX) | +2.86% |
| NGSEINDX(NGA) | -5.36% |
| XU030(TUR) | -2.19% |
| BRICS | |
|---|---|
| IBOV(BRA) | +11.06% |
| SHCOMP(CHN) | +1.70% |
| NIFTY(IND) | +4.23% |
| INDEXCF(RUS) | +2.83% |
| TOP40(ZAF) | -0.13% |
Commodities
| Energy | |
|---|---|
| RBOB Gasoline | -13.15% |
| Brent Crude Oil | -12.87% |
| Heating Oil | -12.58% |
| WTI Crude Oil | -16.00% |
| Ethanol | -12.08% |
| Natural Gas | -2.46% |
| Metals | |
|---|---|
| Platinum | +12.24% |
| Palladium | +18.96% |
| Copper | +1.83% |
| Gold 100oz | +2.68% |
| Silver 5000oz | +7.49% |
Currencies
| MINTs | |
|---|---|
| USDIDR(IDN) | -0.74% |
| USDMXN(MEX) | +2.62% |
| USDNGN(NGA) | +14.05% |
| USDTRY(TUR) | +3.74% |
| BRICS | |
|---|---|
| USDBRL(BRA) | +1.33% |
| USDCNY(CHN) | -0.20% |
| USDINR(IND) | -0.78% |
| USDRUB(RUS) | +3.20% |
| USDZAR(ZAF) | -5.90% |
| Agricultural | |
|---|---|
| Cocoa | -3.70% |
| Coffee (Arabica) | +1.36% |
| Coffee (Robusta) | +9.31% |
| Soybeans | -12.32% |
| Cattle | -5.67% |
| Lean Hogs | -16.43% |
| Lumber | +4.36% |
| Cotton | +17.31% |
| Feeder Cattle | -2.56% |
| Orange Juice | -1.21% |
| Soybean Meal | -13.91% |
| Corn | -7.81% |
| Sugar #11 | -6.04% |
| Wheat | -5.16% |
| White Sugar | -5.14% |
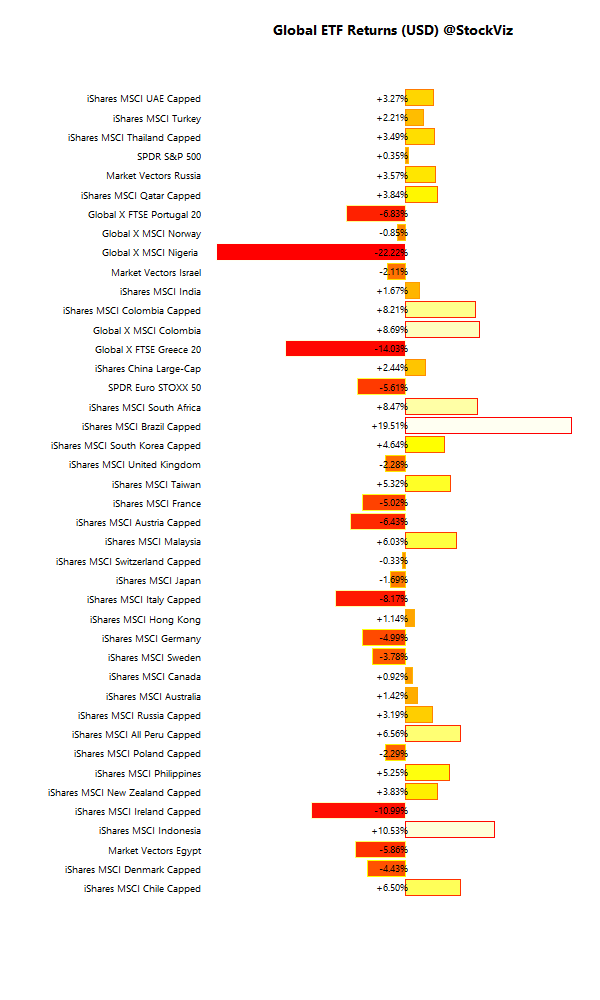
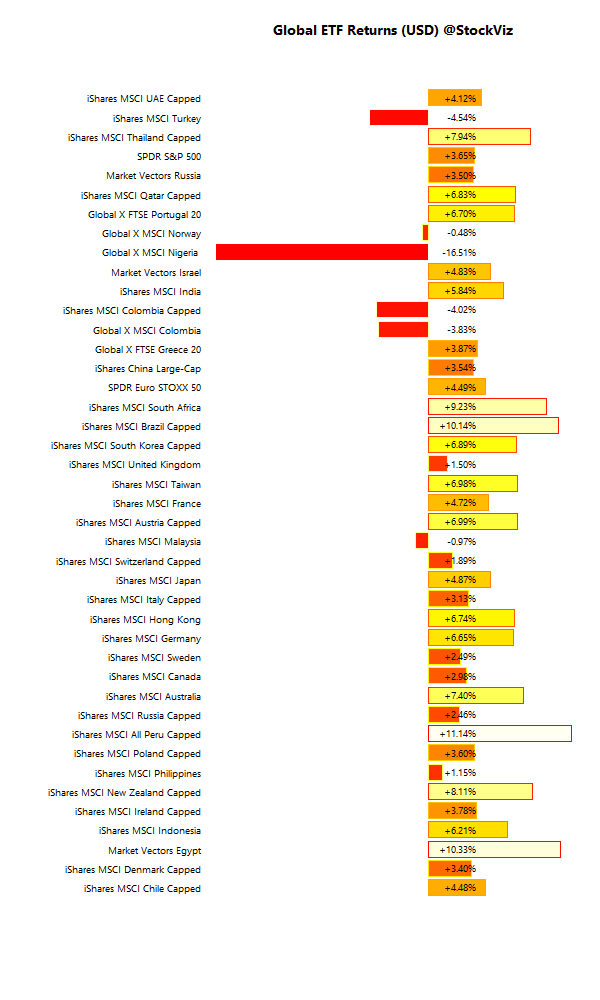
International ETFs (USD)
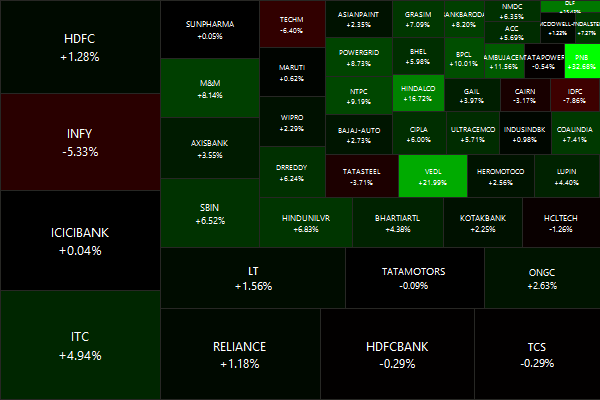
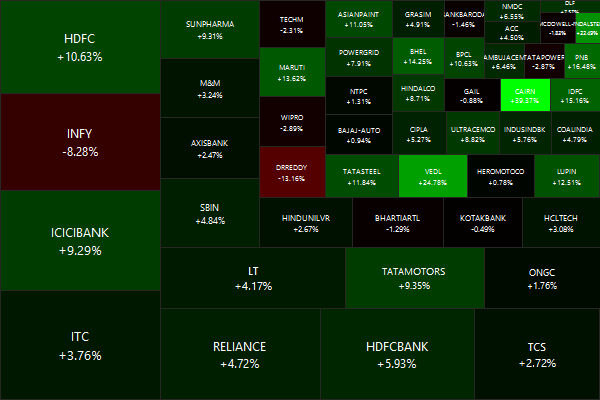
Nifty Heatmap
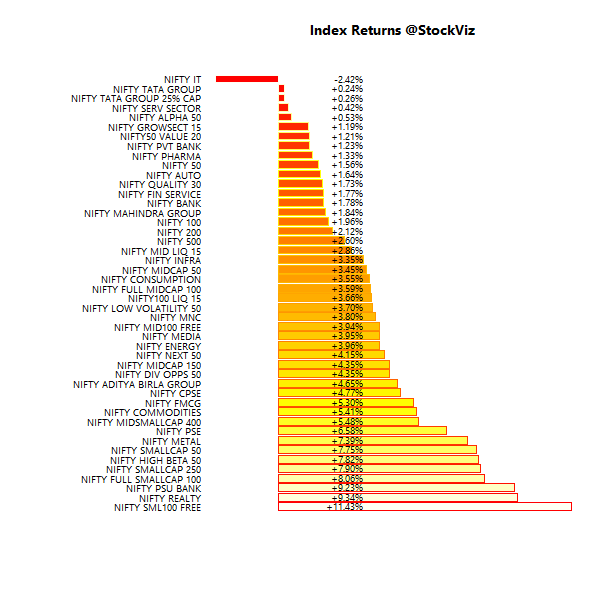
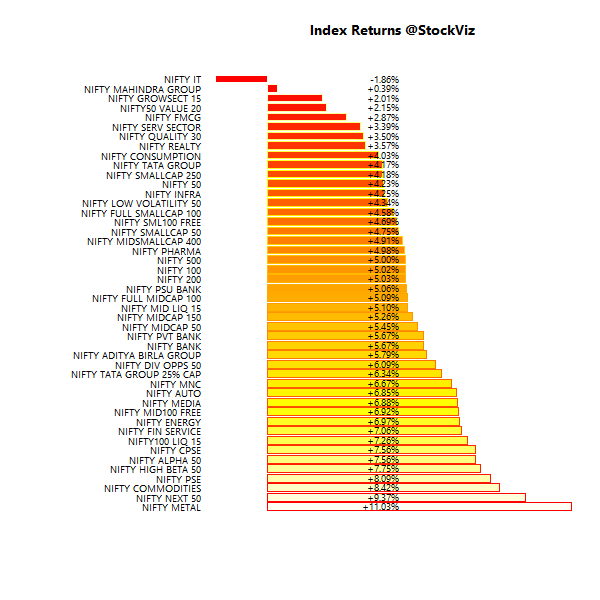
Index Returns
More: Sector Dashboard
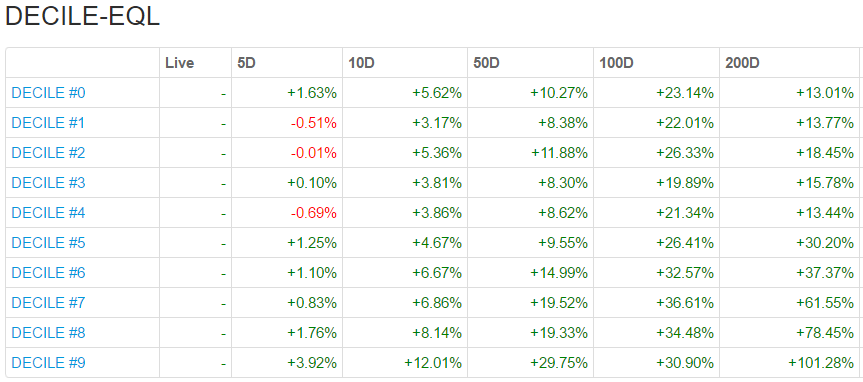
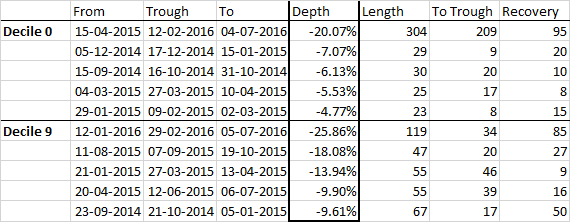
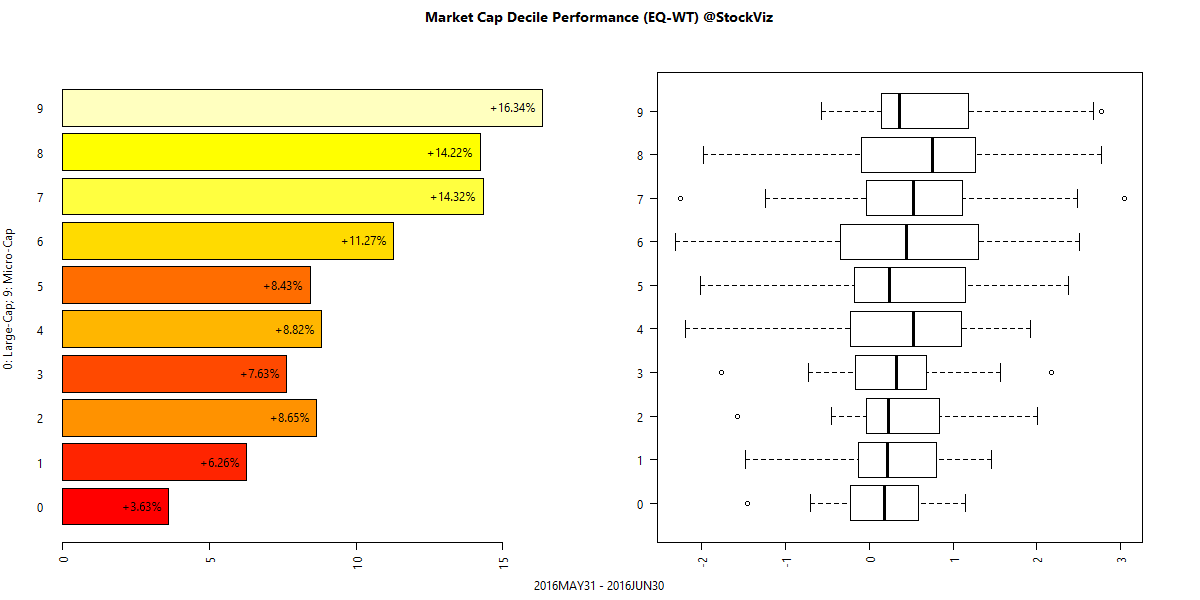
Market Cap Decile Performance
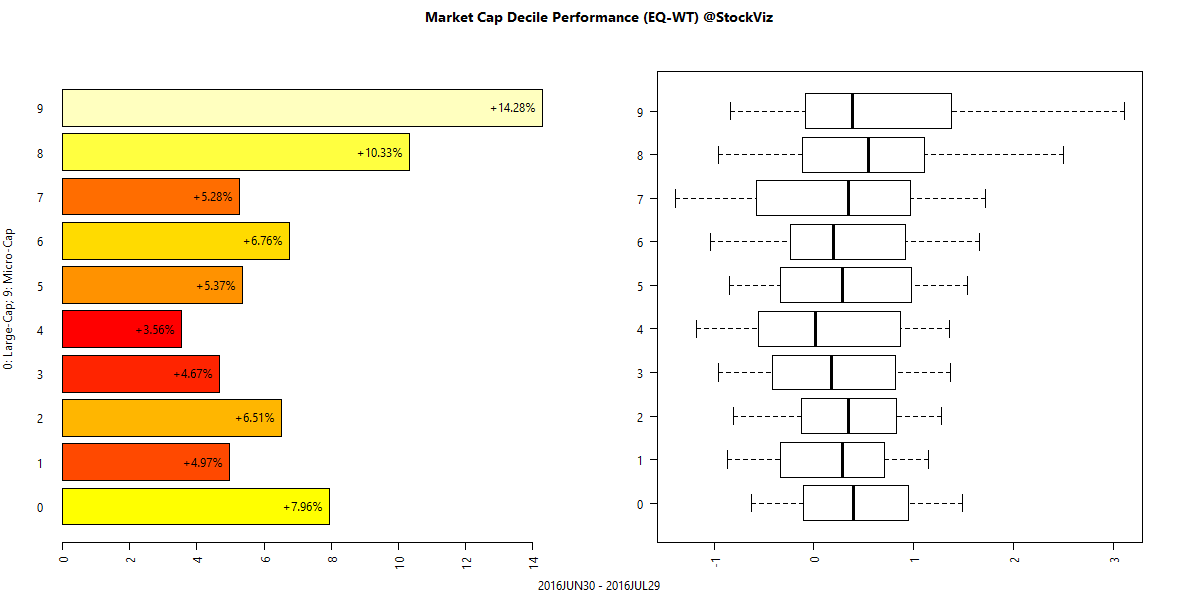
More: Equal-Weight Deciles, Cap-Weight Deciles
ETF Performance
| JUNIORBEES | +9.46% |
| CPSEETF | +7.74% |
| BANKBEES | +5.73% |
| PSUBNKBEES | +4.86% |
| NIFTYBEES | +4.54% |
| INFRABEES | +4.39% |
| GOLDBEES | +0.68% |
CPSE ETF found a bid? Is this a dash-for-trash rally?
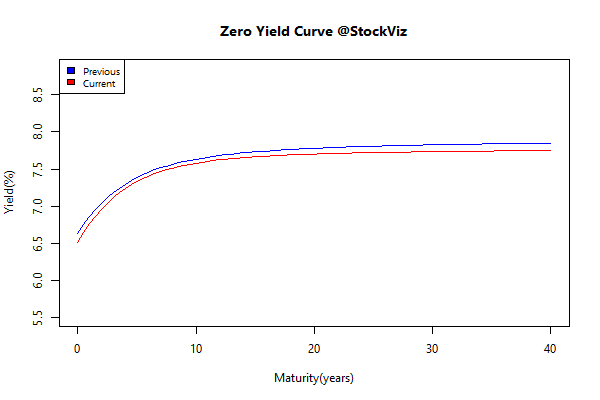
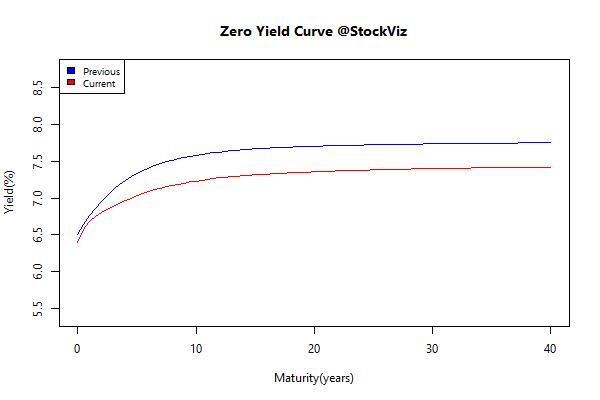
Yield Curve
Bond Indices
| Sub Index | Change in YTM | Total Return(%) |
|---|---|---|
| 0 5 | -0.24 | +1.35% |
| 5 10 | -0.35 | +2.45% |
| 10 15 | -0.33 | +3.04% |
| 15 20 | -0.34 | +3.71% |
| 20 30 | -0.34 | +4.59% |
The biggest story of this year is long-term bonds returning 4.5% in a month!
Investment Theme Performance
| Acceleration | +11.69% |
| High Alpha | +8.09% |
| High Beta | +7.82% |
| Tactical CNX 100 | +7.01% |
| Quality to Price | +6.99% |
| Momo (Relative) v1.1 | +6.23% |
| High Sharpe | +5.43% |
| Momentum | +5.26% |
| Enterprise Yield | +4.74% |
| Velocity | +3.86% |
| Magic Formula | +3.77% |
| HighIR Momentum | +3.52% |
| Low Beta | +3.32% |
| Low Volatility | +3.27% |
| Financial Strength Value | +2.65% |
| Balance Sheet Strength | +0.91% |
Will automated (momo) momentum strategies outperform their hand-crafted cousins? Interesting days ahead…
Equity Mutual Funds
Bond Mutual Funds
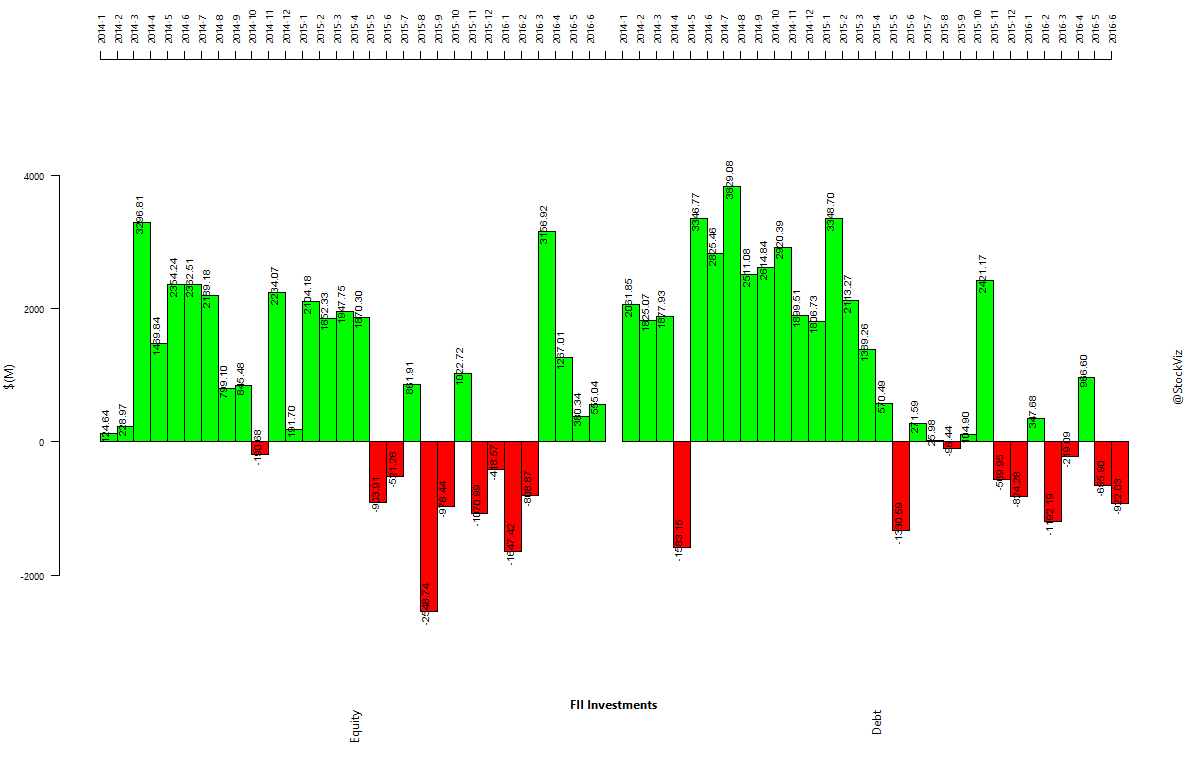
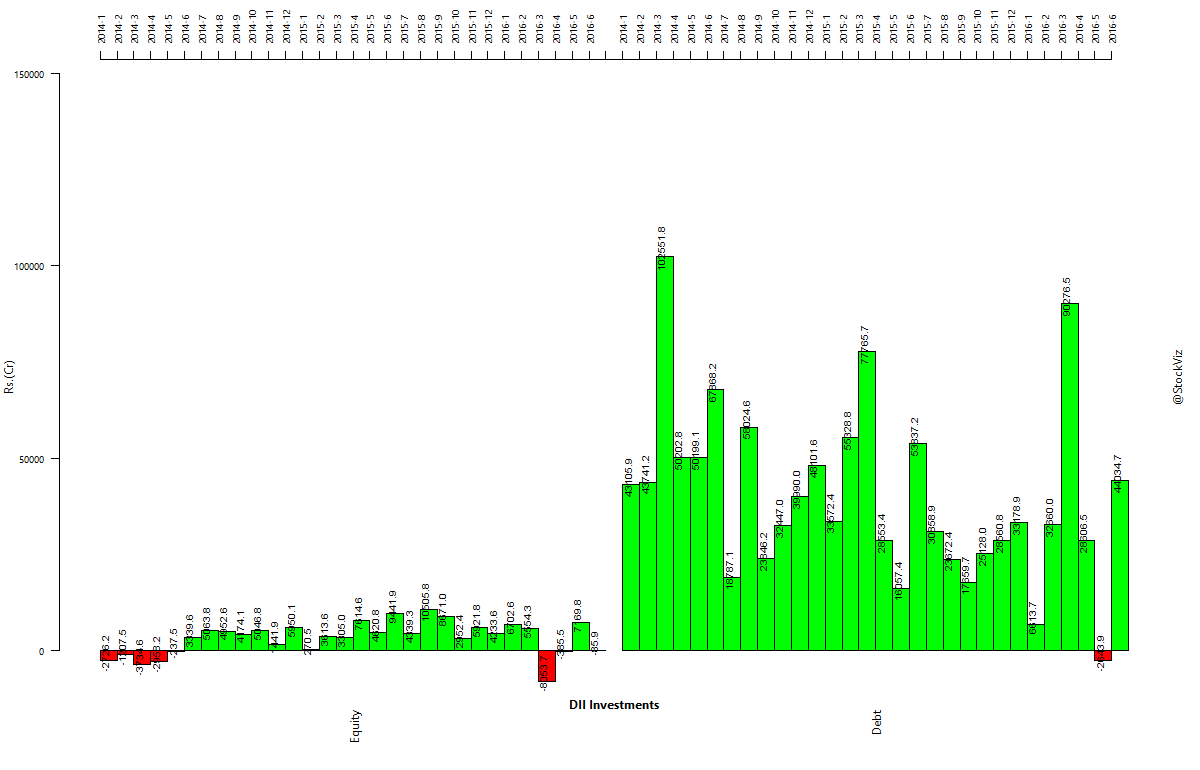
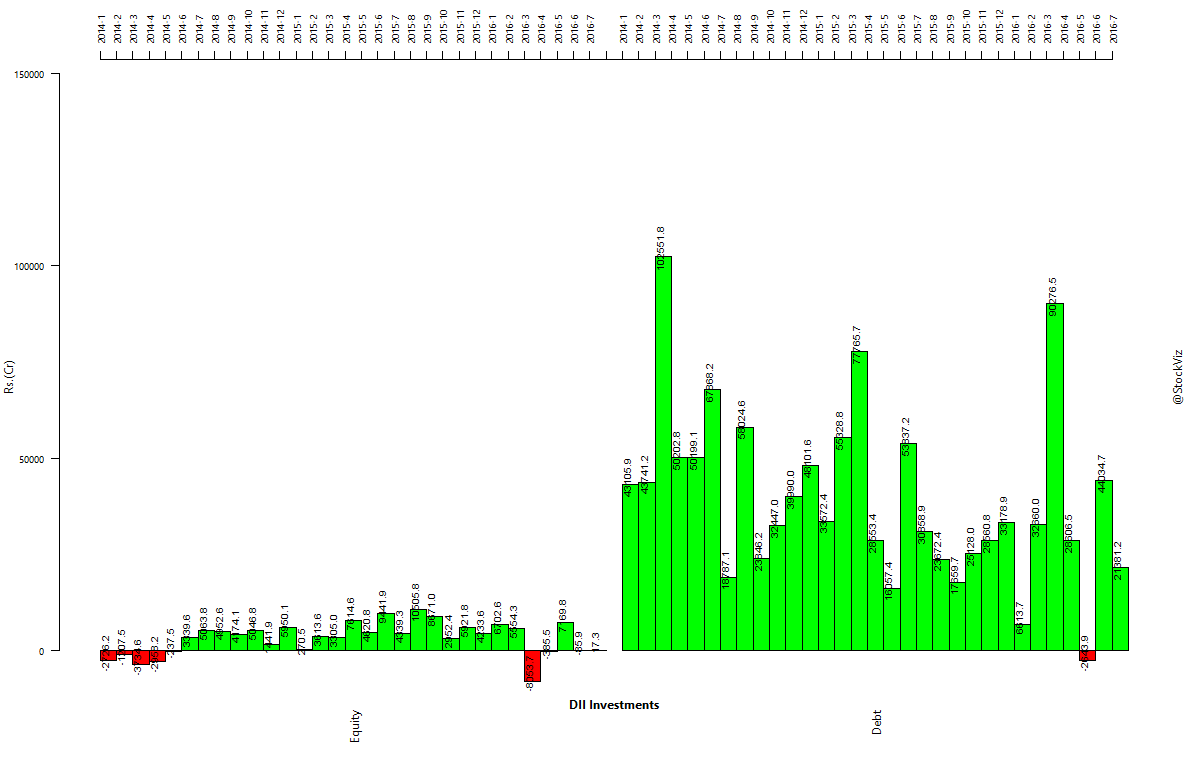
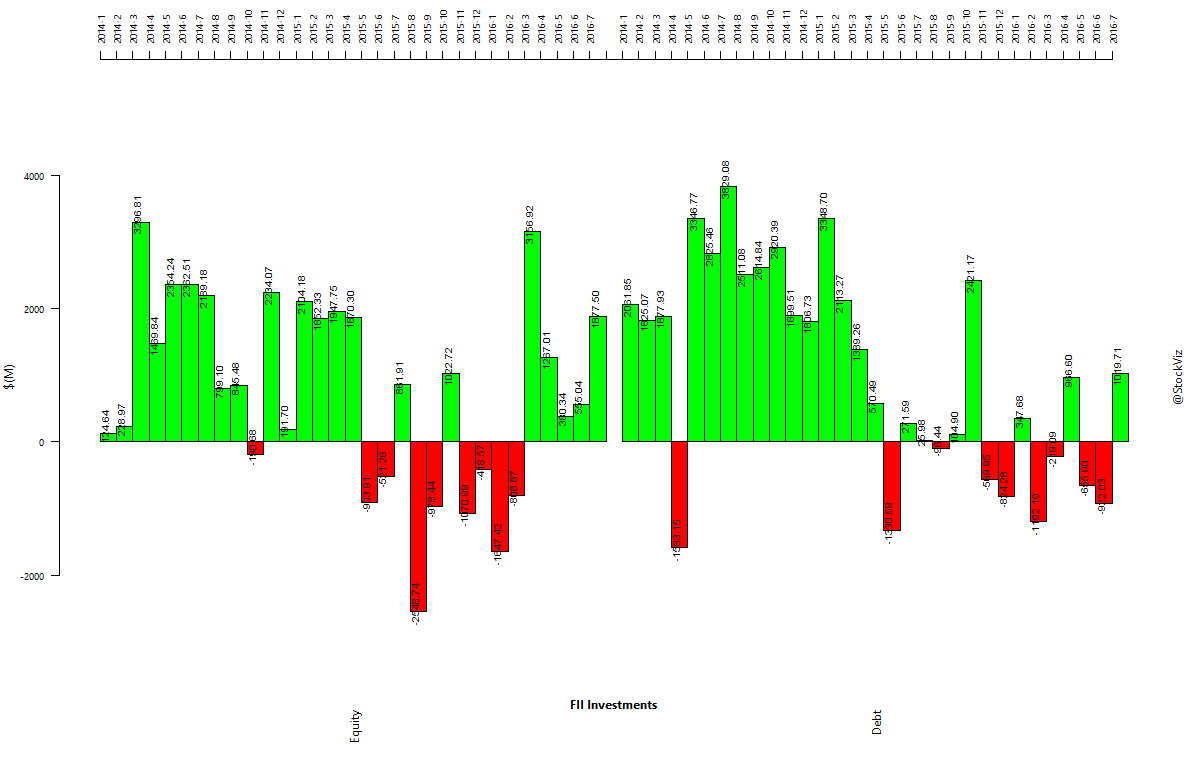
Institutional Flows
Bond inflows nowhere close to what occurred in March…
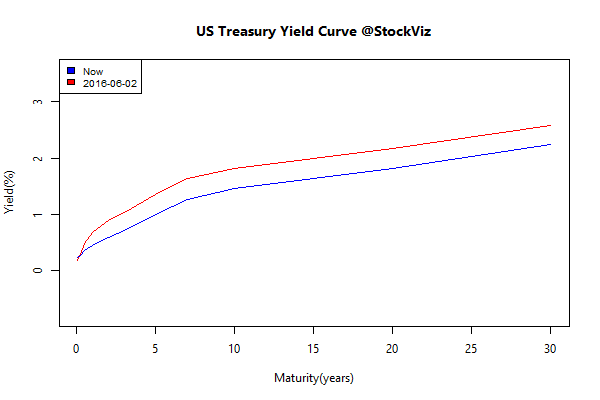
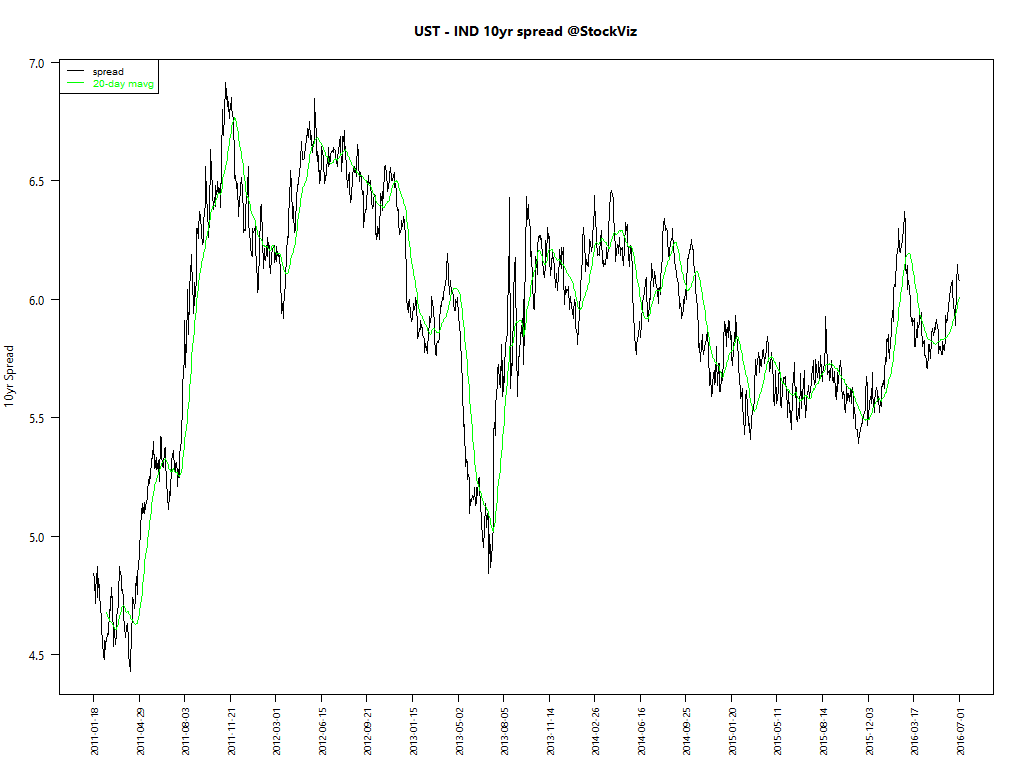
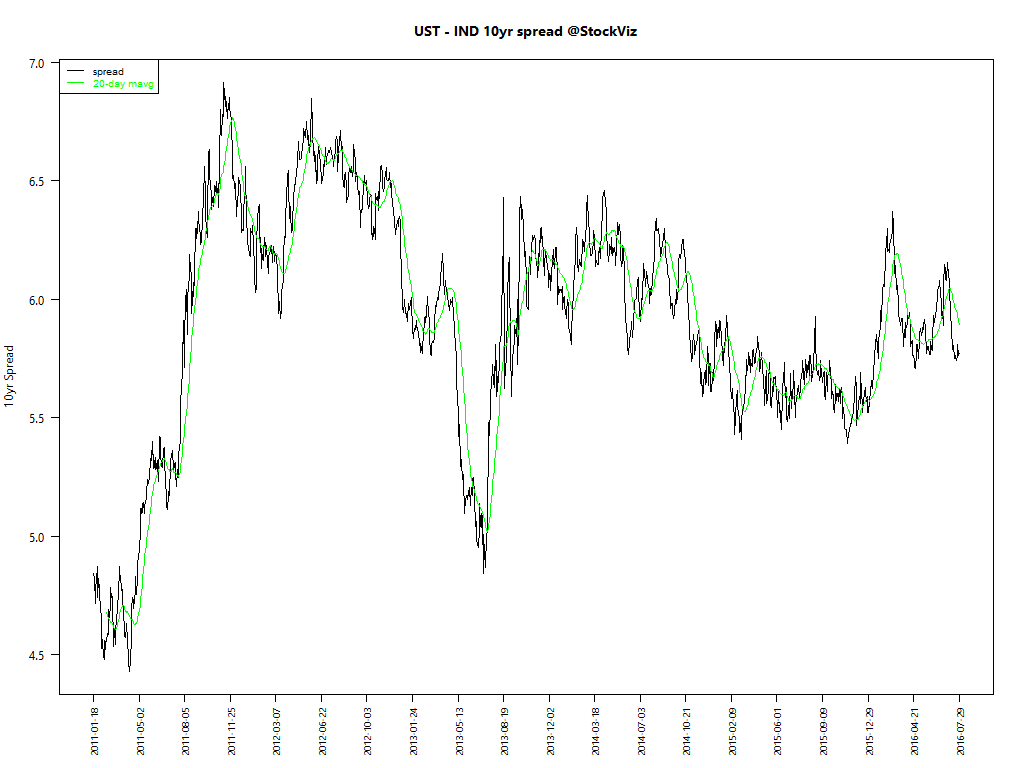
US Treasuries vs. Indian Gilts
More room for Indian Gilts to rally?
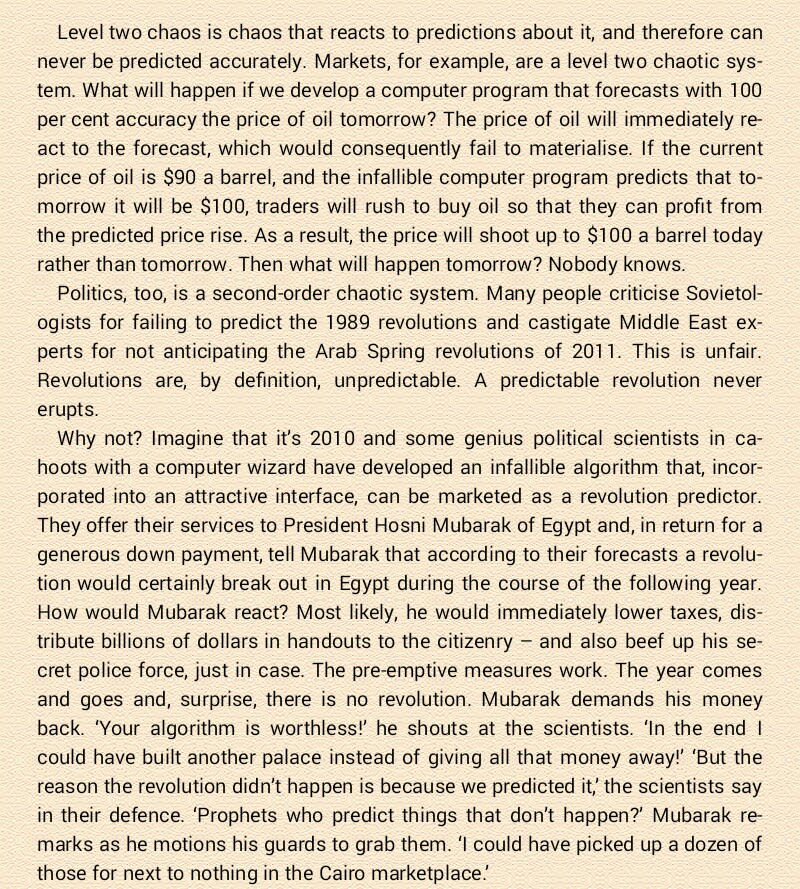
Book of the month
Sapiens: A Brief History of Humankind (Amazon)