Price vs. Total Return indices
Investors often use the NIFTY 50 index as a benchmark while comparing investments. It is probably fair if you are making price comparisons. However, investment vehicles like mutual funds reinvest the dividends that they get on their holdings. So a more appropriate benchmark there is the NIFTY Total Return (NIFTY 50 TR) index.
The NIFTY 50 TR index is an index with the same constituents as the NIFTY 50 but with dividends reinvested back into the index.
![]()
The Dividend Impact on Returns
To give you an idea of how dividends impact long-term returns, here’s a cumulative wealth chart of the NIFTY 50 TR Index vs. the Nifty 50 (Price) Index:
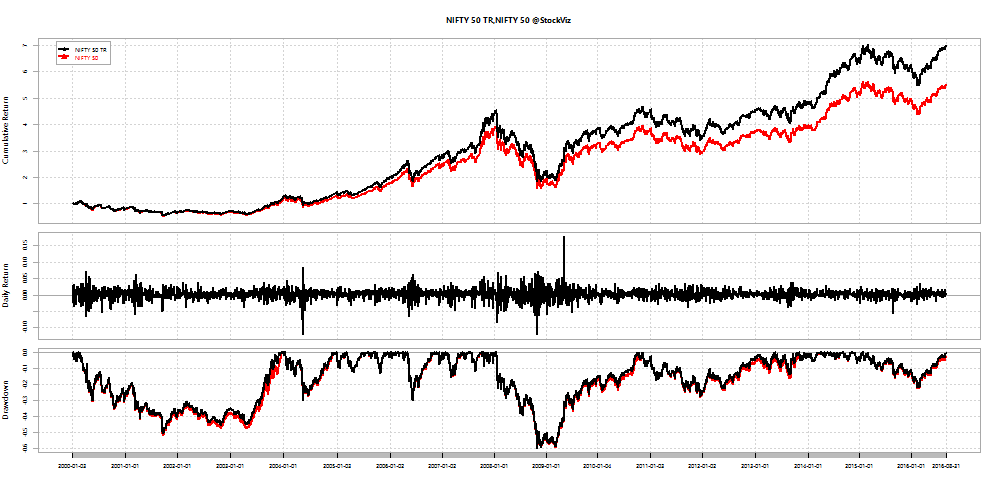
From the beginning of the year 2000 through to the end of August-2016, the Total Return was roughly 6x while the Price return was 4.5x. Here is how dividend reinvestment has boosted returns through the years:
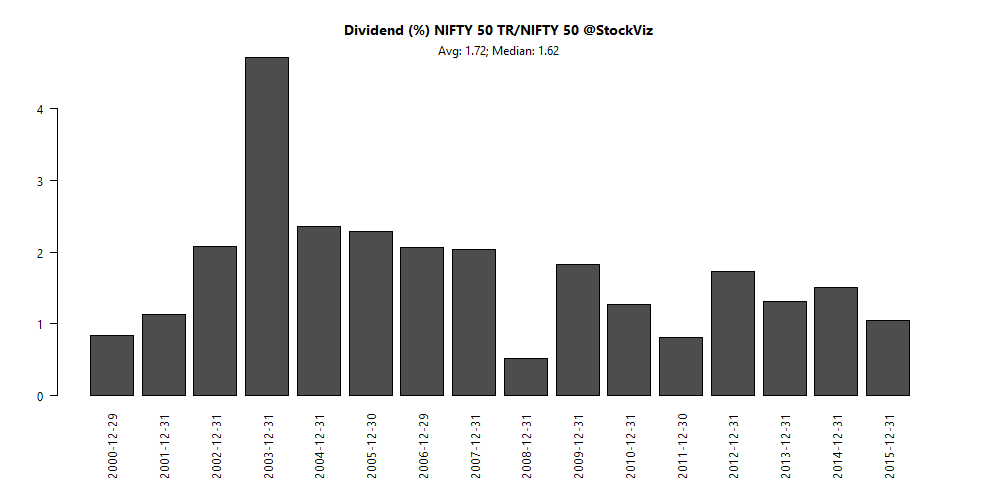
A 1.6% dividend boost sounds trivial until you look at the cumulative effect of it over the years.
Should benchmarks be handicapped?
When you see mutual fund returns compared with “price” indices (all NIFTY indices are price indices unless they are explicitly mentioned to be total return,) you should handicap those returns by ~1.5-2% every year to get an idea of whether the fund actually outperformed the index.
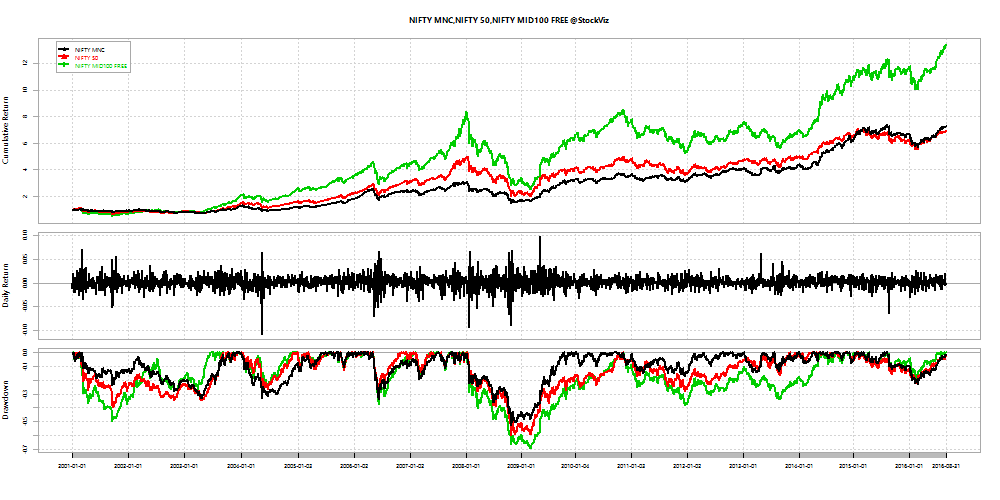
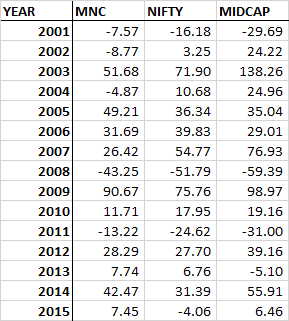
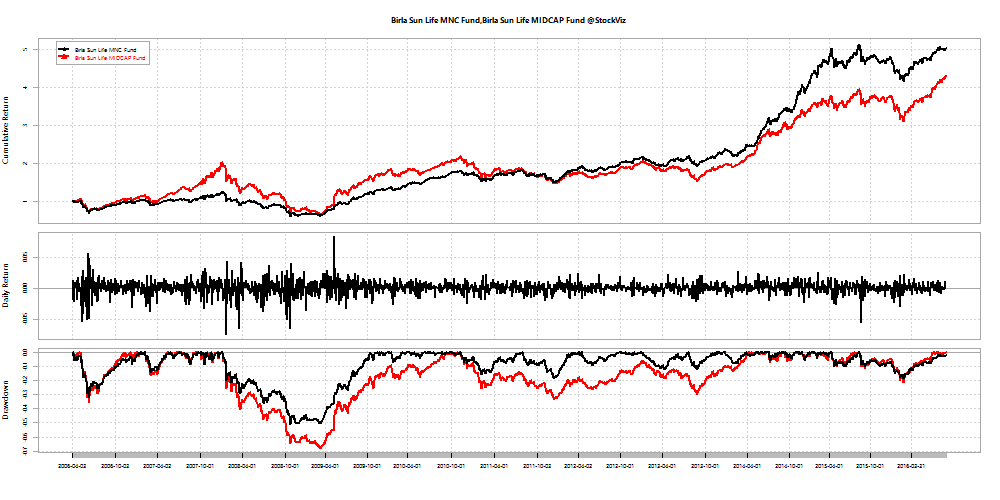
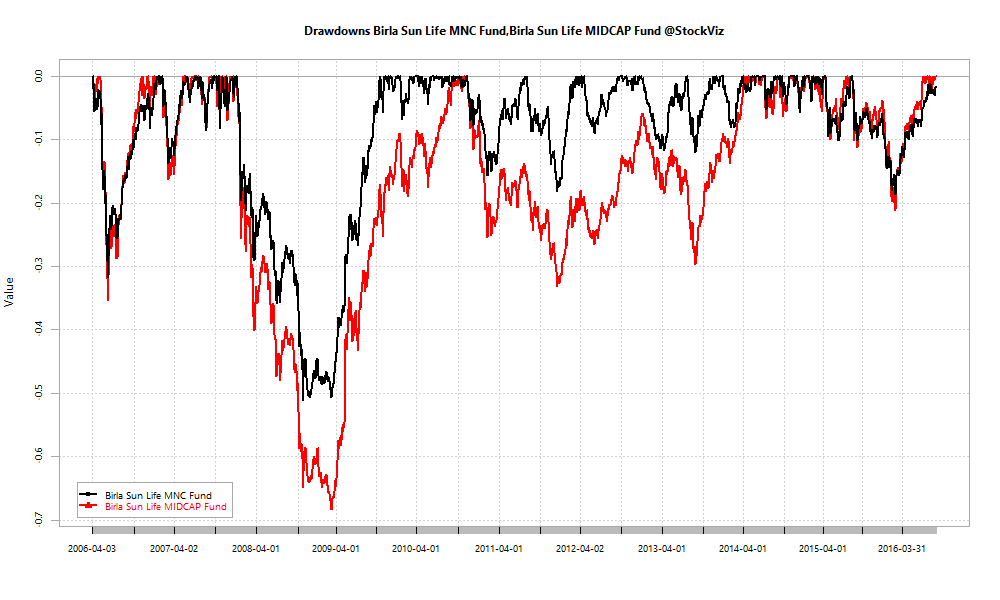
It is tragic that the NSE has maintained a total return index only for the NIFTY 50. With the rising popularity of other asset classes and strategies, it makes sense to provide a Total Return index for every Price index that they publish. We briefly touched upon this while we looked at the MNC asset class. The NIFTY MNC Index, being a price index, missed a lot of performance information. We had to compare an MNC Fund to another Midcap Fund to get a better idea of relative performance. (Read the whole thing here: The MNC Fund Gravy Train, Part II)
Code for the above charts are on Github