Did T2 kill NIFTY 50 ETFs and Index funds?
Instead of looking at NIFTY 50 ETFs or index funds, why not invest in NPS Tier II Class ‘E’? Unfortunate nomenclature aside, it is hard to beat the 0.01% management fee and the flat Rs. 190/- annual account maintenance fee. Compare that to how much you would pay if you go through:
- broker: brokerage + STT + stamp duty + SEBI turnover fee + service tax.
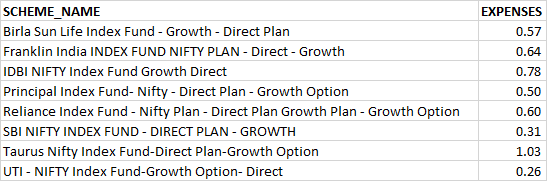
- direct through AMC: expense ratios between 0.26% and 1.03% (!)
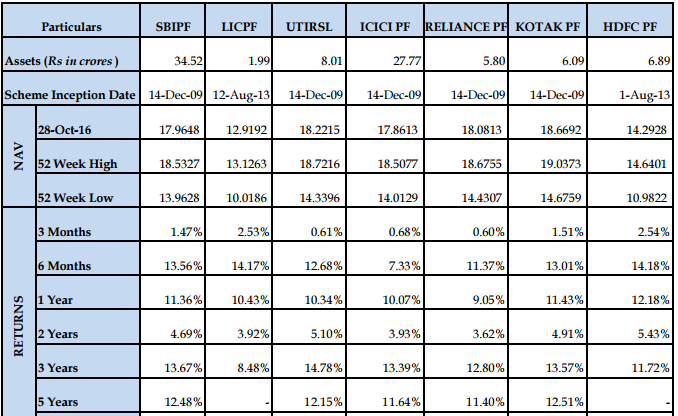
As of 28th October 2016, 5-year returns across different pension fund managers are between 12.5% and 11.4%. A rough comparison with Birla Sun Life’s Index Direct Fund points to a 10.10% return over the same time-frame. Directly attributable to the lower fee structure of NPS.
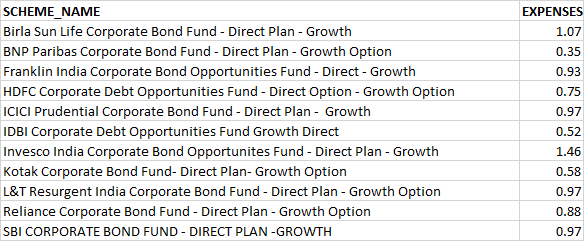
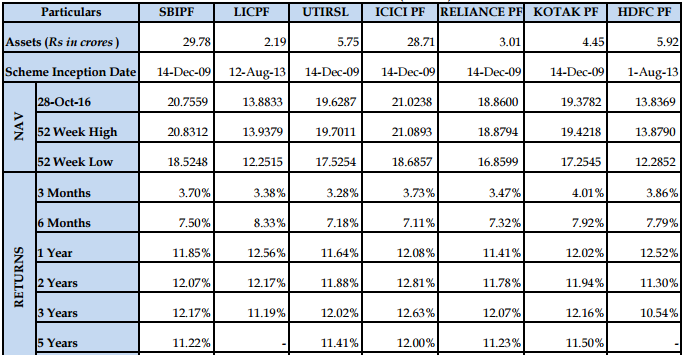
The same treatment extends to corporate and government bond funds (Class ‘C’ and Class ‘G’, respectively) as well. Class ‘C’ 5-year returns have been between 11.2% and 12%. Birla Sun Life Corporate Bond Fund (direct) points to a 11% return over the same time-frame. Direct plan expense ratios for corporate bond funds are around 1%. What exactly are you getting for paying 100x more than through NPS?
If you are a Boglehead saving for retirement, you will love the ‘Auto’ feature (Class ‘A’) that automatically shifts the asset allocation from Equity to Debt as you near retirement. All for 0.01%.
If low fees and index investing is all that you care about, then NPS Tier I (tax efficient but with an annuity requirement at the end) and Tier II (just like any other investment ‘folio’) is something you should seriously consider.
Appendix
NPS charges (FAQ)
NPS SCHEME – E (Tier-II) performance (source)
NPS SCHEME – C (Tier-II) performance
Expense ratios of index fund (direct plans)
Expense ratios of corporate bond funds (direct plans)