Category: Your Money

Gold trumps stocks for third Diwali in row

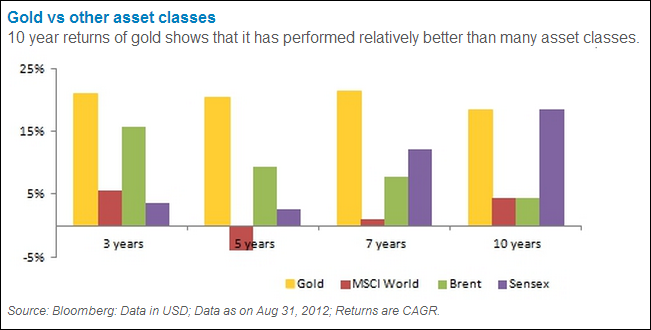
The yellow metal is on course to record sparkling returns for third year in row despite a strong year for equities.

While investors in gold have reaped over 15% returns since last Diwali, the returns from Sensex has been a fixed deposit-like gain of about 8.5 % for the same period.

While the precious metal has risen from Rs 26,700 levels last Diwali to Rs 30,700 currently, the BSE benchmark Sensex has risen from near-17,300 levels to 18,755 since last Diwali. Gold prices have also more than tripled from Rs 10,000 levels to Rs 31,000 in the last five years. India is the largest consumer of gold with an annual demand of about 700 tonnes.

clip_image001

The fact that gold jewelry and investment demand remains robust despite the rising prices is a reflection of the inherent desire among Indians to hold gold driven mainly by its alluring appeal as a jewelry and as a safe-haven against inflation that erodes both savings and income.

The impact of the European sovereign debt crisis, inflationary pressures and the still-shaky outlook for economic growth in developed countries is driving high levels of investment demand for the precious metal.

clip_image002

From gold coins, gold jewelry to MFs and ETFs, robust consumer appetite in gold’s cultural heartlands, India and China, has seen global prices rise from $270 an ounce in 2001to more than $1700 an ounce as on November this year. India, the world’s largest gold consumer and China account for over 55% of global gold jewelry demand and 52% gold investment demand.

Gold is being seen as a safest hedge against credit risk, currency risk and inflation that has besieged the financial world in the last decade. With the financial world navigating from one hurdle to another like the mortgage crisis to the banking crisis to the current sovereign debt crisis, investors have sought refuge under gold to protect their wealth.

clip_image002[7]

Apart from sluggish growth in stock markets and high inflation rates, a spurt in central banks gold buying since 2009 after being net seller for over two decades has also contributed significantly to demand and thereby prices.

Off late, gold ETF investments are gaining ground at a rapid pace and are increasingly emerging as preferred route for long term investment in gold.

Technical Analysis

Despite the Finance Ministry’s measures to discourage investments in gold, assets under management of gold ETFs crossed the Rs 11,000 crore mark in September this year from Rs 10,701 crore in August and Rs 5,000 cr in May 2011, reflecting the robust appetite for the yellow metal.

Even as jewelry demand has been declining due to the volatile prices, a reflection of the price-sensitive nature of this segment, the rush for gold ETFs has meant that AUMs have soared from Rs 138 crore in April 2007 to Rs 11,198 crore in September, 2012 — over 80 times in 5 years.

With Diwali and Dhanteras round the corner, festive flavor is expected to add more color to the yellow metal and garner greater portfolio share of investors.

Enhanced by Zemanta

[stockquote]GOLDBEES[/stockquote]

Analysis: KTKBANK

Today’s pick is [stockquote]KTKBANK[/stockquote]. The last year saw the stock trading in a 60 to 140 range and the stock is in an up-trend since its Jan lows; The stock just saw 52-week highs at 140 levels. In the last three month period, the stock is up 42% vs. the Nifty’s 8%. 

image

Oscillators RSI and CMO are currently at 69 and 36 and are close to the over-bought territory.

MACD line and the signal line are moving very close to each other and the histogram levels are steady – signaling a short-term consolidation in progress.

The GMMA chart shows both long-term and short-term lines fanning out. This is an extremely bullish signal for the stock.

image

KTKBANK’s average correlation of 0.6 with the Nifty is positive and strong. The stock will replicate the movements of Nifty closely. [stockquote]NIFTYBEES[/stockquote]

image

KTKBANK had a historical volatility in the range of 0.4 to 0.8 till Sep 12, after which we see a rise in the volatility. This high volatility asks for a cautious outlook for the stock.

Looking at these technicals a short-term hold is suggested. Although, the spreading GMMA lines are giving a strong long-term buy signal for the stock.

Enhanced by Zemanta

Analysis: DRREDDY (RDY)

Today’s pick is [stockquote]DRREDDY[/stockquote]. The last year saw the stock trading in a 1500 to 1800 range and the stock is in an up-trend since July lows. In the last three month period, the stock was up 5.5% vs. the Nifty’s 8.3%. The stock is approaching 52-week resistance at 1815 levels, after bouncing off the support at 1500 levels.

image

Oscillators RSI and CMO are at currently at 64 and 39 and are closing in towards the over-bought territory.

MACD line and the signal line are departing from each other on a positive note; the histogram levels are rising as well in-sync with the short-term up-trend.

The GMMA chart shows both long-term and short-term lines fanning out. If this continues, it would be extremely bullish for the stock.

image

DRREDDY’s average correlation of 0.33 with the Nifty is positive. The stock will not replicate the movements of Nifty closely because of the low co-efficient. [stockquote]NIFTYBEES[/stockquote]

image

DRREDDY has a historical volatility in the range of 0.25 to 0.45 which is a very narrow range. The scrip’s volatility is currently in the middle range and hence should not be a concern.

image

Analysts already have high expectations regarding this stock, as is evident from the very high proportion of the buy and outperform calls. A single earnings miss from the firm, or an analyst downgrade might trigger a steep slide in the stock.  Also, insiders have sold about Rs. 3.5 Cr. worth of NCD’s in the last one month period.

Looking at these technicals a short-term hold is suggested. A break-out/continued resistance at the 1800 levels will be essential to direct the stock either to an up-trend/down-trend.

Enhanced by Zemanta

Weekly Recap

NIFTY.2012-10-29.2012-11-2

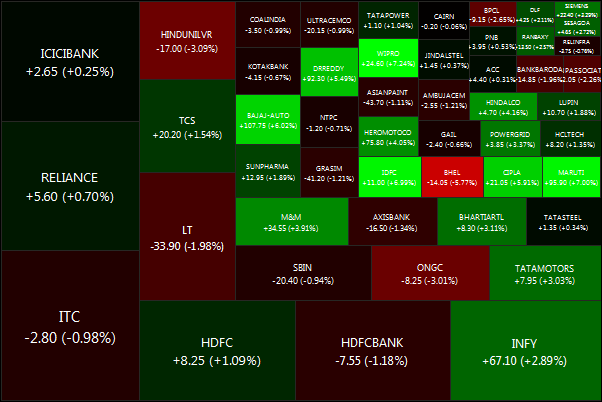
The NIFTY ended on a positive note, drifting up +0.82% for the week.
Biggest losers were BHEL (-5.36%), HINDUNILVR (-3.48%) and BPCL (-3.43%).
And the biggest winners were WIPRO (+8.50%), MARUTI (+7.34%) and IDFC (+6.62%).
Advancers lead decliners 29 vs 21
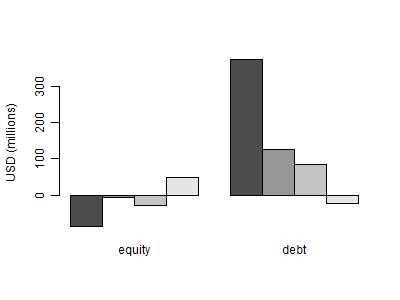
fii.2012-10-29.2012-11-2Gold: -0.02%, Banks: -0.70%. Infrastructure: -3.77%,
Net FII flows for the week: $69.63 mm (Equity) and $561.84 mm (Debt)
Net domestic institutional flows for the week: $35.50 mm (Equity) and $1,425.20 mm (Debt)
Daily news summaries are here.

Analysis: WIPRO

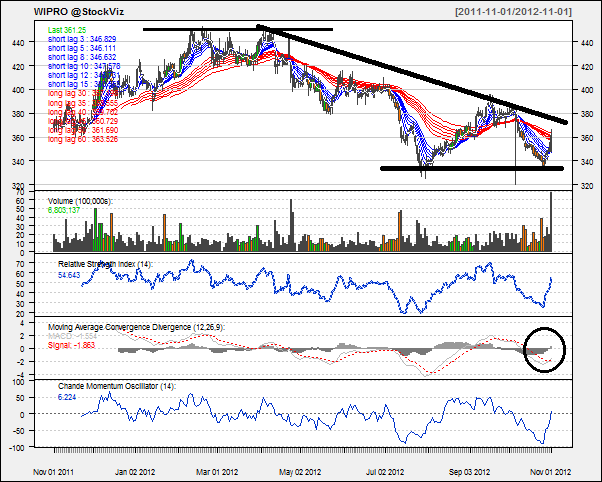
Today’s pick is [stockquote]WIPRO[/stockquote]. The last year saw the stock trading in a 330 to 450 range and the stock just tested the support levels around 52 week lows. In the past 50 days the stock made return of 3.8% as against 6.2% made by Nifty.

The stock has been in a down-trend since April this year, with a support near the 335 levels and resistance around 450.

image

Oscillators RSI and CMO are at currently at 54 and 6 and are hovering in the no man’s land.

MACD line just crossed the signal line and is on a rise; the histogram levels are rising as well suggesting short-term up-trend.

The GMMA chart is not suggesting any directional move as of now. The short-term lines are constricting and long-term lines are spreading. When the lines fan out, we will be able to take a stand on the direction. image

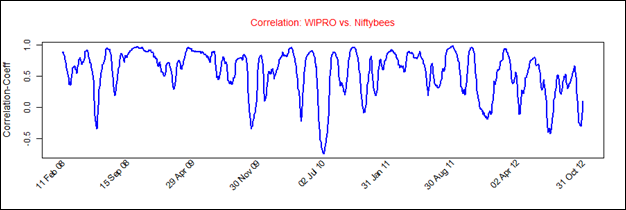
WIPRO’s average correlation of 0.56 with the Nifty is positive and strong. The stock will not replicate the movements of Nifty closely. [stockquote]NIFTYBEES[/stockquote]

image

WIPRO has a historical volatility in the range of 0.3 to 0.7. The scrip’s volatility is currently in the middle range and hence should not be a concern to the traders.

Looking at these technicals a short-term buy is suggested. For the long-term outlook of the scrip we will have to wait for GMMA lines to give some direction.