What is Relative Strength Spread?
Relative Strength Spread of a stock is the relative cumulative performance of the stock vs. the CNX 500 index over the same period.
We had discussed how the Relative Strength Spread Index is a coincident indicator of momentum earlier. With a new update, we are publishing charts of relative strengths of individual stocks over multiple lookback periods. This can be found under the ‘Quant’ tab of the equity pages.
How to interpret Relative Strength Spread?
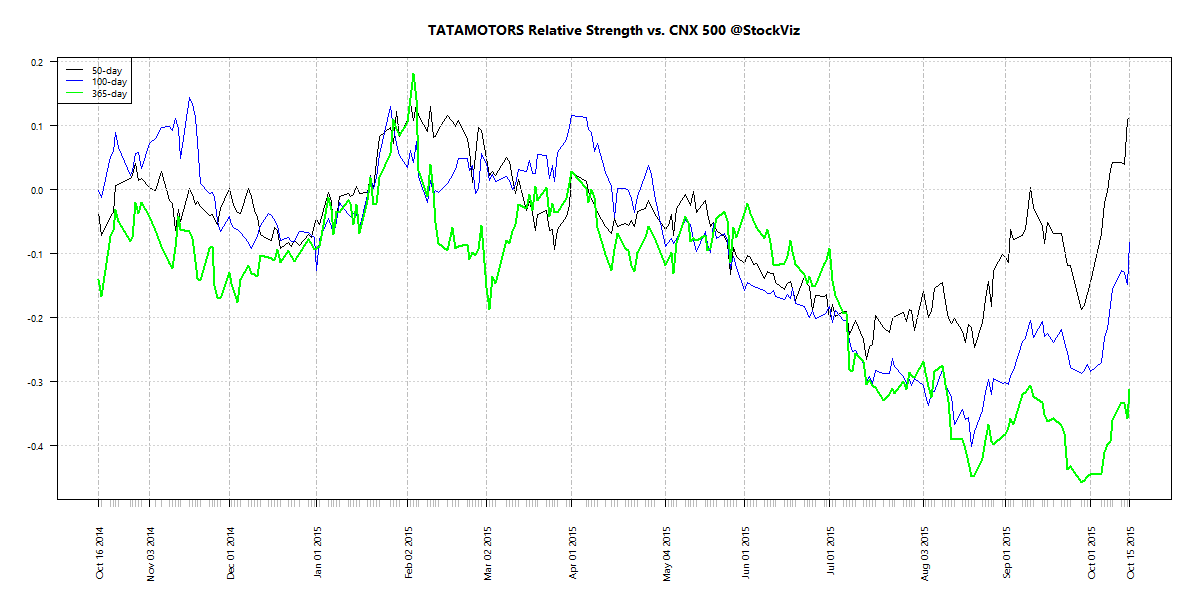
Relative Strength Spread is a measure of historical out-performance. By observing the RS-Spread over different lookback periods, investors can get a sense of future direction of momentum. For example, if you look at the RS-Spread of TATAMOTORS, you can observe how the stock lagged the broad market for the better part of the year before suddenly turning around in the last few days.
Now contrast that to BHARATFORG:

Unlike a price or return chart that looks at an individual stock, the RS-Spread chart incorporates information from a broad set of stocks and compares it to the market average. It has more information content than the ‘Relative Momentum’ chart as well.