Tag: NIFTYBEES

Analysis: JINDALSTEL

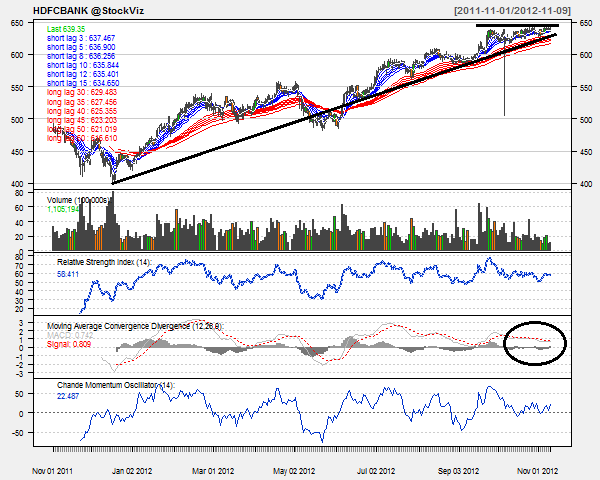
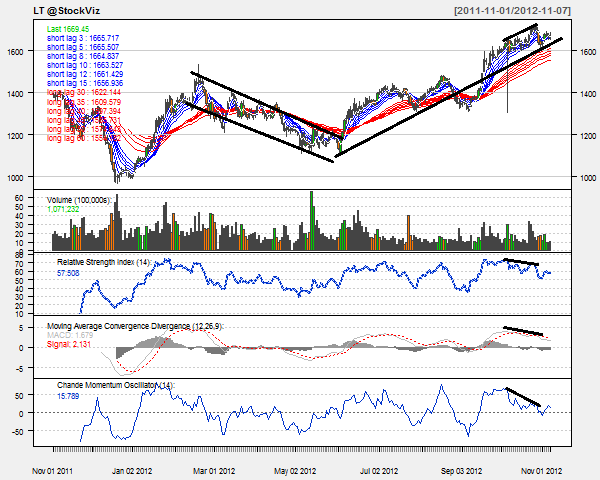
Today’s pick is [stockquote]JINDALSTEL[/stockquote]. The stock has been in a down-trend for the most part since Feb this year. However, there was a slight up-move in Sep, but it gave up by start of Oct. Since then the stock has been in a down-trend again. In the last three month period, the stock moved -11% Vs +5% as that of Nifty’s.

image

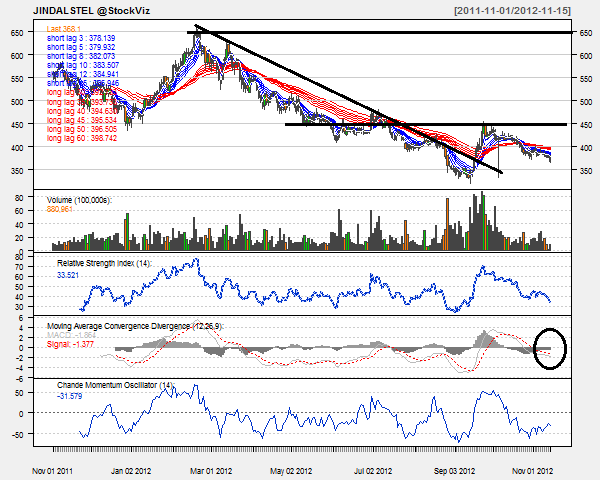
Oscillators RSI and CMO are at currently at 33 and –31, and are hovering around the over-sold territory but are not suggesting any direction.

MACD line and the signal line are moving very close to each other and the Histogram is showing a decreasing levels. This can be an early indicator of an upcoming up-trend.

The GMMA chart is not suggesting any direction for either the short-term or the long-term as well.

image

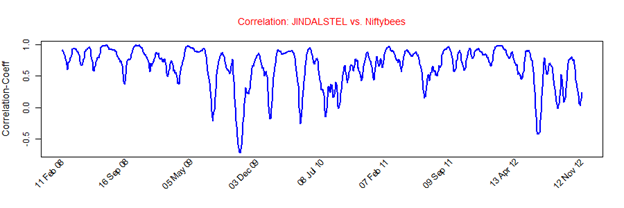
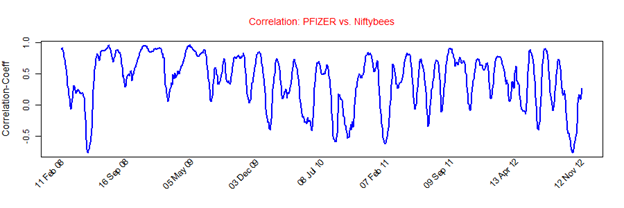
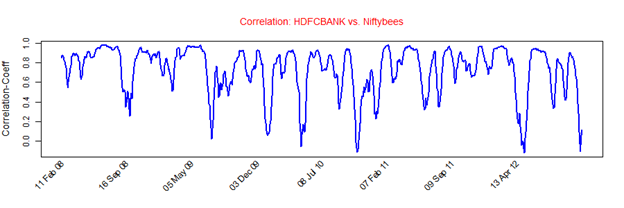
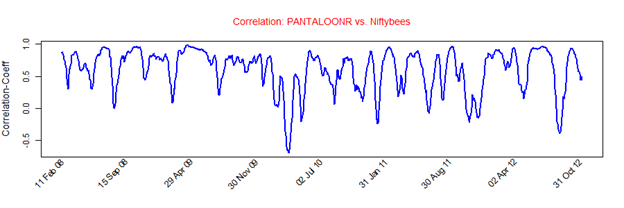
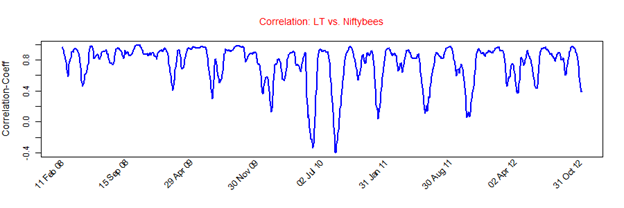
JINDALSTEL’s average correlation of 0.65 with the Nifty is positive and strong. The stock will replicate the movements of Nifty closely because of the co-efficient. [stockquote]NIFTYBEES[/stockquote]

image

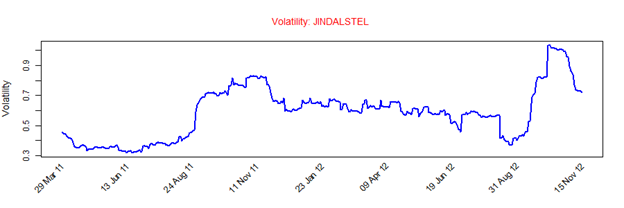
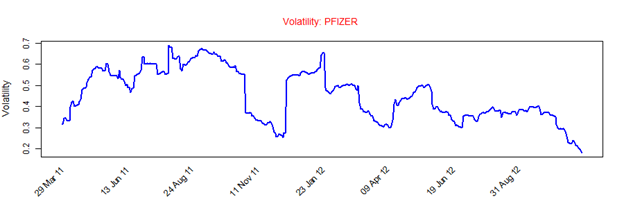
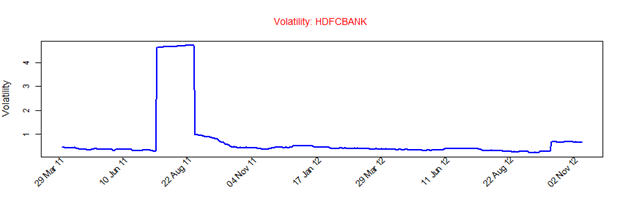
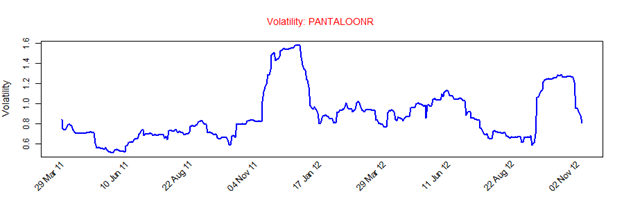
JINDALSTEL has a historical volatility in the range of 0.3 to 1.0. The scrip’s volatility is currently in the middle of the range and hence is not a concern.

Looking at these technicals a short-term buy is suggested upon a decisive MACD cross-over. A break-out of the near term resistance at 450 will trigger a longer-term up-trend.

Enhanced by Zemanta

Analysis: PFIZER

Today’s pick is [stockquote]PFIZER[/stockquote]. The stock has been range-bound between the 1100 to 1350 levels since last December. The stock is currently trading close to its 52 weeks low of 1100. In the last three month period, the stock moved -10% Vs + 5% as that of Nifty’s.

image

Oscillators RSI and CMO are at currently at 37 and -27 are hovering around the over-sold territory but are not suggesting any direction.

MACD line and the signal line are moving very close to each other since a long time and are not suggesting any trend.

The GMMA chart is not suggesting any up-move in the long term as well.

image

PFIZER’s average correlation of 0.40 with the Nifty is positive. The stock will not replicate the movements of Nifty closely because of the low co-efficient. [stockquote]NIFTYBEES[/stockquote]

image

PFIZER has a historical volatility in the range of 0.2 to 0.7. The scrip’s volatility is currently at the lowest point of the range and hence should not be a concern.

Looking at these technicals a short-term buy is suggested upon a decisive MACD cross-over. A break-out of the range in either direction will trigger a longer-term call.

Enhanced by Zemanta

Analysis: HDFCBANK (HDB)

Today’s pick is [stockquote]HDFCBANK[/stockquote]. The stock has been in an up-trend since lows of last December. However, the last one and a half month has seen a range bound movement for the stock. In the last three month period, the stock was up 7% same as that of Nifty’s return. The stock is currently trading around its 52-week high at 645 levels.

image

Oscillators RSI and CMO are at currently at 58 and 22 are hovering around the over-bought territory but are not suggesting any direction.

MACD line and the signal line are moving very close to each other since a long time and are not suggesting any trend. The short-term technicals are looking pretty good: both the 4×9 Cross-Over and 4×18 Cross-Over are bullish.

The GMMA chart shows that long-term lines are parallel to each other which is a bullish sign for the stock. The short-term lines are entangled because of the last months range bound movement.

image

HDFCBANK’s average correlation of 0.73 with the Nifty is positive and quite strong. The stock will replicate the movements of Nifty closely because of the high co-efficient. [stockquote]NIFTYBEES[/stockquote]

image

HDFCBANK has a historical volatility in the range of 0.4 to 4 which is a very big range. The scrip’s volatility is currently in the lower side of the range and hence should not be a concern.

Analysts have mixed expectations regarding this stock. Next set of earnings can help bring a different picture on the charts. Also, the magnitude of buys and sells from insiders crossed each other out.

Looking at these technicals a short-term buy is suggested. A break-out of the pennant in either direction will trigger a longer-term call.

Enhanced by Zemanta

Analysis: PANTALOONR

Today’s pick is [stockquote]PANTALOONR[/stockquote]. The stock is currently trading around the same price where it was year ago – range bound between 130 to 220 levels for almost a year. However, it recently zipped past its resistance at 200 on higher volumes. In the last three month period, the stock is up 30% vs. 7% for Nifty.

image

Oscillators RSI and CMO are currently at 62 and 18 and are closing towards over-bought territory.

MACD line has just crossed the signal line from below signaling a bullish movement for the coming days.

Long term set of GMMA lines are fanning out – which is a bullish for the long term. Due to the recent down-trend in the stock prices the short-term lines are constricted and are not signaling any movement.

In addition to these technicals, the stock seems to have some momentum behind it with 4 cross 9 and 9 cross 18 EMA bullish crossovers seen in the past week.

image

PANTALOONR’s average correlation of 0.60 with the Nifty is positive and strong. The stock will replicate the movements of Nifty closely. [stockquote]NIFTYBEES[/stockquote]

image

PANTALOONR had a historical volatility in the range of 0.6 to 1.6. Currently the stock’s volatility is towards the lower side of the range.

Looking at these technicals a short-term buy is suggested. For the long-term, the GMMA lines are giving a bullish signal for the stock and a break-out above the 220 levels will confirm the signal.

Enhanced by Zemanta

Analysis: LT

Today’s pick is [stockquote]LT[/stockquote]. The up-trend in place since December last year was punctuated by a correction in March through May. The stock has since resumed its upward trajectory to reach a 52 week high of 1700 recently. In the last three month period, the stock is up 18% vs. 8% for Nifty.

image

Oscillators RSI and CMO are currently at 57 and 16 and in no man’s land.

MACD line and the signal line are moving very close to each other with the histogram levels steady. They are not signaling any directional movement.

Long term set of GMMA lines are fanning out – which is a bullish for the long term. Due to the recent down-trend in the stock prices the short-term lines are constricting, giving a bearish signal for the short-term.

Added to all the current technical levels, we can see a divergence in RSI, CMO and MACD levels. The higher highs in the prices are accompanied with the lower highs of the technicals which is a near-term bearish sign for the stock.

image

LT’s average correlation of 0.75 with the Nifty is positive and quite strong. The stock will replicate the movements of Nifty closely. [stockquote]NIFTYBEES[/stockquote]

image

LT had a historical volatility in the range of 0.3 to 0.8. Current volatility of the stock should not be sign of panic for the traders.

In a couple of insider trading instances between 25th through 29th Oct, right around when the stock was making its 52 week highs, the Chairman, Mr. Naik, sold a total of Rs. 10.1 Cr worth of shares.

Looking at these technicals a short-term hold is suggested. Although for the long-term, the GMMA lines are giving a bullish signal for the stock.

Enhanced by Zemanta