Tag: NIFTY

Selling NIFTY Butterflies with Stop Loss

Stop loss

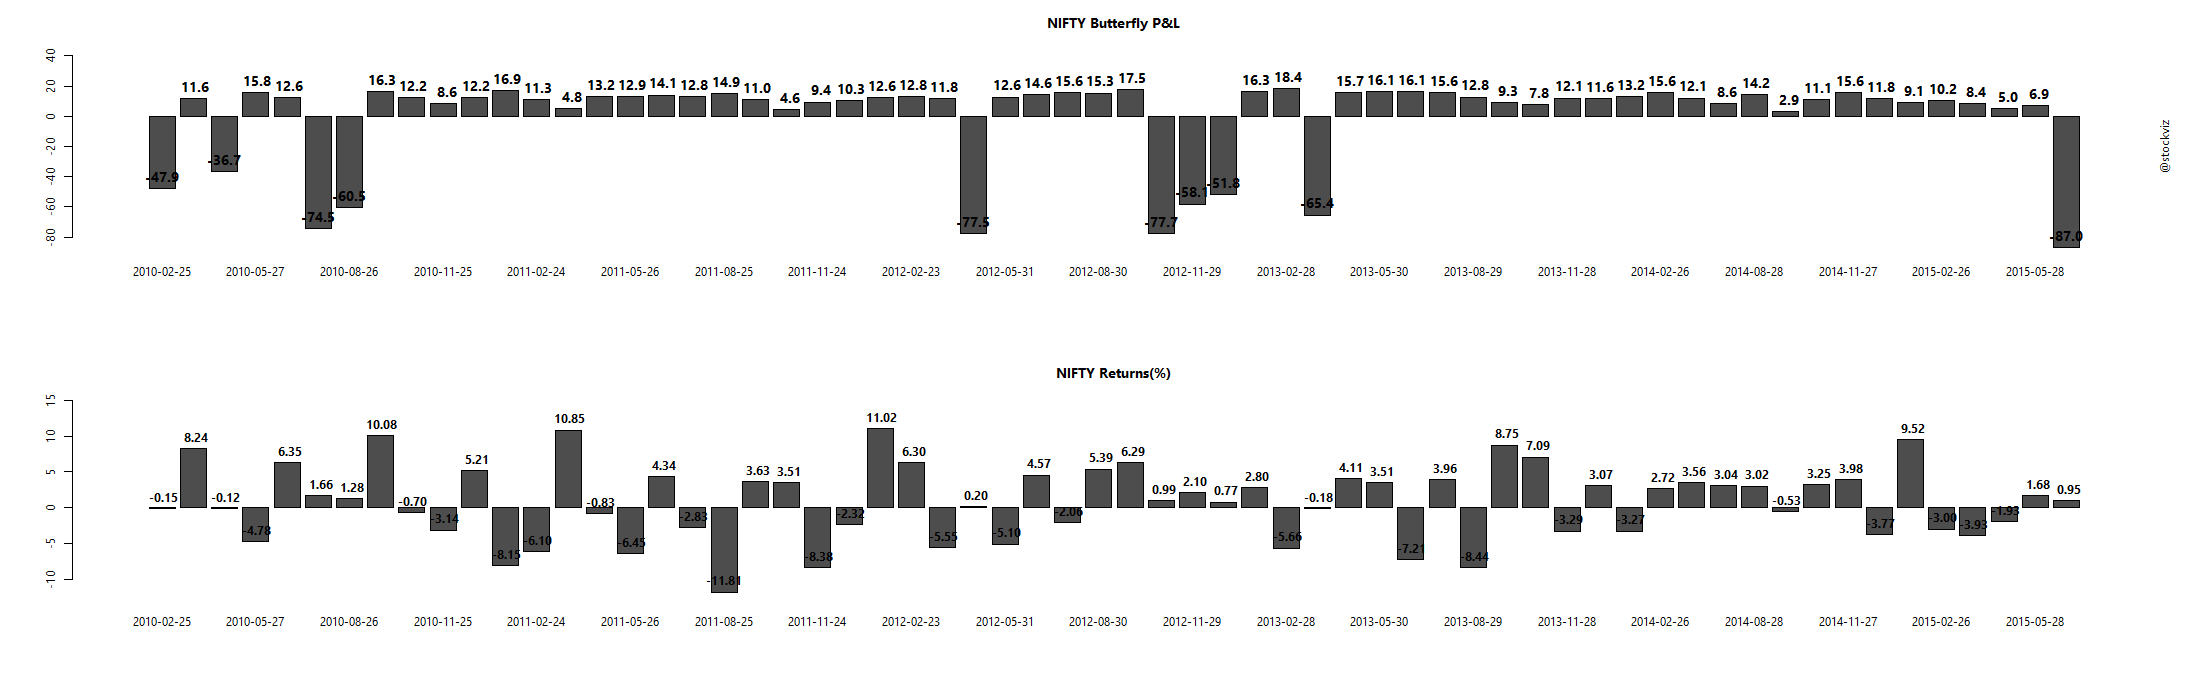
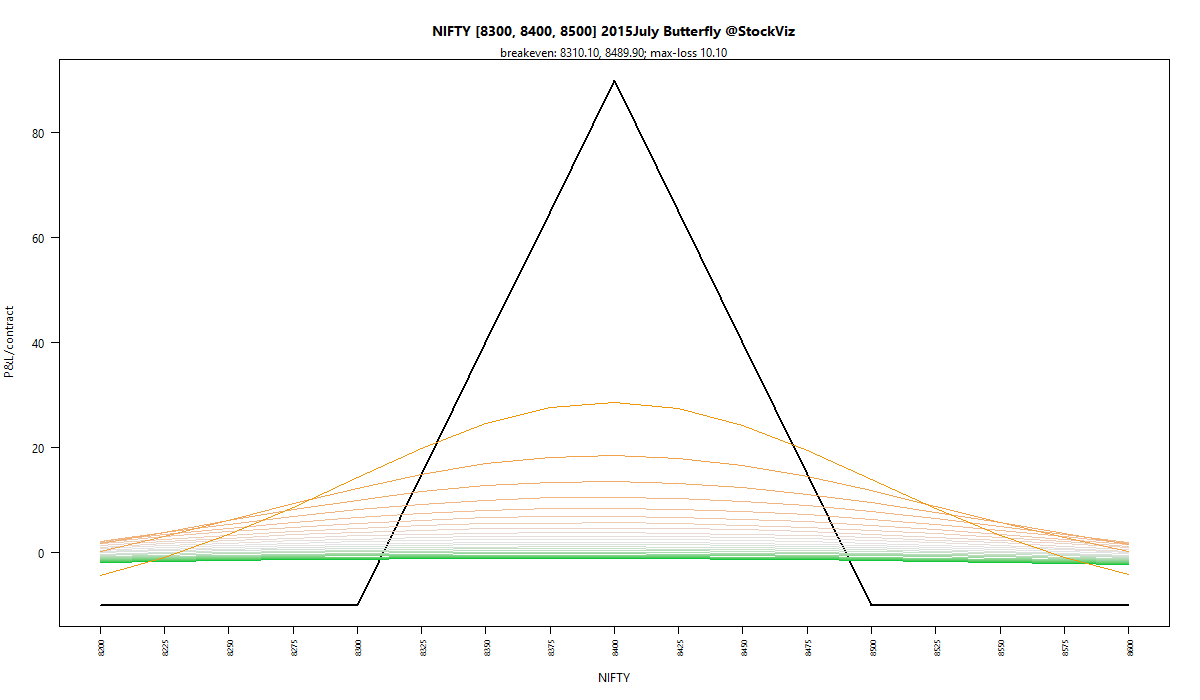
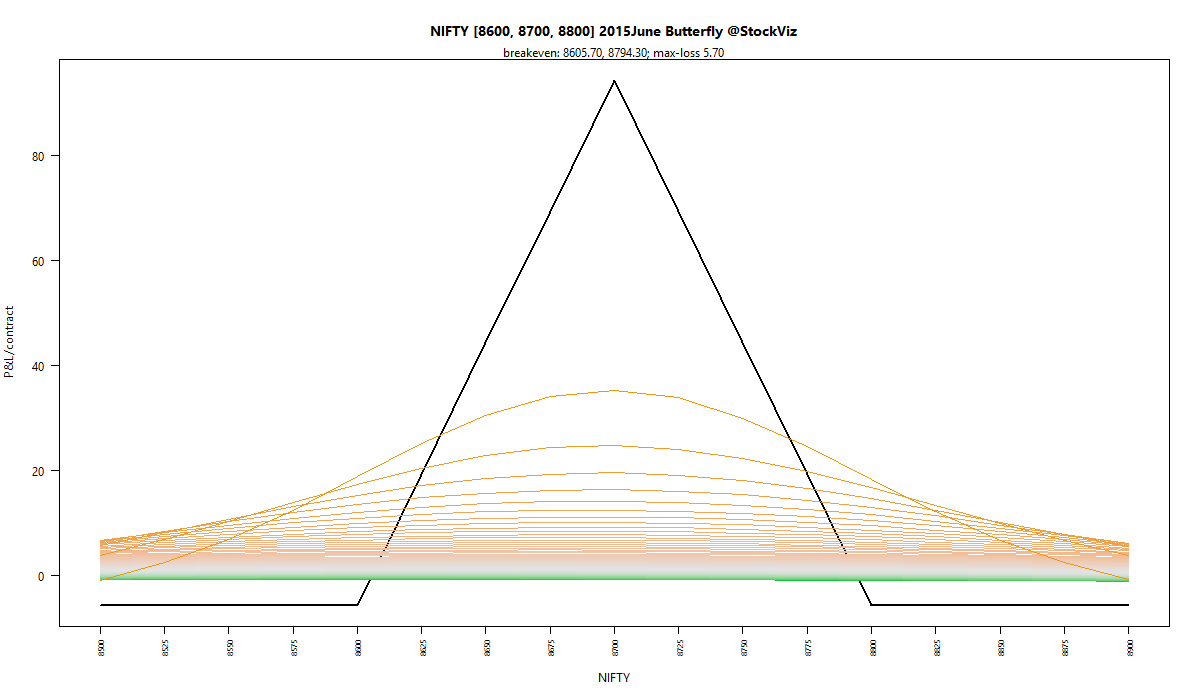
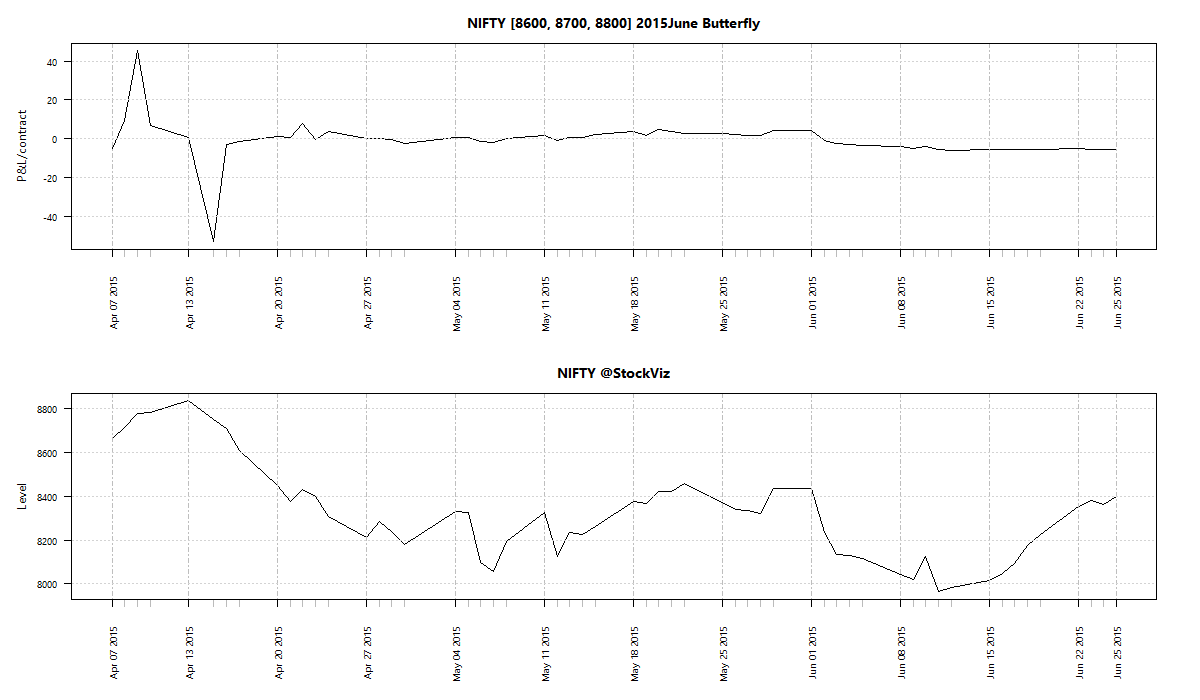
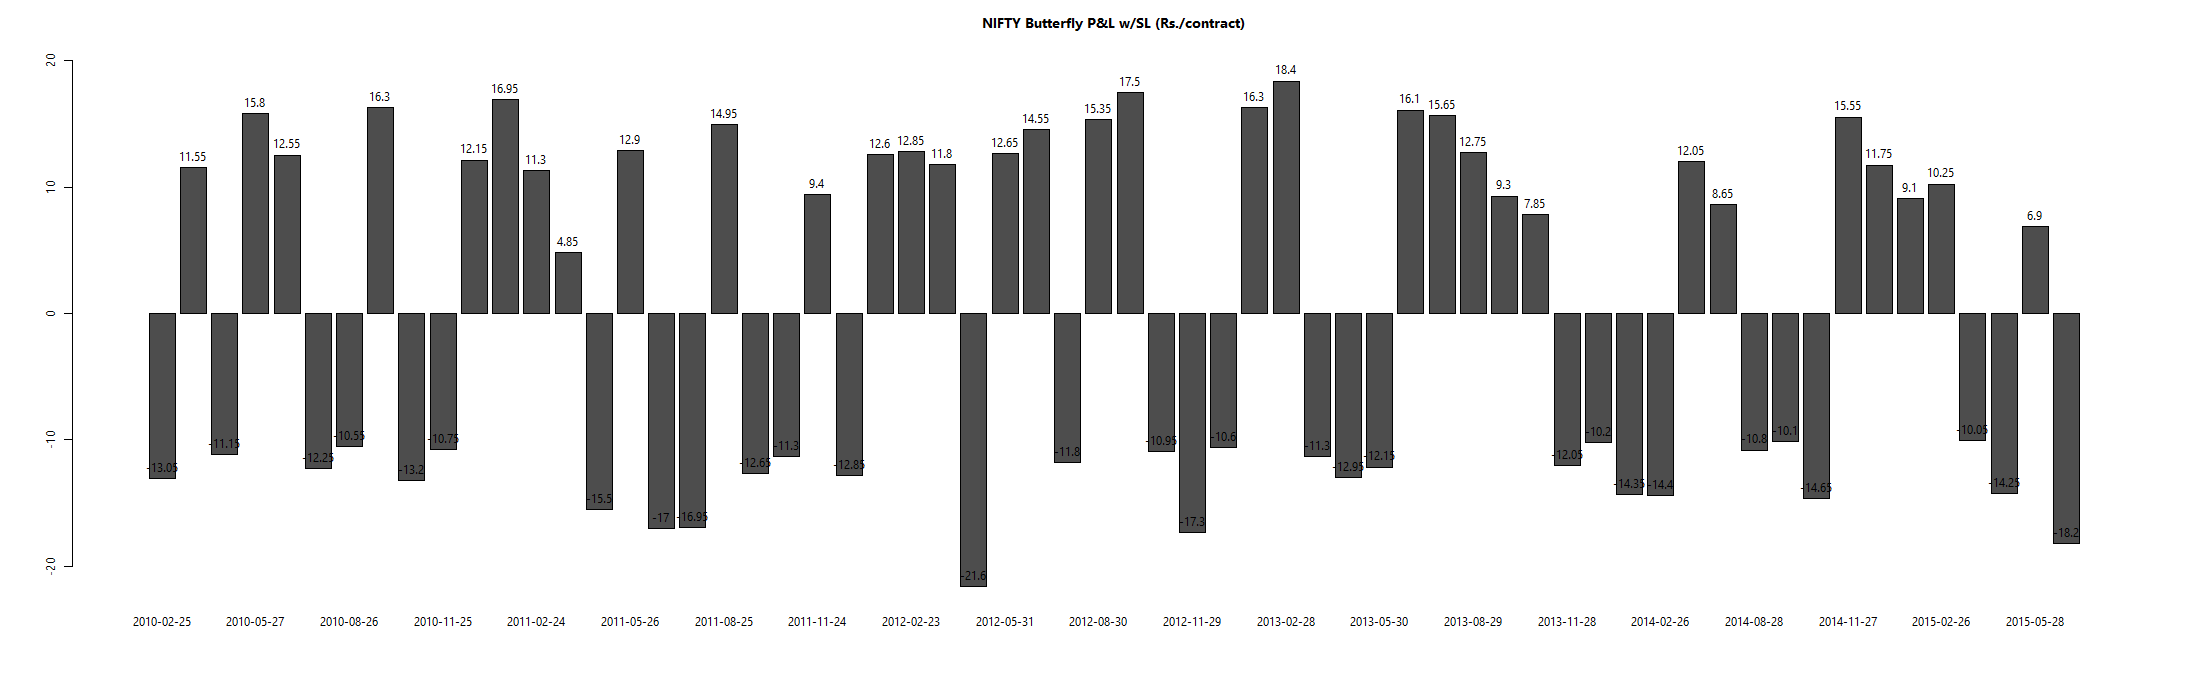
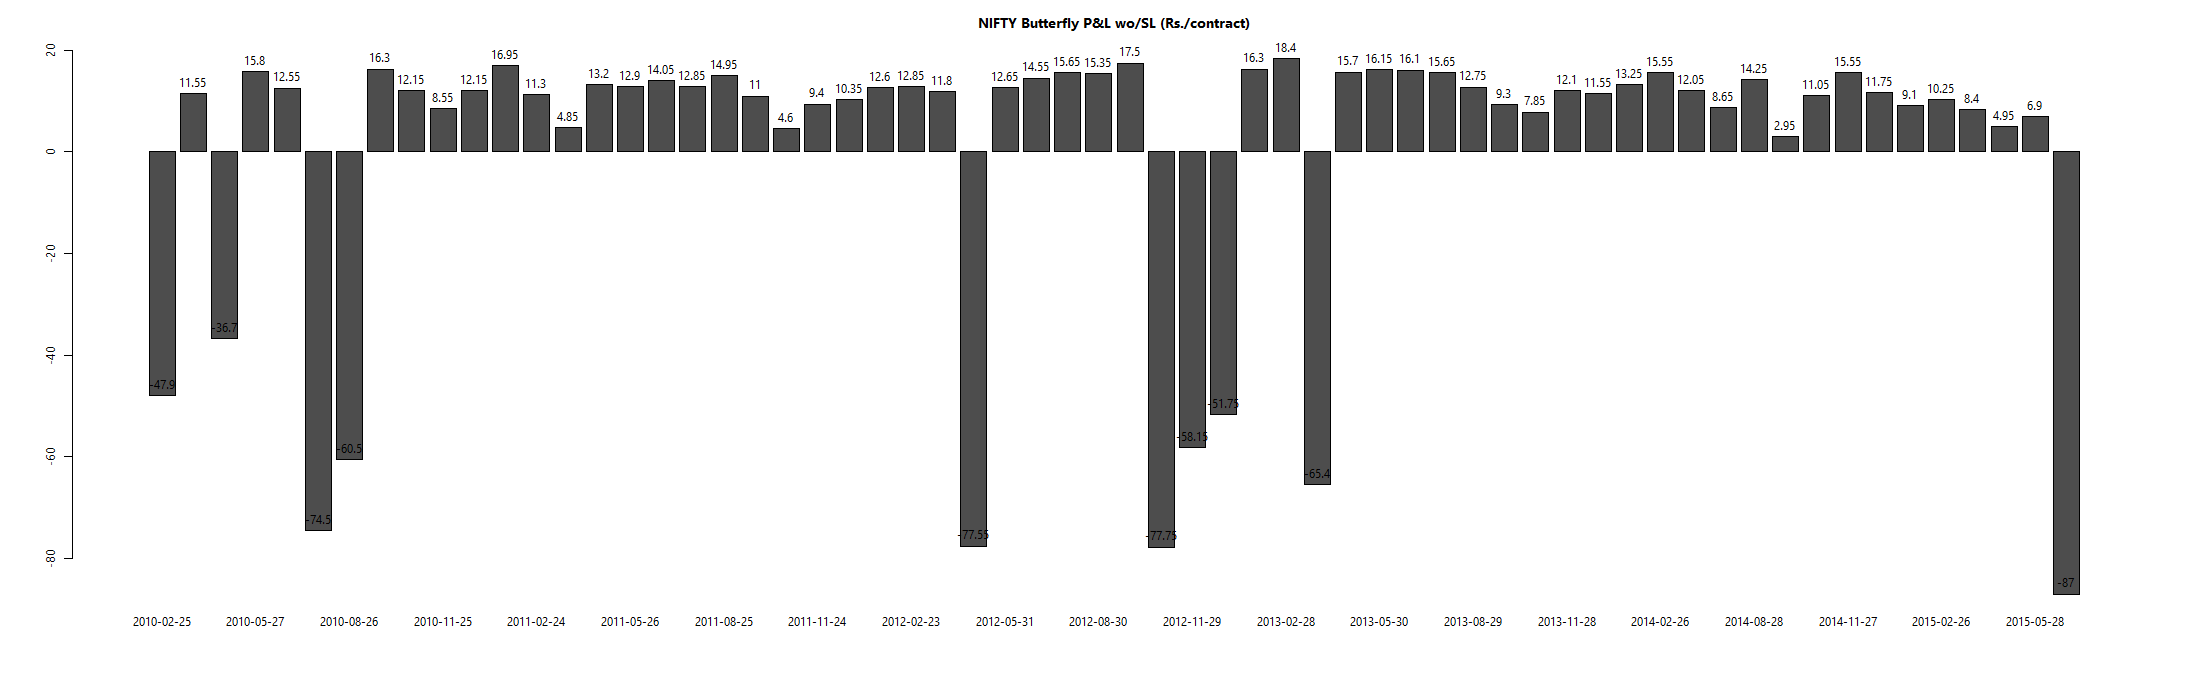
We saw earlier how infrequent but large losses in the short-call butterfly strategy can wipe out all the past profits earned. To figure out a stop-loss mechanism, we plotted individual expiry-to-expiry butterflies to find out how each one of them behaved. This data is available in the appendix below.

The stop-loss is set at 10 points (x lot-size) for the butterfly. But this kicks in only 10 days before the contracts expire (see how it gets “pulled” here.)

Returns comparison

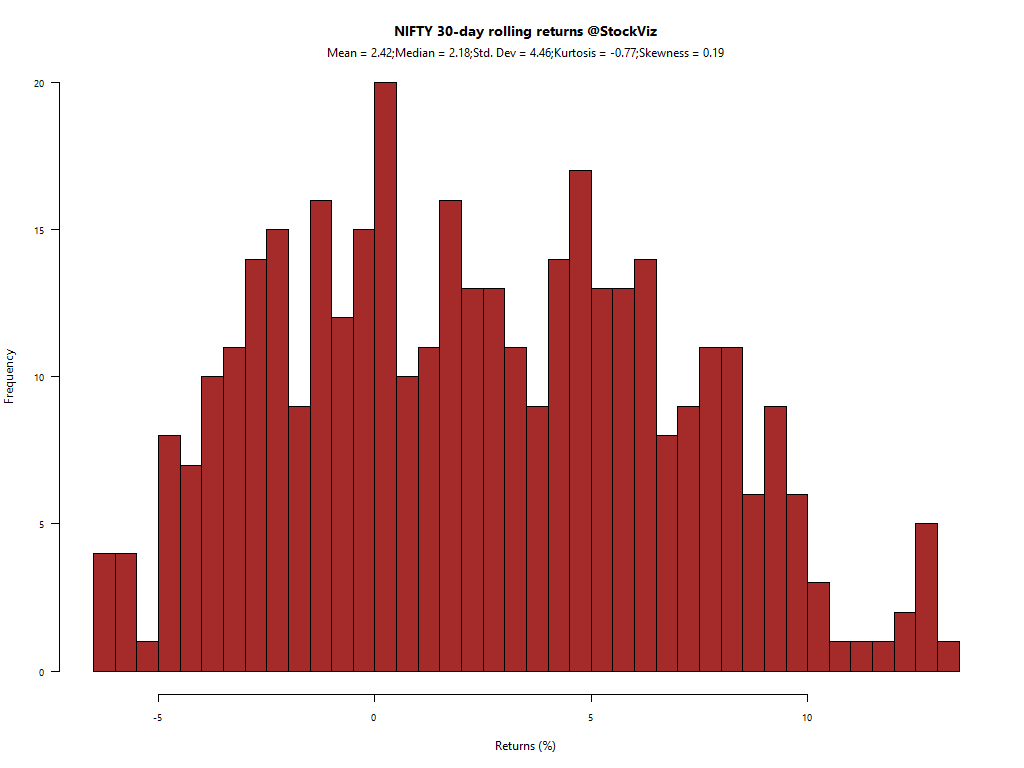
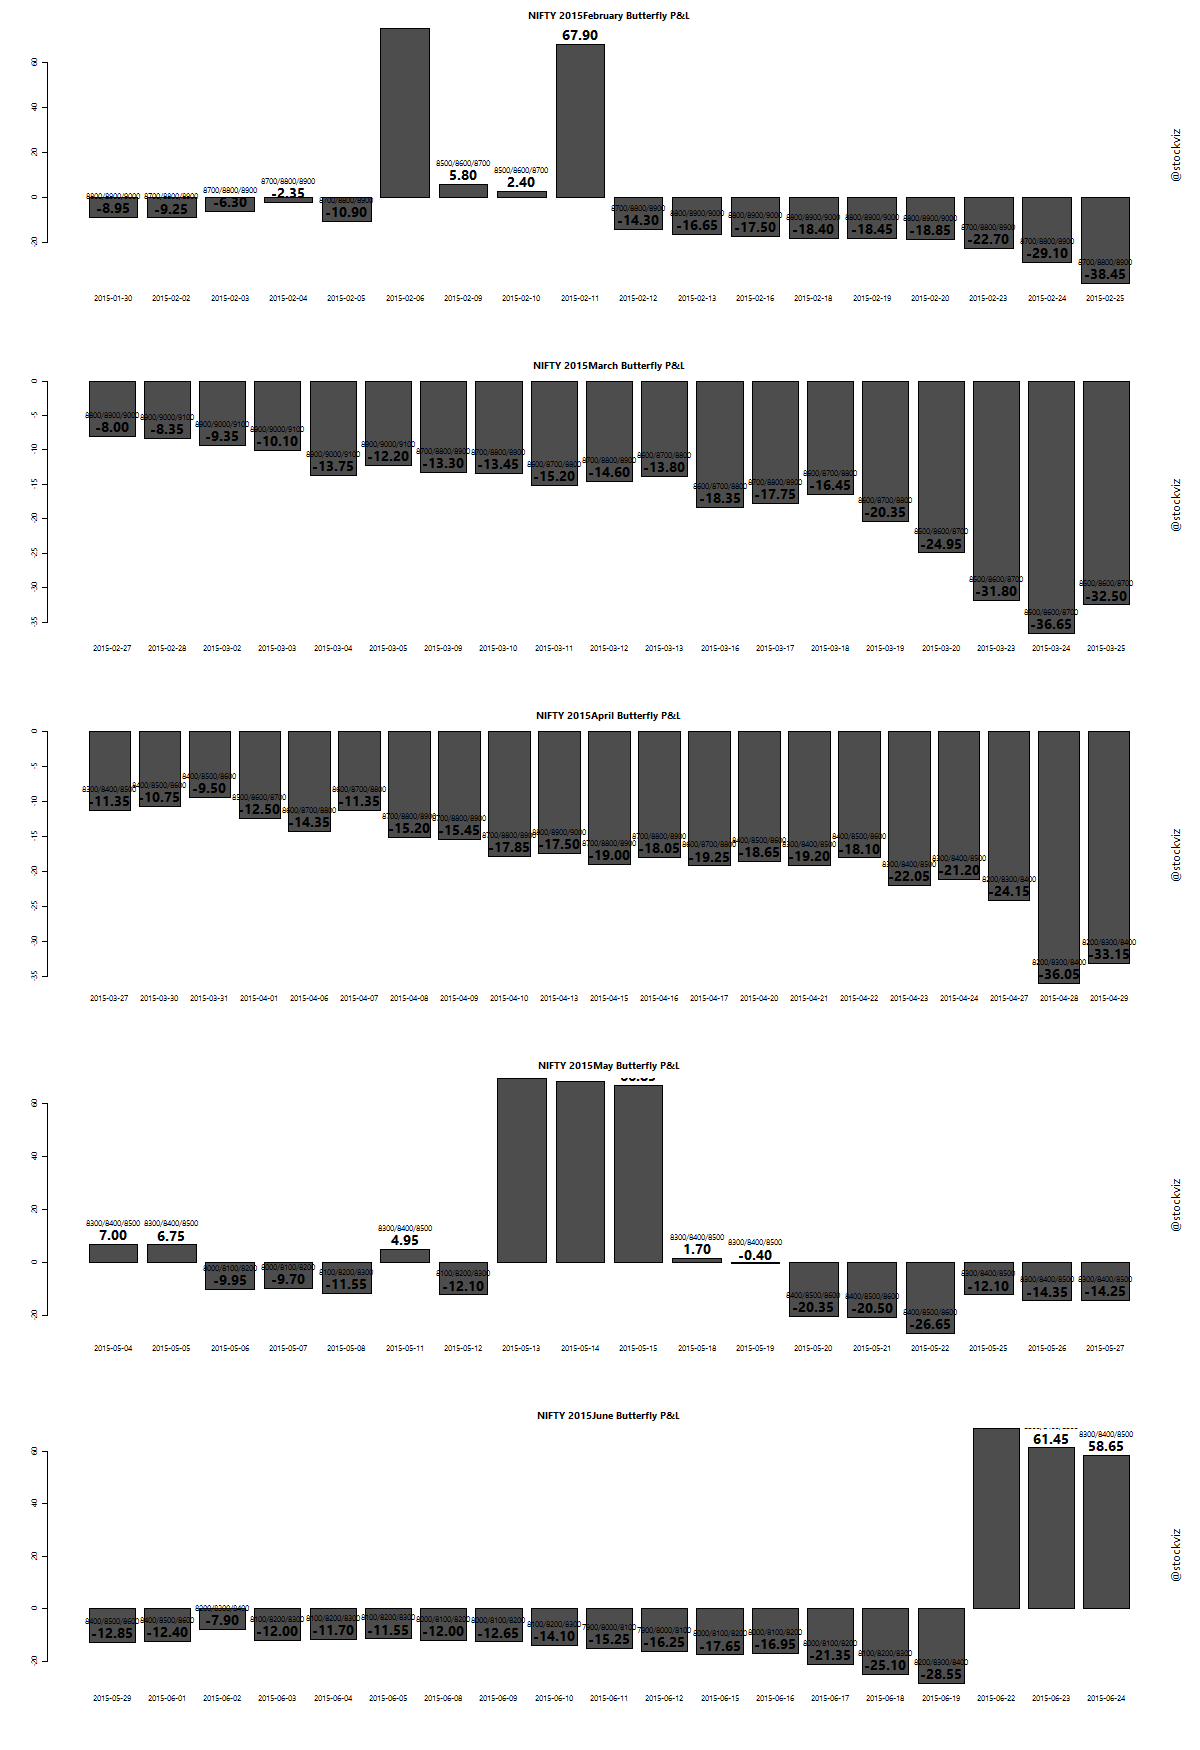
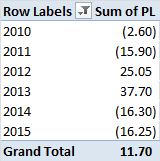
Here’s the month-over-month returns of a mechanical short-call butterfly strategy with stop-loss:
butterfly.returns.SL.NIFTY

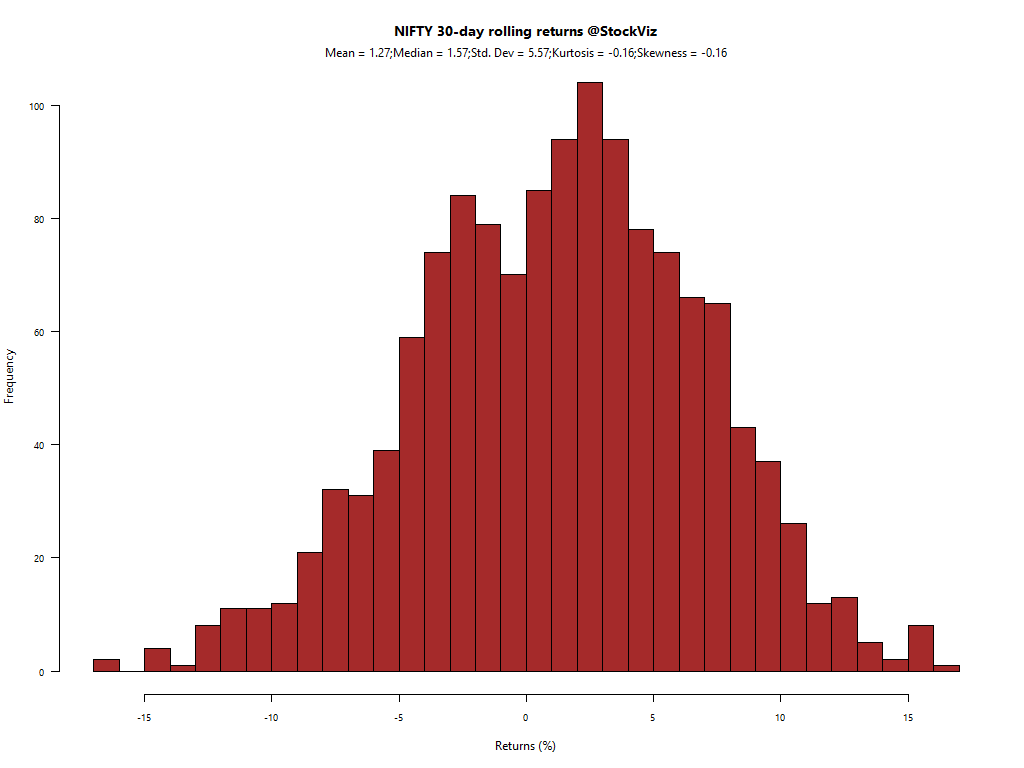
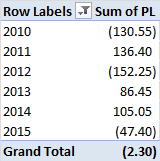
Here’s the month-over-month returns of a mechanical short-call butterfly strategy without stop-loss:
butterfly.returns.noSL.NIFTY

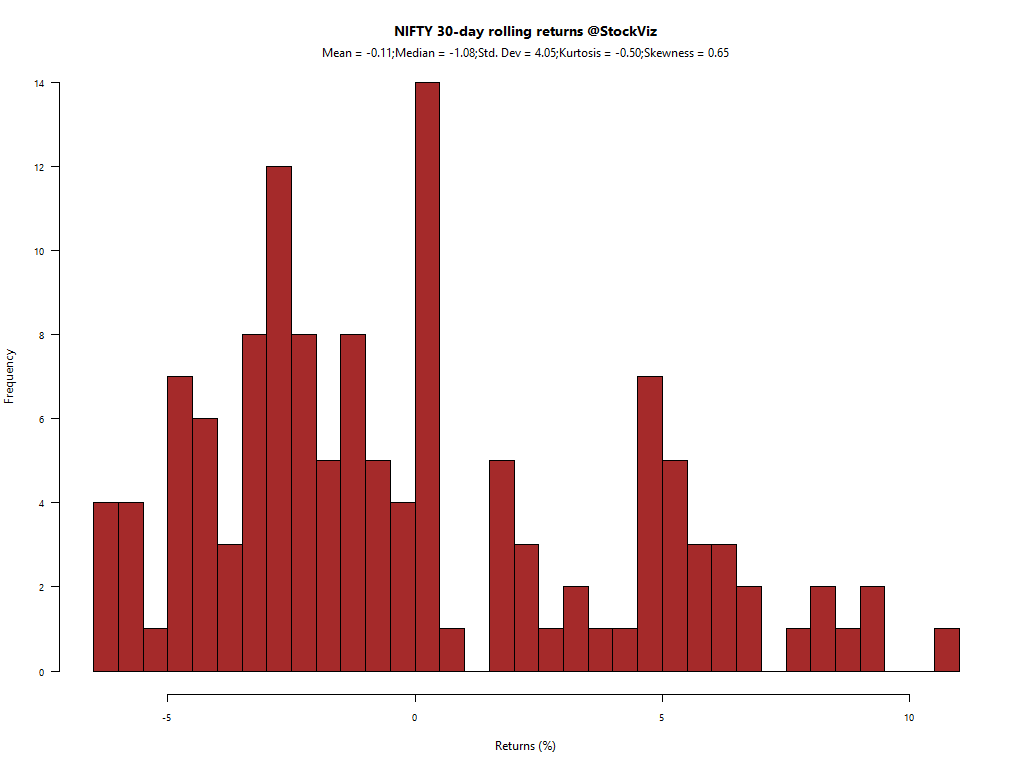
Because of the stop-loss, the frequency of losses increases but their magnitude decreases. However, stop-losses were hit about half the time.

With stop-loss:
butterfly returns with stop loss
Without stop-loss:
butterfly returns without stop loss

Summary

Applying a stop-loss to a mechanical expiry-to-expiry short call butterfly strategy on the NIFTY seems to enhance returns by cutting out infrequent but large losses. However, the frequency of wins seems low given that only two out of 5 years resulted in net profit. If you did not use a stop-loss, you would have larger gains and would have had more positive years. However, losses in 2010 and 2012 were enough to wipe out all profits and more.

Appendix

https://www.scribd.com/doc/271141815/Nifty-Butterfly

A Simple NIFTY Short Call Butterfly Back-Test

Monthly moves

We saw that the NIFTY’s median move over a 30-day period is over 1% and that is all that is required to make a short-call butterfly strategy profitable. Let us now do a quick back-test to check if it is indeed the case.

Back-test

Here is the short-call butterfly back-test from 2010 through now. You basically sell the closest expiry butterfly at each expiry (click to embiggen):

butterfly.returns.NIFTY

Summary

While it is true that a 1% move in the NIFTY results in a profitable trade, there are instances where the NIFTY doesn’t move +/-1%. When the NIFTY ends flat, you end up losing all your prior profits. Understanding what drives NIFTY to move is key to managing your risk while running this strategy.

Selling NIFTY Butterflies

Nifty Rolling Returns

In our earlier post, we saw how selling NIFTY butterflies has been profitable this year. To understand why, let’s have a look at the rolling returns of the NIFTY.

Here’s the 30-day rolling returns of the NIFTY, from 2010 to the present, the whole population:

day-30-rolling-2010-2015
Median: 1.57%

2014-present:
day-30-rolling-2014-2015
Median: 2.18%

Beginning of 2015-present:
day-30-rolling-2015-2015
Median: -1.08%

Profitability

For a short-call butterfly to be profitable, NIFTY has to expire away from the either of the wings. Each wing is 100 points away. With NIFTY at 8500, that’s a 1.12% move. Whereas back when NIFTY was around 6000, this trade would require a 1.67% move to be profitable. So as the NIFTY rises, if they don’t widen the distance between the listed strikes, your hit ratio with selling butterflies will increase. However, the total profitability will decrease because everybody will think this way.

Summary

If NIFTY continues to exhibit the same pattern of returns, a rising NIFTY will make selling butterflies more profitable.

Butterfly Option Strategy – Introduction

What is it?

An option butterfly strategy can be used to bet on underlying volatility. A long call butterfly can entered when you think that the underlying will not rise or fall much by expiration. Using calls, the long butterfly can be constructed by buying one lower striking ITM call, writing two ATM calls and buying another higher striking OTM call.

For example, with the NIFTY at ~8330, the strikes would be 8300, 8400 and 8500. If the NIFTY bends between 8310 and 8490, you make a profit of ~Rs. 90 per contract (x lot-size) and your downside (max loss) is limited to the premium you paid (~Rs. 10 per butterfly contract x lot-size.)

To get a sense for how your P&L will look, you can project the option premiums using the Black-Scholes model.

butterfly.NIFTY.2015-07-08.2015-07-30

The solid black line is the P&L scenario at expiry. As you can see, intermediate P&L bears very little resemblance to expiry. It is almost as if most of the P&L is “pulled” as you get nearer to expiry.

Projection vs. Reality

Back in early April this year, the NIFTY was trading around 8600. So you would enter into an 8600, 8700, 8800 butterfly. If you sold the June butterfly, you are essentially betting that the NIFTY would expire outside of 8605 and 8795. If it did, you would get to keep the premium you received (~Rs. 5.70 per butterfly.)

butterfly.NIFTY.2015-04-06.2015-06-25.6.7.8.projection

Here is how the butterfly actually behaved:

butterfly.NIFTY.2015-06-25.2015-06-25.678

As a seller, your P&L is actually the inverse of what is shown above. So you would have lost a lot of money when NIFTY shot to 8800s and then swung the other way as NIFTY headed back down. Finally, as you neared expiry, your P&L approached the premium you received.

As you can see, actual behavior bears very little resemblance to modeled behavior.

Butterfly profitability

Selling butterflies has been a profitable trade this year. As long as there is volatility, a short call butterfly should make money. Here is the long P&L (selling butterflies would invert this P&L):

butterfly.PL.NIFTY

However, it is a bet on the NIFTY not expiring within the break-even range of the trade. Getting this right could prove tricky. Losses tend to be large and if risk is not managed properly, it can wipe out all the profits made over a period of time. The proverbial “picking up pennies in front of a bulldozer.”

Summary

To point out the obvious, liquidity is a huge problem while executing on this trade. However, selling butterflies can be used to systematically earn carry, as long as risks are managed.

Machine Learning Long-Short Trend Following

Introduction

Our previous post discussed how a simple SMA On/Off Switch based tactical algo can be enhanced by a volatility metric. We generated significant alpha by following a simple rule:

Go short if either or the volatility signal or the 50-DMA indicates a negative bias and long otherwise.

But what if we trained a machine on the same data and allowed it to decide when to go long and short?

Support Vector Machines

We fed an SVM our volatility metric and the percentage distance from 50-day SMA. A 5-year training set was used to predict the next year daily long/short. We will not delve into the details of how SVMs work, Wikipedia does a decent job introducing the concept.

Performance

To make it easier to compare, we plot the wealth-charts for the NIFTY and BANKNIFTY indices side-by-side.

The black line is the Machine Learning Long-Short Model and the blue line is buy-and-hold. NIFTY and BANKNIFTY since 2011:

nifty.machine.learning.2011

banknifty.machine.learning.2011

NIFTY and BANKNIFTY since 2013:

nifty.machine.learning.2013

banknifty.machine.learning.2013

Cumulative Returns

Buy-and-hold has two big advantages over a trading strategy: transaction costs and tax treatment. Here is how the different strategies compare with buy and hold:

NIFTY SVM

BANKNIFTY SVM

It appears that the ML(V + 50-DMA) Long Short strategy works better on the BankNifty than on the Nifty. The out-performance of the ML model on the BankNifty more than compensates for transaction costs and taxation.

Conclusion

The ML model outperformed the NIFTY by an average of 12% in the last 4-years and the BANKNIFTY by 94% in the same period. The out-performance on the BANKNIFTY is considerable enough to warrant further exploration.