Tag: NIFTY

Basis Trades using Futures

Introduction

When we discussed cash-futures basis, it was pointed out that the fair value of a futures contract is a function of the underlying price, interest rates, dividends and time to expiration. The same logic applies to the fair value of contracts across expiration dates. For example, as of close on April 30, 2015, NIFTY futures contracts had the following values: 8177.35 (April), 8244.05 (May), 8275.30 (June).

Some of our clients wanted us to check if this basis can be traded. Is it possible to profit from going long the near contract and short the far contract on a consistent basis? Before we look at profitability, lets chart the basis.

The basis

Here is how the basis between different contracts look (2000 through now):

NIFTY.futures.basis

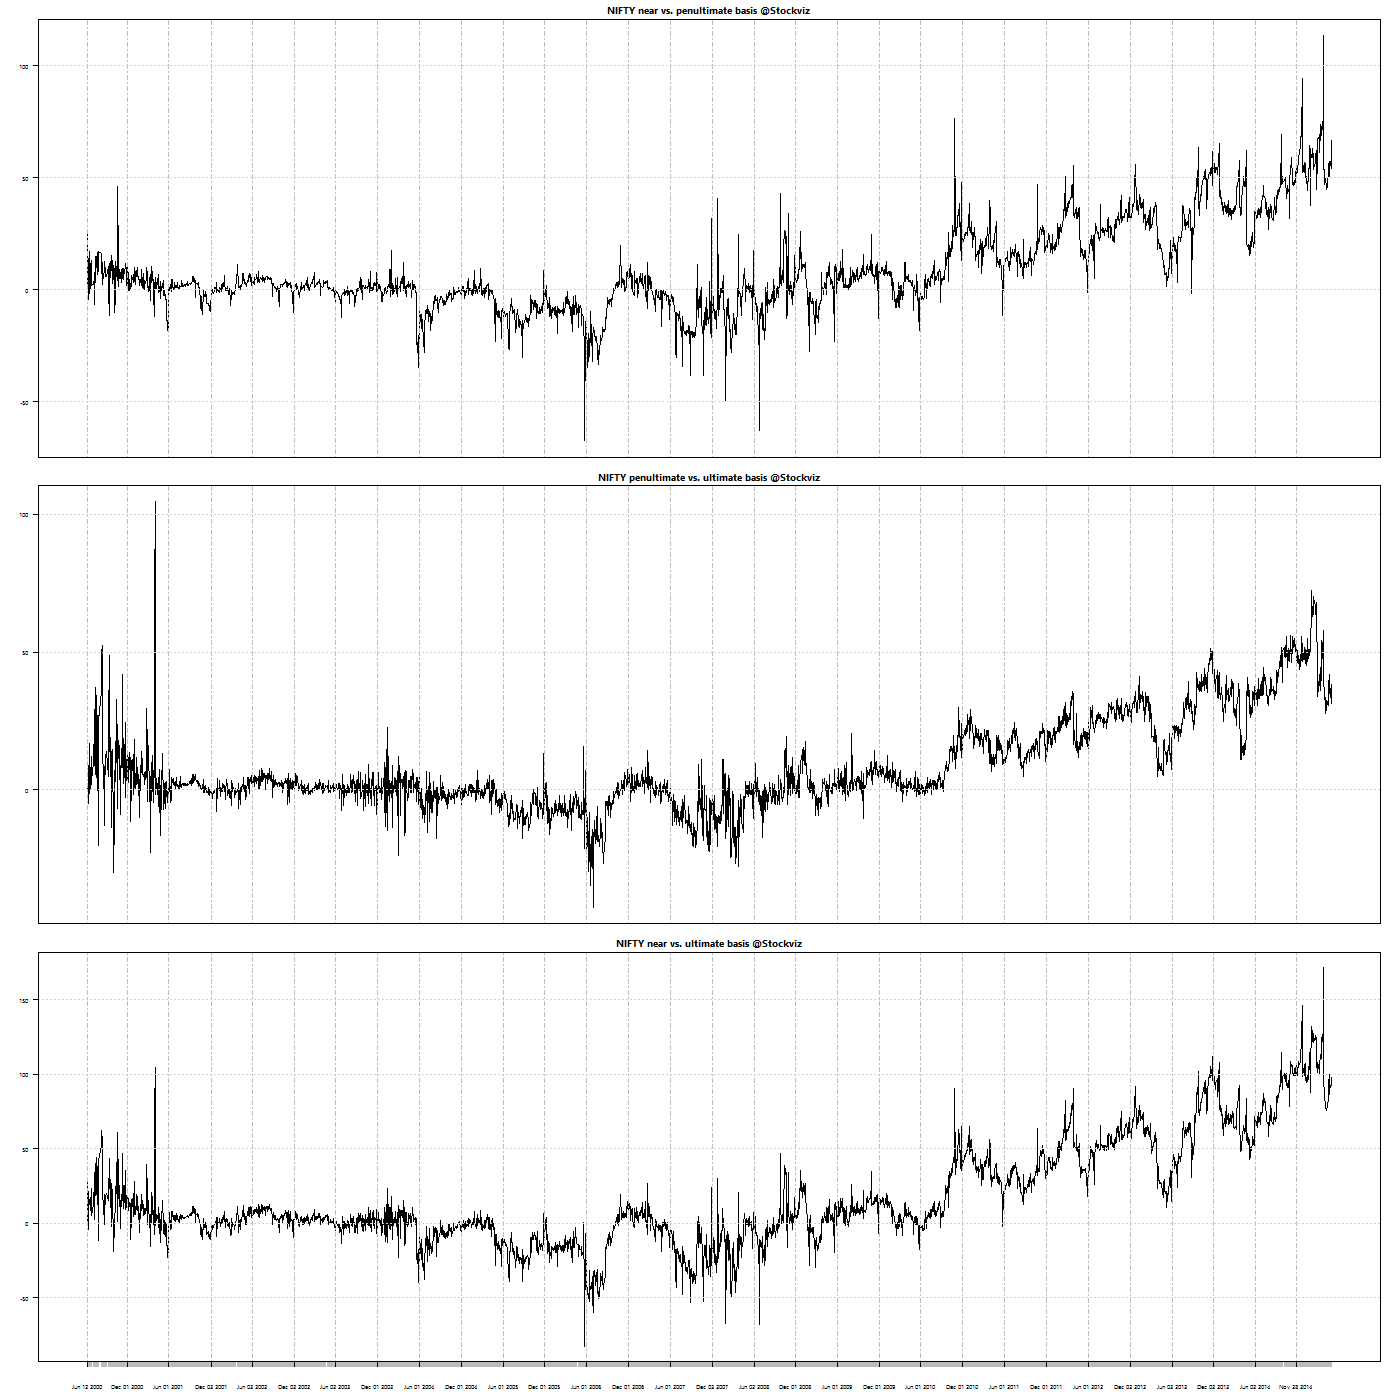
Here is the summary statistic of the basis:

summary statistics

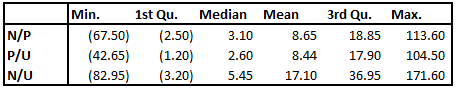
Here is the same data with futures expiry dates removed:

summary statistics

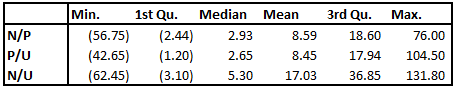
With the extreme values removed, we can now check if we can trade the nearest expiry contract with the farthest.

50-day Average Basis Trade Back-Test

Lets take a look at the Near vs. Farthest basis and draw a 50-dma through it:

NIFTY.futures.basis.50dma

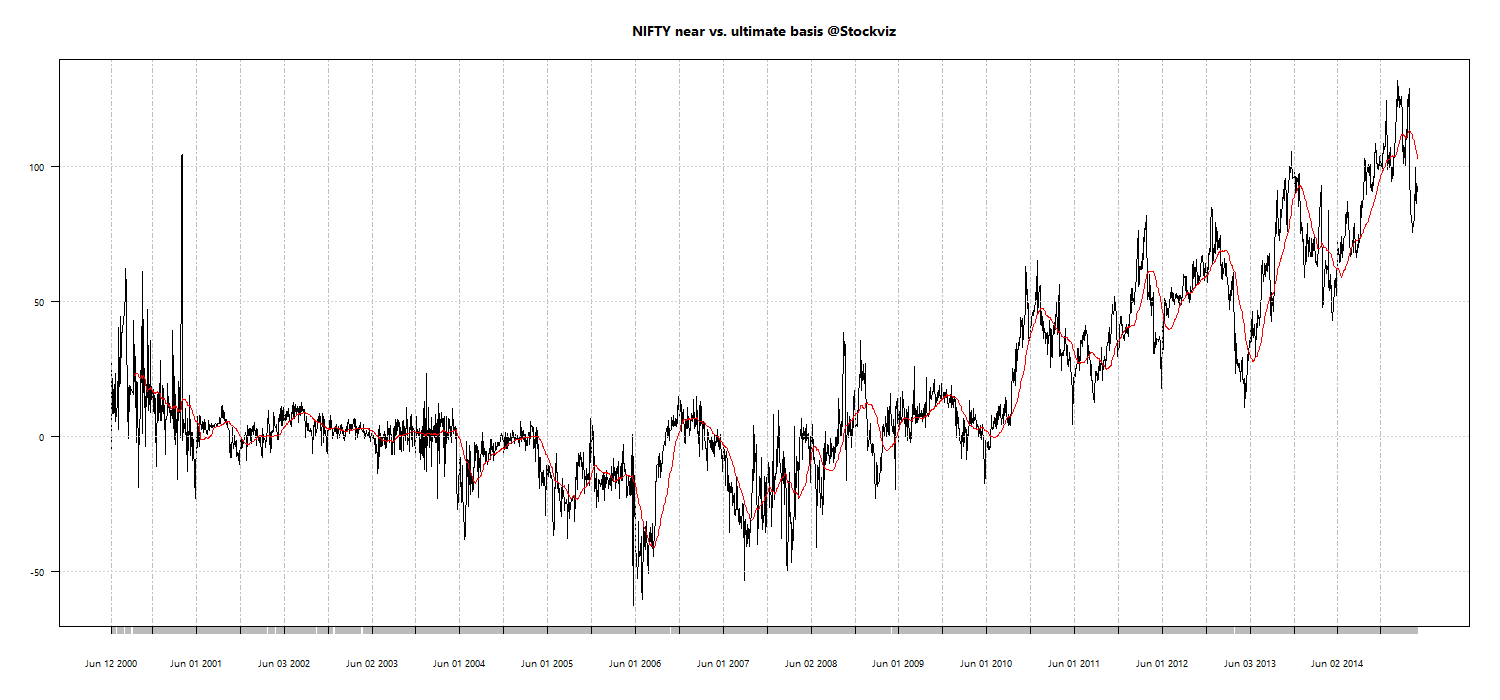
The basis is not stable and what’s worse, it appears to be trending. Lets try our simple trading rule: go long the basis if it is above 50-dma and short if otherwise.

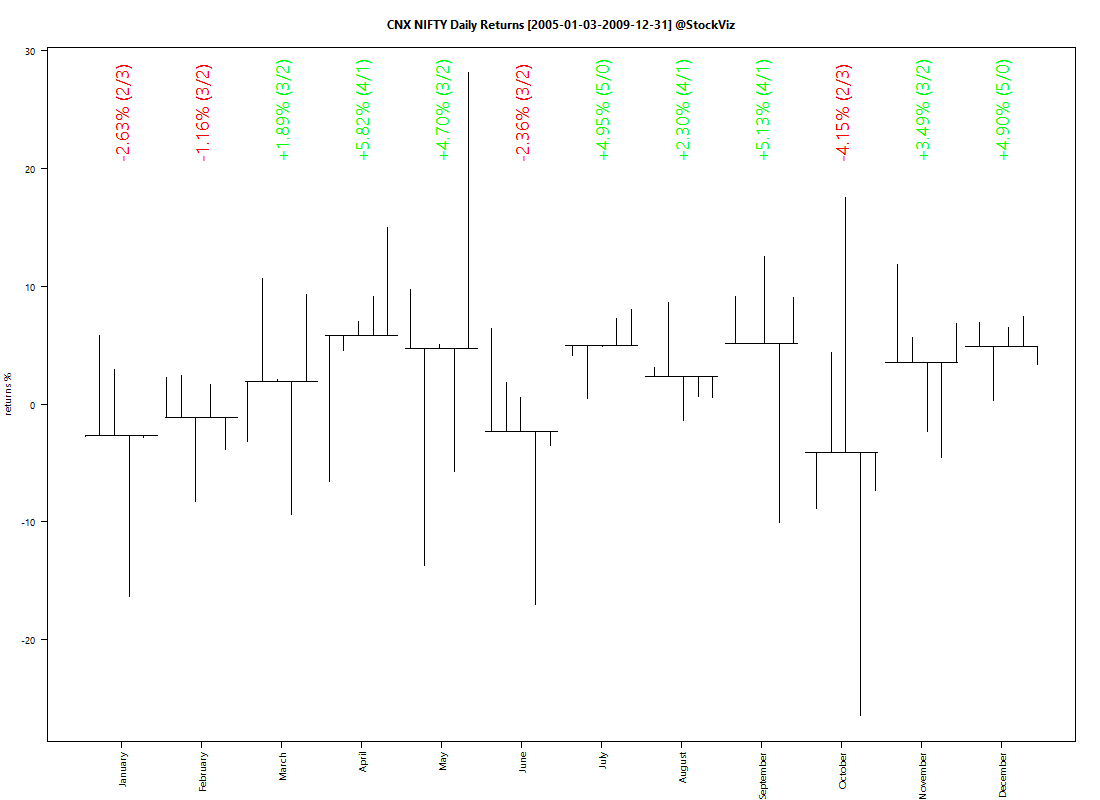
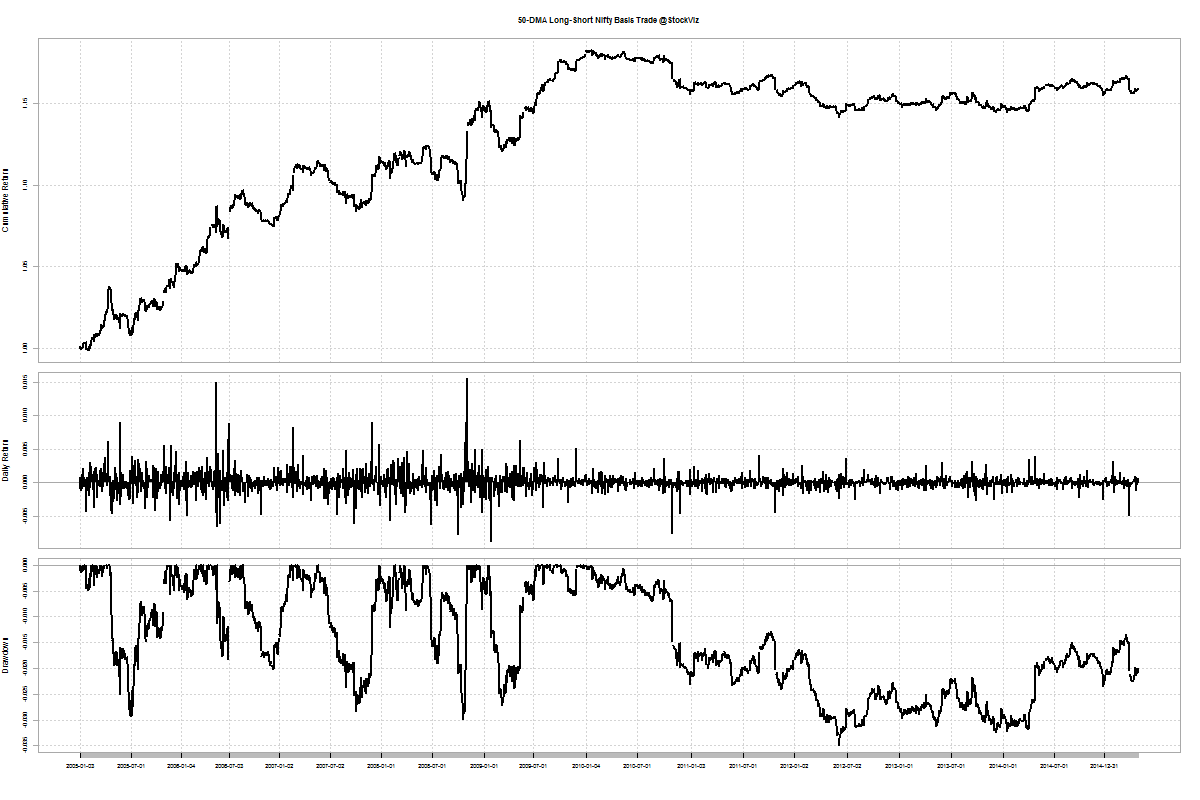
Here’s how the back-test works out (2005 through now):

NIFTY.futures.basis.50dma.trade.2005

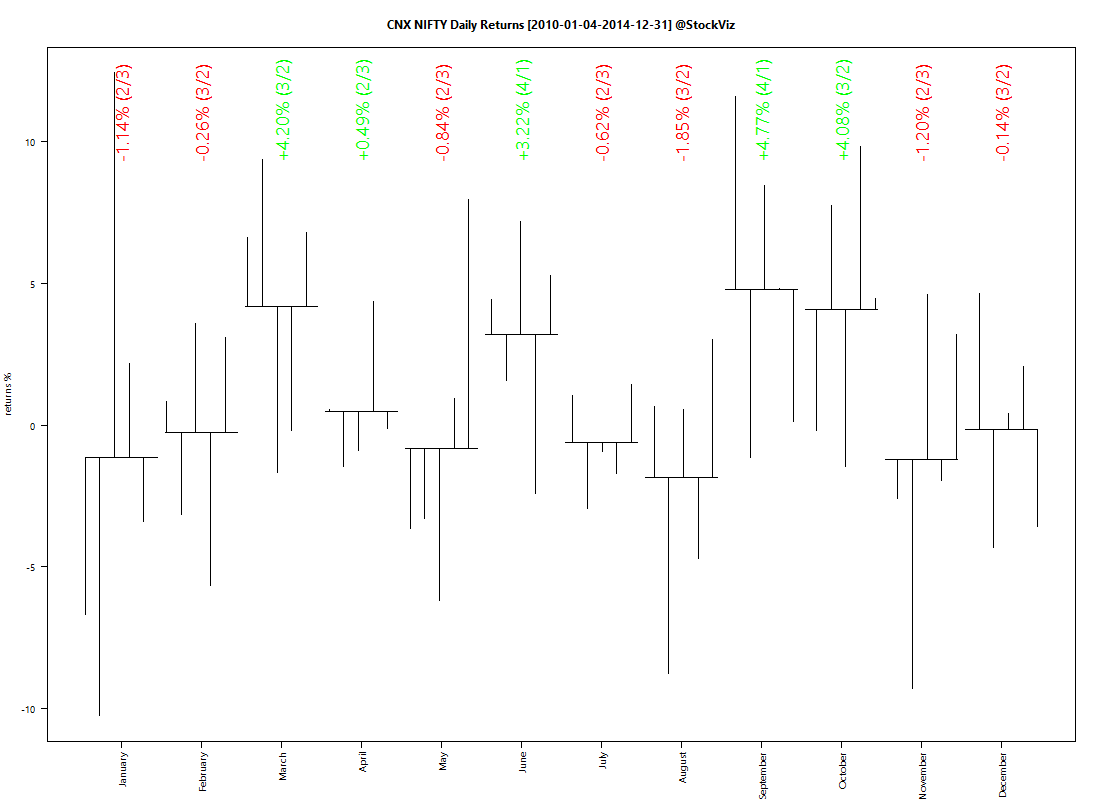
Lets check the back-test on a smaller subset (2010 through now):

NIFTY.futures.basis.50dma.trade.2010

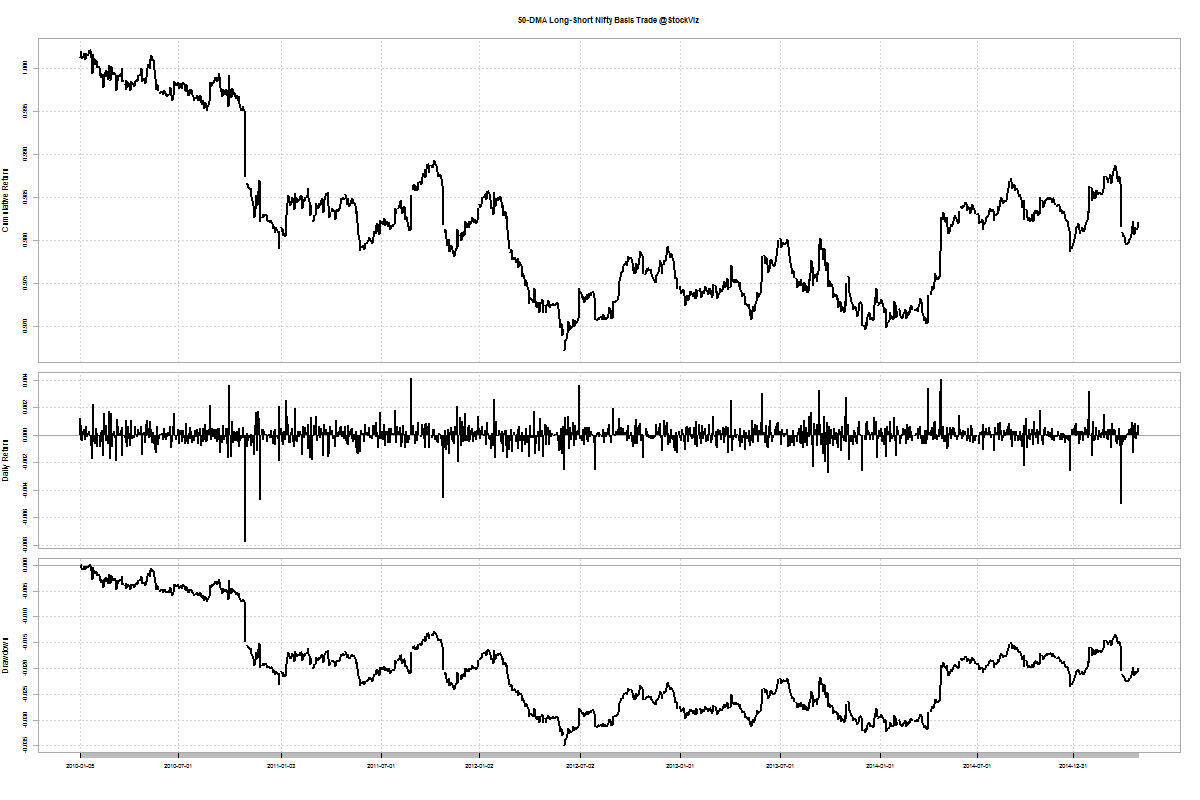
A ~20% profit in a 10 year time-frame is barely enough to cover transaction costs. Besides, it looks like the strategy hit a wall in 2010.

Conclusion

It appears that the basis trade described above is not profitable enough after considering transaction costs and taxes. Also, whatever meager profits were there seem to have been arbitraged away lately.

Long-Short Trend Following

Prior Work

We had discussed the SMA On/Off Switch and its ability to escape the worst days. Based on this finding, we setup a Tactical Theme that would go long NIFTYBEES and JUNIORBEES if the CNX 100 index is trading above its 50-day SMA and move into LIQUIDBEES otherwise.

What if, we could go long and short?

Naive Long-Short

Here’s how going long above 50-DMA and short below 50-DMA on the CNX 100 since 2001 compares:

CNX 100.02-Jan-2007.28-Apr-2015.long.short
Long-Short SMA (black), Long-Only SMA (red) and Buy & Hold (green)

It looks like going both long and short is not significantly better than a long-only tactical strategy.

Long-Short with Volatility

But what if, we add a volatility metric into the mix? The logic here is that corrections are preceded by a bout of volatility. So if you go short if either or the volatility signal or the 50-DMA indicates a negative bias and long otherwise:

CNX 100.02-Jan-2007.28-Apr-2015.long.short.volatility
Long-Short SMA w/ Volatility (black), Long-Only SMA w/ Volatility (red), Long-Only SMA (green) and Buy & Hold (blue)

It looks like there is significant alpha in the combination approach.

Long-Short NIFTY and BANKNIFTY

NIFTY returns since 2001:
CNX NIFTY.01-Jan-2001.28-Apr-2015.long.short.volatility

And the same for the BANK NIFTY since 2006:

CNX BANK.12-Jan-2006.28-Apr-2015.long.short.volatility

NIFTY and BANKNIFTY since 2011:

CNX NIFTY.03-Jan-2011.28-Apr-2015.long.short.volatility

CNX BANK.03-Jan-2011.28-Apr-2015.long.short.volatility

NIFTY and BANKNIFTY since 2013:

CNX NIFTY.01-Jan-2013.28-Apr-2015.long.short.volatility

CNX BANK.01-Jan-2013.28-Apr-2015.long.short.volatility
Long-Short Combo (black), Long-Only Combo (red), Long-Only Tactical (green) and Buy & Hold (blue)

Conclusion

It appears that there is long-term alpha in using a combination of volatility and 50-DMA to implement a long-short strategy. To put this to test using real-time data, we have created a theme to make it easy for you to follow along: Trend Long-Short.

Nifty Correlations

It is useful to visualize the correlations of returns between individual stocks in an index. If correlations are high, betting on the index as a whole could be more profitable compared to picking single stocks. Low correlations, on the other hand, is a stock-picker’s dream. Here’s how the NIFTY correlations stack up.

One year daily returns

cnx nifty correlations.2014-1-1

One month daily returns

cnx nifty correlations.2014-12-1

A lot of thick blue squares mean that positive correlations are high. Red squares mean negative correlations are high. Whites are the doldrums.

We plan to update these on a weekly basis.