Tag: ETF

Of GURUs and MOATs

If we had to point to one financial innovation that upended classical asset management over the last decade, it would be Exchange Traded Funds (ETFs.) At first, there were a handful of them. They were pure market cap weighted funds that mirrored a popular broad market index, the S&P 500 index for example. But over the last decade, the number of ETFs and the strategies they allow investors to access have exploded. Currently, there are over 2,200 ETFs listed in the US. Most of them are cap-weighted, some are “smart-beta”, some are traditional momentum/value, etc. But there are a few of them that are completely bonkers. Here are two of them.

The GURU ETF

Hedge funds, in the US, are supposed to disclose their holdings that cross a certain threshold to the SEC. The GURU ETF parses those filings and creates a portfolio of “highest conviction” ideas. From its website:

GURU allows everyday investors to access the high conviction investments of some of the largest, most sophisticated hedge funds in the world. Traditionally, investing with a hedge fund requires paying an ongoing 2% management fee and 20% of profits. GURU has an expense ratio of 0.75%, potentially allowing for greater cost efficiency, while providing access to hedge fund ideas.

On the face of it, it is a ridiculous idea. Hedge funds are much more than just long-only equity. Besides, the filings are done months after those funds have built a position in those stocks. So surely, it should be a disaster?

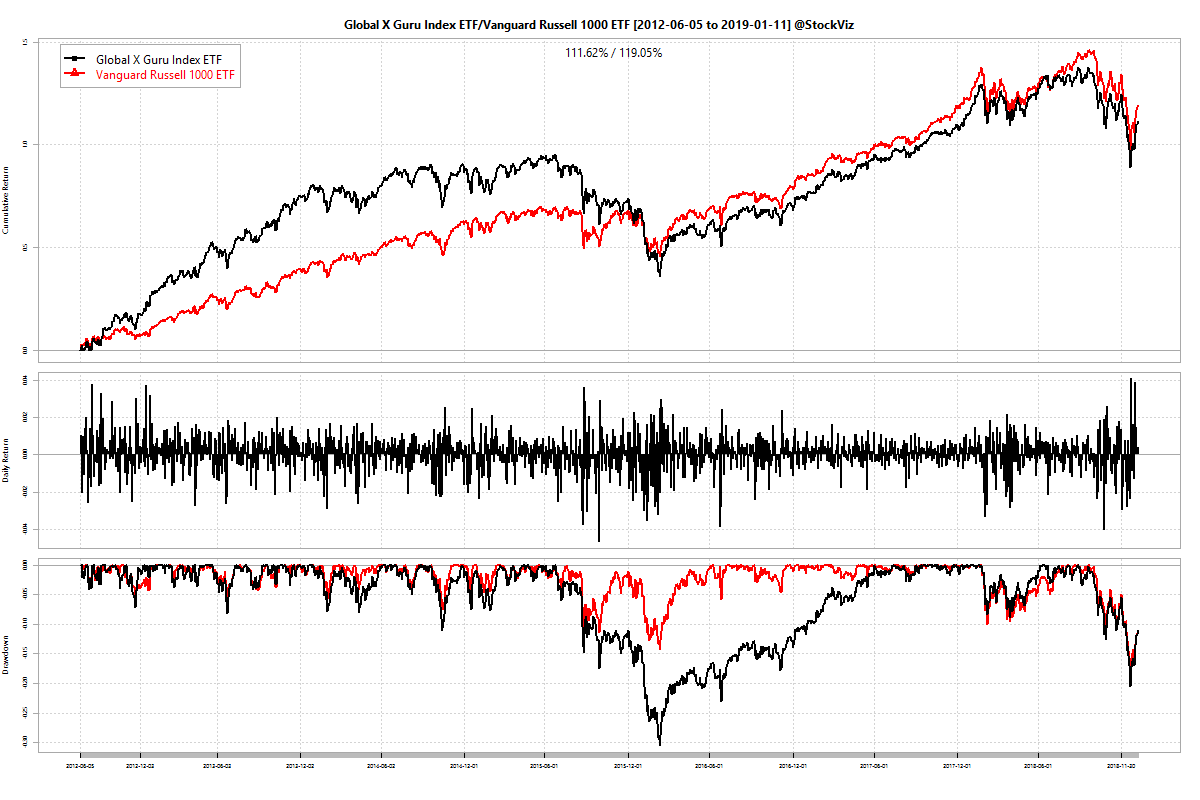
Compared to the broad-market Russell 1000 ETF from Vanguard, it is not so bad. Annualized returns for GURU and VONE were 12.09% and 13.40%, respectively. It seems to have out-performed initially then suffered a deep drawdown from which it staged a middling recovery. Is it a case of the rising tide of a bull market lifting all boats? Can’t say.

We still don’t like the idea but turns out that it was not a very bad one.

The MOAT ETF

All value investors ever want are “attractively priced companies with sustainable competitive advantages.” MOAT promises that for 48bps. Surely, it can’t be that obvious?

Annualized returns for MOAT and VONE were 12.73% and 11.67%, respectively. Back in May 2018, Elon Musk thought “moats are lame.” Not so lame, it turns out.

Epilogue

There are strong reasons for Indian investors to open a US brokerage account and diversify their holdings into dollar assets. ETFs in the US are cheap and cover a wide array of investment strategies – there are at least two for every one that you can think of. Make you move now!

Charts above were created using our Compare Tool. Check it out.
Momentum: Peek under the hood before you invest

Quantitative momentum investing is fairly new in India. To compare different strategies, you need real-world data spanning a complete cycle. The best proxy for this turns out to be US listed ETFs – they have one price (unlike mutual fund share classes) and their adjusted prices can be easily downloaded. Here, we take a look at two momentum ETFs, DWAQ and MTUM, to highlight why investors should go beyond just running a screen for “momentum” and investing in whatever comes up first.

DWAQ vs. QQQ

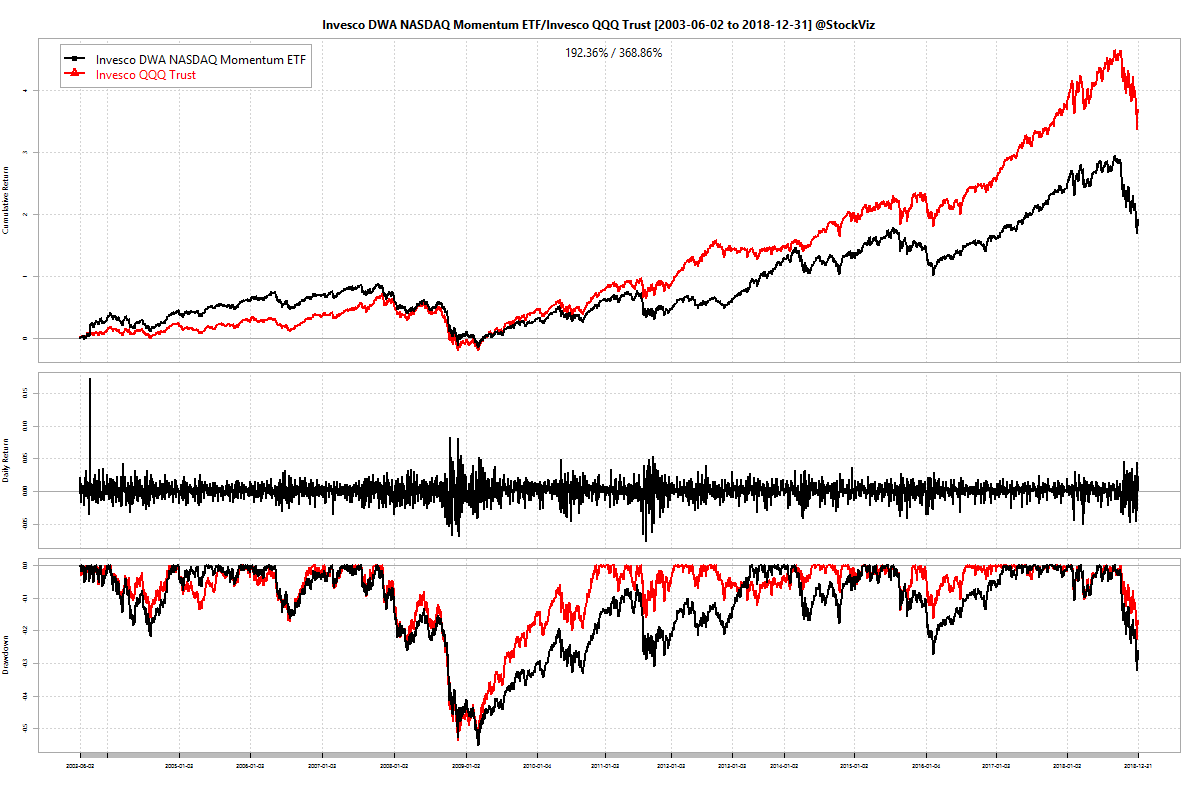
DWAQ, the Invesco DWA NASDAQ Momentum ETF, was listed back in May 2003. QQQ is a plain vanilla market cap ETF based on the Nasdaq-100 Index. Here are the descriptions from their issuer websites:

The Invesco DWA NASDAQ Momentum ETF is based on the Dorsey Wright® NASDAQ Technical Leaders Index. The Index is comprised of approximately 100 securities from an eligible universe of approximately 1,000 securities of large capitalization companies from the NASDAQ US Benchmark Index. All securities in the universe are ranked using a proprietary relative strength (momentum) measure. Each security’s score is based on intermediate and long-term price movements relative to a representative market benchmark and the other eligible securities. The top 100 securities are selected for the Index. (Invesco)

The Invesco QQQ is an exchange-traded fund based on the Nasdaq-100 Index®. The Index includes 100 of the largest domestic and international nonfinancial companies listed on the Nasdaq Stock Market based on market capitalization. (Invesco)

Here are their relative returns:

Not the torch bearer for momentum that we had hoped for.

MTUM vs. VONE

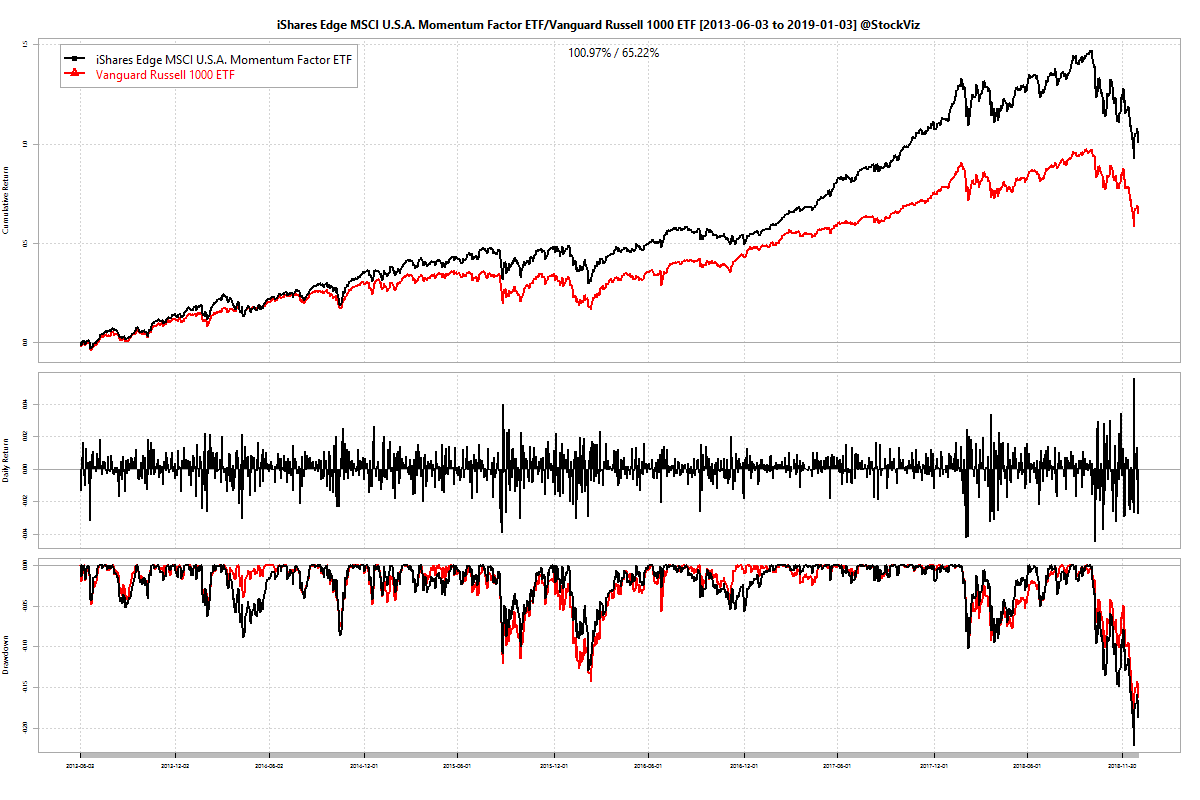
MTUM, the iShares Edge MSCI USA Momentum Factor ETF, came a good 10 years after DWAQ. Not constrained just to the Nasdaq, it provides wider exposure to large- and mid-cap U.S. stocks exhibiting relatively higher price momentum. (iShares) It is only fair that we compare it to VONE, which is Vanguard’s Russell 1000 ETF. Russell 1000 covers most of the US large- and mid-cap universe. (Vanguard)

Here are their relative returns:

Not bad! That’s almost a 4% difference in annualized returns.

MTUM vs. DWAQ

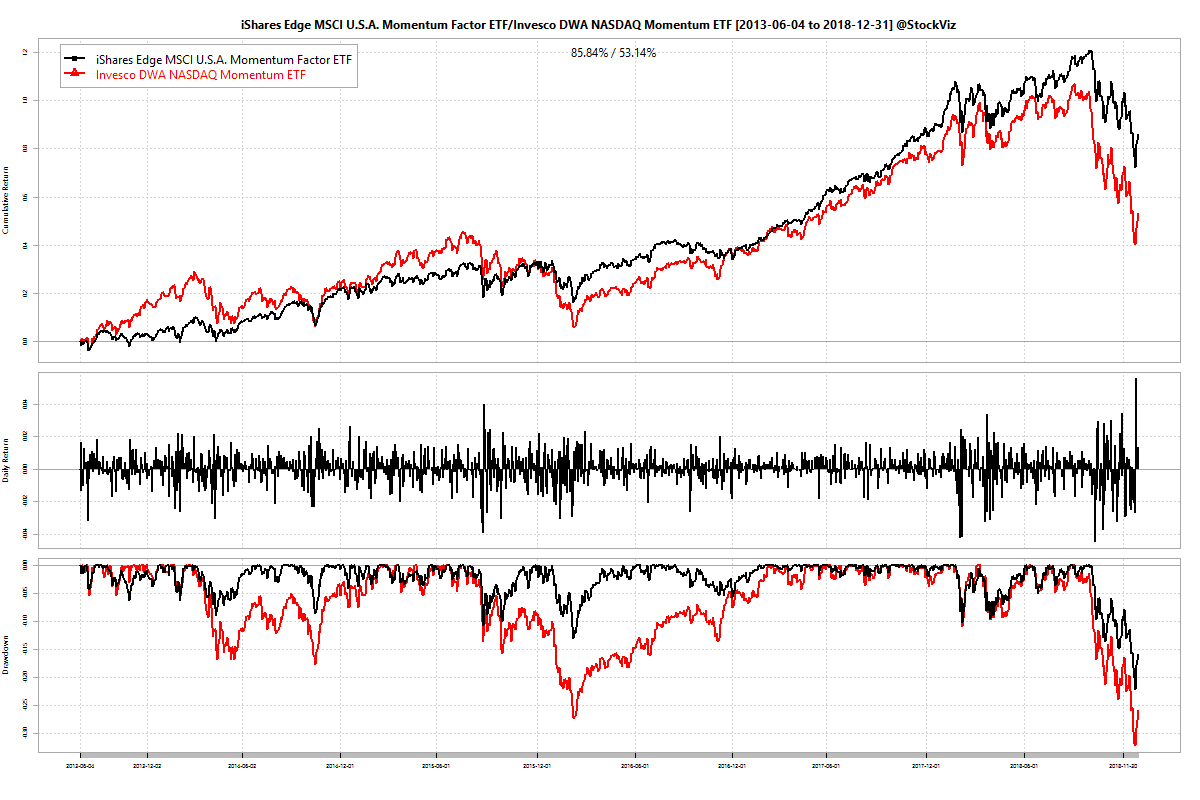
DWAQ trailed MTUM by about 5% in annualized returns for the period. Probably because it has a more diversified portfolio compared to MTUM’s. This should have lead to shallower drawdowns but that is not the case – DWAQ returns are a lot more volatile than MTUM’s. Will MTUM’s volatility adjusted price momentum continue to out-perform DWAQ’s “proprietary relative strength” momentum? Who knows?

If you think it is a tough job deciding between the two, consider this: there are over 40 momentum ETFs currently listed in the US. Each one slices the data a bit differently, making it absolutely essential that you peek under the hood before you click that buy button!

Charts created using the StockViz Compare Tool.

ETF Premium/Discount to NAV

Every Exchange Traded Fund (ETF) in India has a mutual fund counterpart. From a regulatory point of view, only mutual fund asset management companies can setup ETFs and an ETF is a special type of mutual fund that happens to trade on a stock exchange. This dynamic allows us to compare ETF closing prices (or last prices, pick your poison) with the corresponding mutual fund NAV to gauge the premium or discount that the ETF is trading at the exchange over the fund.

The calculation is fairly straightforward, it is simply CLOSE/NAV-1. A positive number implies that the ETF is trading at a premium. A negative implies a discount.

Imagine a scenario where you buy an ETF when it is trading at a premium, say, 5%. Suppose the index that it is supposed to track is up 5% and you decide to bank it. You open up your trading terminal and Whoa! The price of the ETF has barely moved. This is because the premium has collapsed and has taken your paper profits along with it.

Think 5% is too much of a difference? Think again. Here is a box plot of the premium/discount of various ETFs over the last year:
mf etf premium discount of closing prices BOX plot
The red dots on the charts are outliers. The black line in the middle is the average. Ideally, you want the box to be narrow with no red dots.

The differences cannot be explained away by the popularity of the underlying indices. For example, have a look at NIFTYBEES (from Reliance) and NIFTEES (from Edelweiss.) They both track the tremendously popular NIFTY 50 index but only the former has decent volumes and hews closer to NAV.

Also, the premiums/discounts vary widely. EQ30 is a glaring example of how widely off the mark an ETF could trade.

Investors who use ETFs to create asset allocation portfolios should be especially aware of this phenomenon. A rebalance could very well wipe out mark-to-market profits if it doesn’t take this into account. Moreover, this is not something that is typically modeled in backtests.

Here is a chart of the daily premium/discount over the last one year for the ETFs used in our EQUAL-III Theme:
EQUAL III portfolio premium/discount

Forewarned is forearmed!

Code and charts are on github.

Replacing Mutual Funds with ETFs

Last month, we took a stab at measuring a fund’s alpha over a basket of ETFs (link.) The rationale was that the index often chosen by the mutual fund is not easily accessible to the investor. We saw how mutual fund alpha varies over time. We then asked the question: What if we just invested in the basket instead of buying the fund?

We did a study of the top 10 equity mutual funds by AUM back in March-2011 and found that 4 out of 10 funds under-performed their ETF baskets and 2 out of 10 funds could be replaced by an ETF basket without compromising too much on returns. That is, only 4 out of 10 fund out-performed the ETF basket setup for them.

The code, inputs and results are on github.