Tag: backtest

SMA Strategies, Part II

In Part I we saw how a simple tactical strategy that can be implemented by ETfs out-performs an actively managed mutual fund even after transaction costs. However, there are more than a million ways to implement an SMA strategy. Everything from picking the lookback period, cross-overs and enveloping are all open questions. There is no single “best” way to do it. Here, we add a simple check that makes sure that the SMA is trending higher before going long.

Quite simply, for an N-day SMA, we compare Nth-day to N/2th-day. If it is higher, then we go long.

Cumulative returns

NIFTY 50

NIFTY%2050

NIFTY MIDCAP 100

NIFTY%20MIDCAP%20100

NIFTY SMLCAP 100

NIFTY%20SMLCAP%20100

Take-away

The gross returns are lower than the “raw” strategy that we saw in Part I. However, the drawdowns for the 10-day SMA are a lot shallower. Shallower drawdowns allow a bit of leverage to be employed. This could be a good starting point for a NIFTY futures trading strategy.

In Part III, we look at how cross-over strategies perform.

Code and charts are on github.

SMA Strategies using ETFs

A simple moving average of an index is nothing but the average of closing prices of that index over a specified period of time. We did a quick backtest to see how an SMA based toggle between going long an index vs. cash performed.

Cumulative returns

NIFTY 50

NIFTY%2050

NIFTY MIDCAP 100

NIFTY%20MIDCAP%20100

NIFTY SMLCAP 100

NIFTY%20SMLCAP%20100

Feasibility

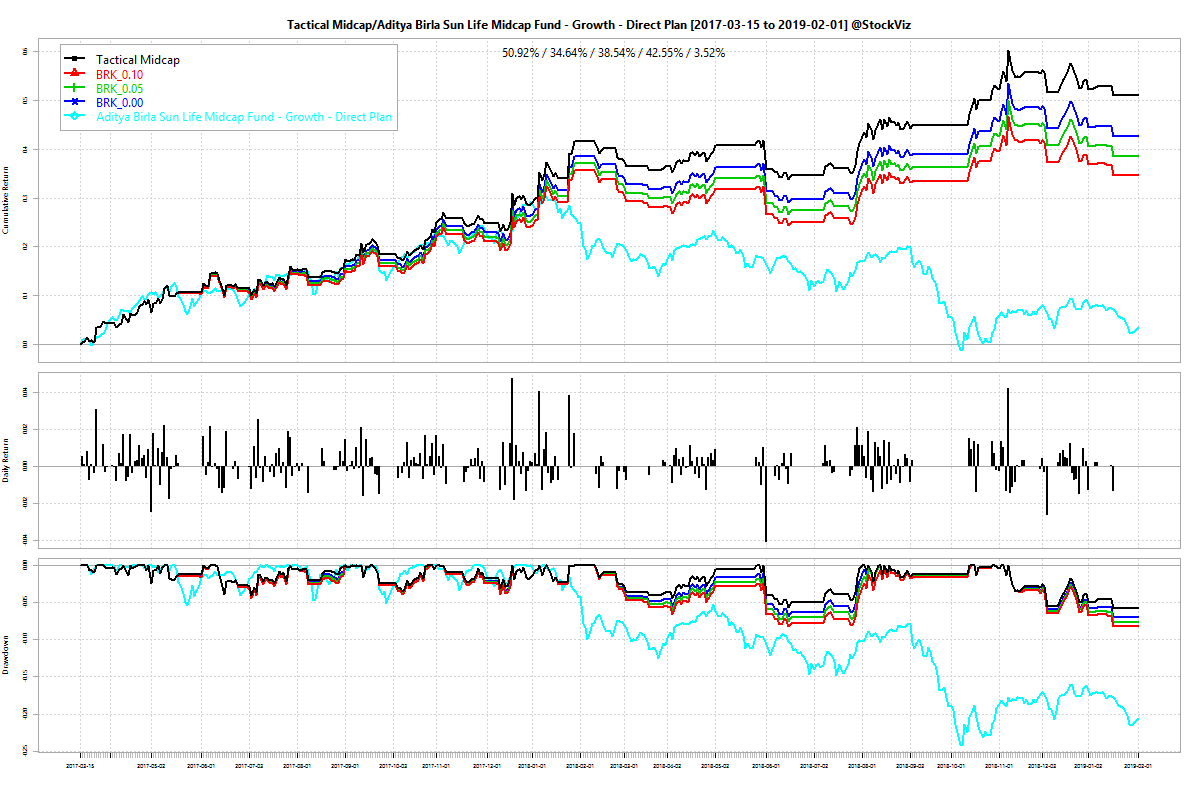
The backtest, unsurprisingly, shows that shorter the SMA look-back period, better the performance. However, the boost in performance comes at the expense of higher number of trades. Lower look-backs are only viable now thanks to brokerages where you would pay zero for these trades (however, you still pay the securities transaction tax.) To see how this would shake out in the real world, have a look at how our Tactical Midcap 100 Theme has performed in the last ~2 years:

The Theme used the M100 ETF (Motilal Oswal Midcap 100 ETF) with a 10-day SMA toggle to switch between the ETF and LIQUIDBEES. The blue line represents zero brokerage and 0.1% STT and the green line represents a brokerage of 5p and 0.1% STT. The chart shows it beating an actively managed midcap fund across all transaction fee scenarios.

The snag is that this strategy is tough to scale. The M100 ETF just doesn’t trade enough for this strategy to absorb more than Rs. 10 lakhs. And there is no small cap ETF on the horizon to implement the strategy in that space.

The second problem is that M100 trades to a wide premium/discount to NAV (see: ETF Premium/Discount to NAV.) This is another layer of risk that an investor could do without.

However, things seem to be moving in the right direction. Reliance Capital launched a new ETF recently that tracks the NIFTY MIDCAP 150 index. Their ETFs usually trade better – tighter spreads, narrower tracking errors, better liquidity. Hopefully, it will emerge as a stronger alternative to M100 and allow these strategies to scale. We setup the Tactical Midcap 150 Theme that uses the RETFMID150 ETF instead of the M100 ETF for those who are interested.

In Part II, we will see how adding a simple check on the SMA can reduce drawdowns.

Code and charts are on github.

Global Equities Momentum, Part IV

Our GEM backtest in Part III used a 12-month formation period to measure momentum. Here, we look at alternative formation periods with an eye on drawdowns.

6- through 12-month formation periods

GEM.6-12mo.cumulative

Even though the 10-month version has higher returns, the 6-month one has lower peak drawdowns.

The average of all

The problem with picking one formation period out of 6 is that it smells of data-mining. What happens if you average them all out?

GEM.avg.cumulative

The average works in reducing drawdowns compared to the traditional 12-month version.

GEM.avg.dd

GEM.m12.dd

We will setup a virtual portfolio for this “averaging” strategy and post the link here when it is up and running.

Code and more charts on github.

Global Equities Momentum, Part III

We saw in our earlier posts on Global Equities Momentum (Part I, Part II) that by swapping the momentum equivalent of the equity indices in the GEM decision tree, one could significantly boost returns. Also, momentum trumped value.

Correlation between momentum and base indices

In the original GEM dual momentum model, the S&P 500 index was used to decide and to trade. What we claim here is that we can continue to use the S&P 500 index to decide, but we will use the momentum equivalents to trade. To back our claim, we present the correlation in the monthly returns of the base/momentum index pairs:
SP500.USA-MOMENTUM.correlation
WORLD%20ex%20USA.WORLD%20ex%20USA%20MOMENTUM.correlation

The indices move pretty much in tandem.

Robustness

If dual momentum is robust, then our strategy piggybacks on its robustness through the decision tree. Where we differ is in the way we express the trade. And our backtest shows that GEM is superior to buying and holding the underlying indices themselves both in terms of returns and drawdowns:

USA%20MOMENTUM.WORLD%20ex%20USA%20MOMENTUM.GEM.cumulative

Annual returns:
USA%20MOMENTUM.WORLD%20ex%20USA%20MOMENTUM.GEM.annual

Instruments

Implementing this strategy is fairly straightforward. You need to track the following ETFs:

  • SPY: for S&P 500
  • BIL: for US T-bills
  • IDEV: World ex-US
  • MTUM: US Momentum
  • IMTM: World ex-US Momentum
  • AGG: Aggregated bond

You will be long one of the last three ETFs above at any given point in time:
USA%20MOMENTUM.WORLD%20ex%20USA%20MOMENTUM.GEM.instruments

We will setup a virtual portfolio for this strategy and post the link here when it is up and running.

Code and more charts on github.

Global Equities Momentum, Part II

In our previous post on Global Equities Momentum, we explored how we could potentially replace the indices used in the GEM decision tree with their momentum counterparts to boost returns. Corey Hoffstein (@choffstein) pointed out that given the excess turnover of momentum strategies, measuring their trend maybe adding too much noise. Also, could using value indices, given their lower turnover, make more sense?

We setup the following backtest to fix the first problem and explore the second.

  1. We will use the S&P 500 index to make the first decision of the GEM model: Should we invest in equities or bonds?
  2. Once we get past #1, we will use different sets of indices to make the next one: USA or ex-USA? And trade the same.
  3. We will use the MSCI USA PRIME Value index to represent US Value and MSCI ACWI ex USA PRIME Value index and MSCI WORLD ex USA PRIME Value index, in turn, to represent international value.

USA/All World ex-USA Value GEM
USA/All World ex-US Value GEM

USA/Developed World ex-USA Value GEM
USA/Developed World ex-US Value GEM

  1. The GEM models both show vastly better returns and shallower drawdowns compared to buying and holding the underlying indices alone.
  2. There is not a lot of difference between the two GEM models.
  3. However, there are no equivalent ETFs for investors interested in implementing either of these GEM models.

In contrast, USA Momentum/MSCI World ex-USA Momentum:
USA Momentum/MSCI World ex-USA Momentum

Not only does the momentum GEM vastly outperform the value GEMs, it can be easily implemented with the MTUM and IMTM etfs.

Before jumping into any of these strategies, it is worth asking: Is this just data mining? How can we be sure that these backtests are statistically valid? By the same token, how can we be sure that even the dual-momentum model is robust? Gary Antonacci’s GEM backtest goes as far back as 1971 but we only have MSCI index data starting from 1995 or later. Besides, we are not sure if it is even possible to construct a reasonable momentum index going that far back. So, caveat emptor!

Code and more charts on github.