Tag: backtest

Simple Momentum

Michael Batnick, in his blog titled “Simple Momentum,” proposes a strategy that follows a simple rule:

If the S&P 500 outperformed 5-year U.S. treasury notes over the previous twelve months, invest 100% of this portfolio in the S&P 500 in the following month. If the 5-year U.S. treasury notes outperformed the S&P 500 over the previous twelve months, invest 100% of this portfolio in bonds in the following month.

It outperformed the S&P 500 with significantly lower drawdowns. Could the same strategy work with Indian indices? We took NIFTY 50 and MIDCAP 100 indices and paired it with the 5-10 year tenure gilts.

Returns

The strategy returns are significantly lower than a simple buy and hold. December 2004 through June 2018, the NIFTY 50 version of it under performed buy and hold by 6% and the MIDCAP 100 version by 34%. This is before transaction costs and taxes. Here are the cumulative return charts:
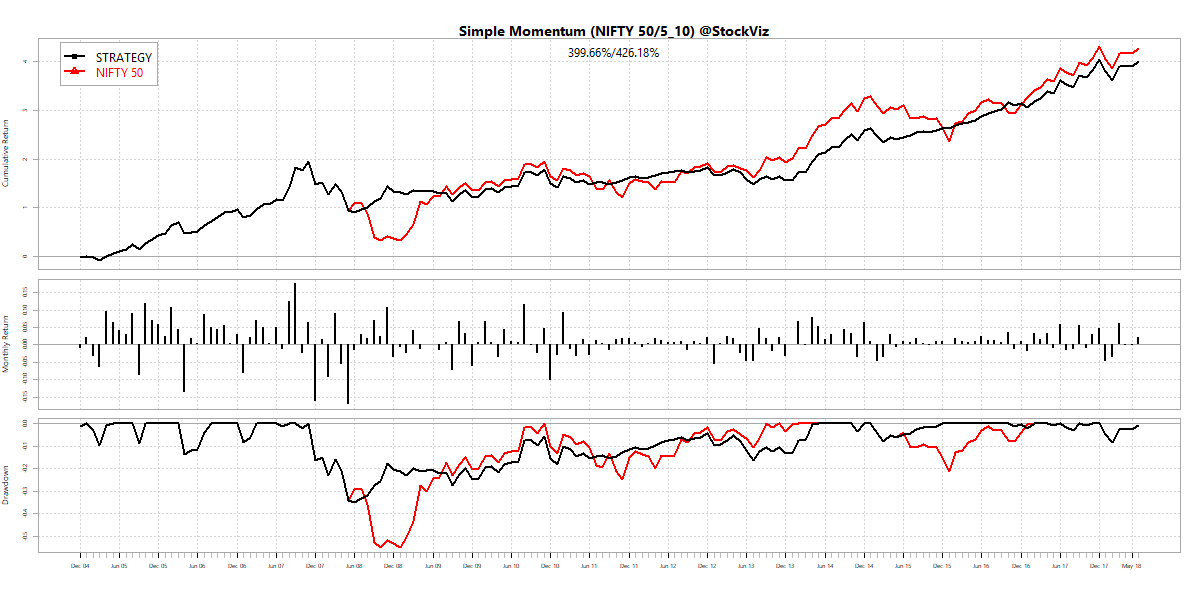
NIFTY 50 simple momentum

MIDCAP 100 simple momentum

Drawdowns

The simple momentum strategy did have lower peak drawdowns than a buy and hold:

NIFTY 50 simple momentum drawdowns

MIDCAP 100 simple momentum drawdowns

What keeps you out of the troughs also ends up keeping you out of the peaks. This is highlighted by how the strategy behaved in 2008 and 2009:

NIFTY 50 simple momentum annual returns

Conclusion

The simple momentum strategy is perhaps too simple. The backtest doesn’t capture transaction costs and taxes that would further ding the already lagging gross returns.

You can peruse the code and the charts used in this blog on github.
Basis Trades using Futures

Introduction

When we discussed cash-futures basis, it was pointed out that the fair value of a futures contract is a function of the underlying price, interest rates, dividends and time to expiration. The same logic applies to the fair value of contracts across expiration dates. For example, as of close on April 30, 2015, NIFTY futures contracts had the following values: 8177.35 (April), 8244.05 (May), 8275.30 (June).

Some of our clients wanted us to check if this basis can be traded. Is it possible to profit from going long the near contract and short the far contract on a consistent basis? Before we look at profitability, lets chart the basis.

The basis

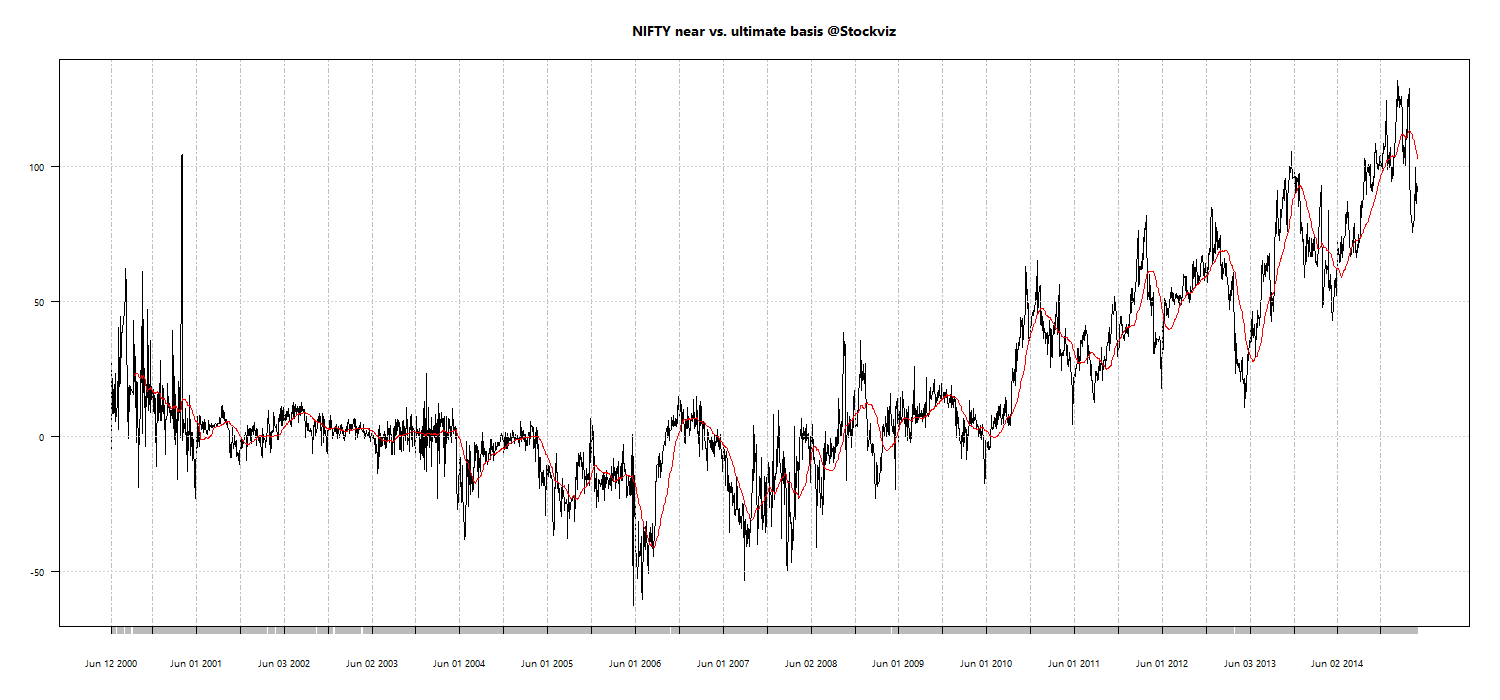
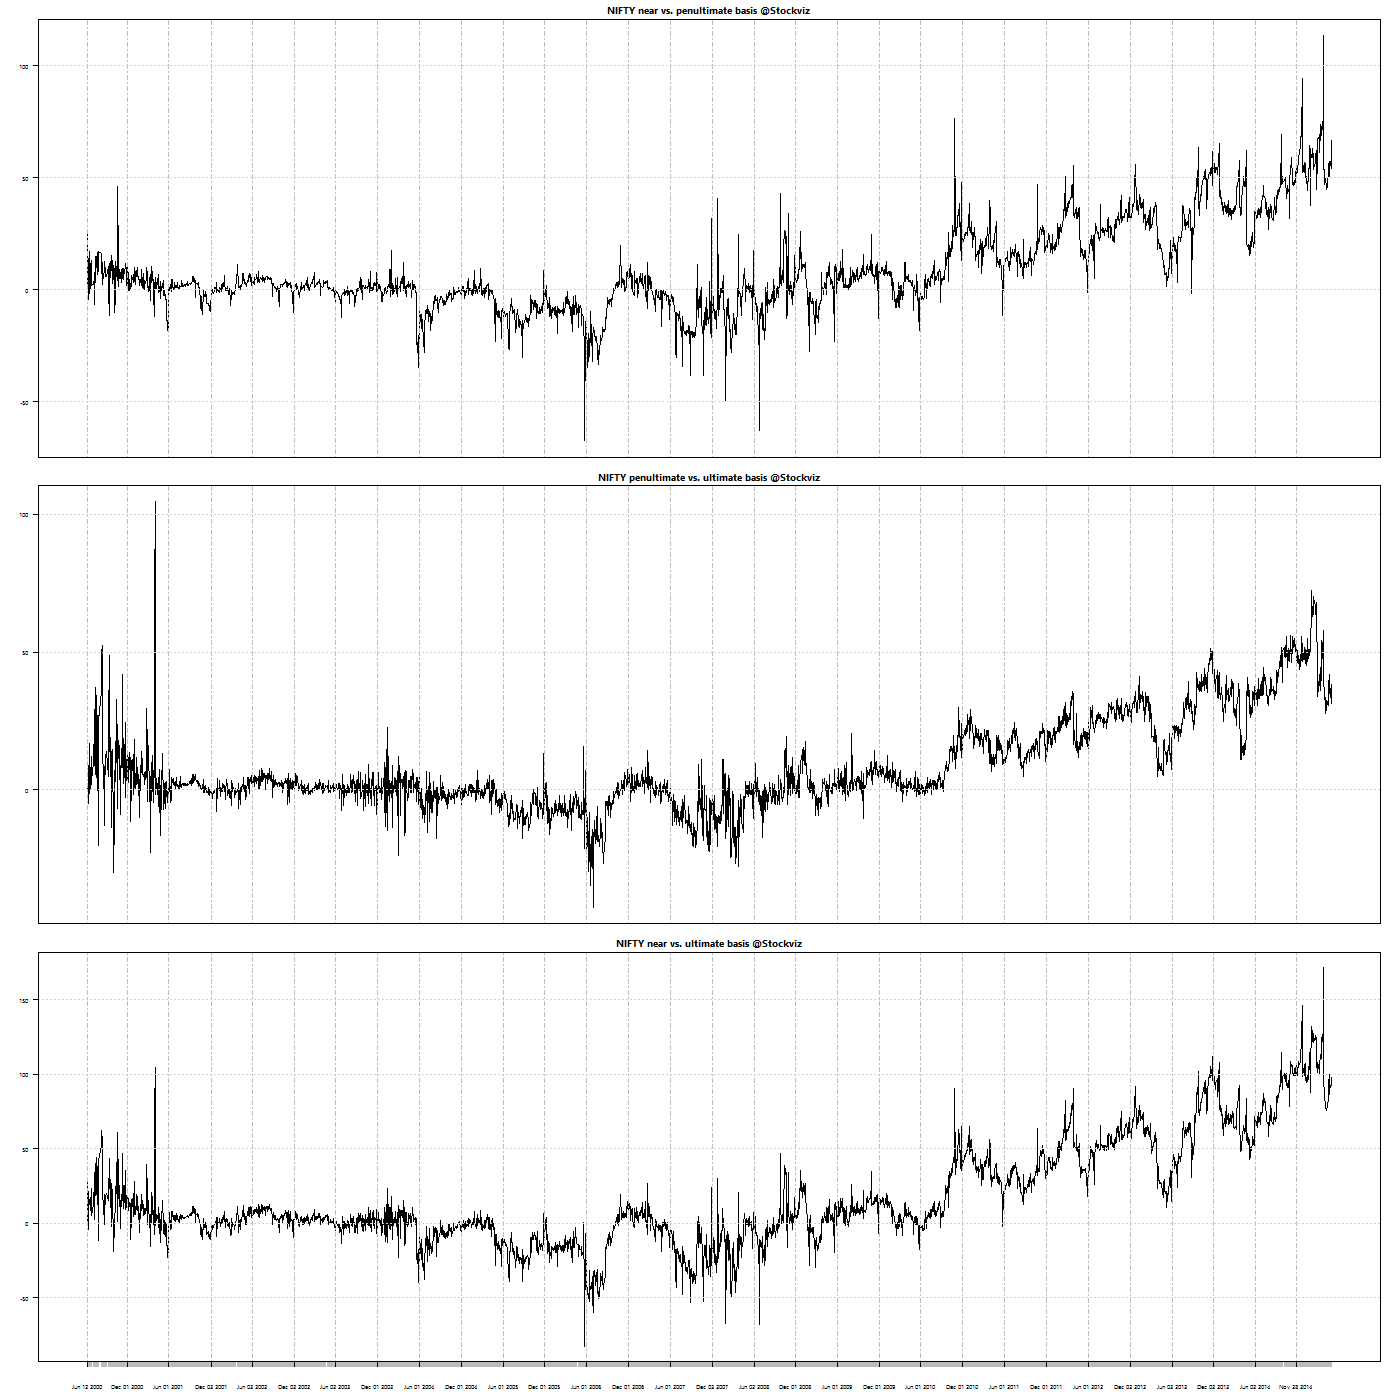
Here is how the basis between different contracts look (2000 through now):

NIFTY.futures.basis

Here is the summary statistic of the basis:

summary statistics

Here is the same data with futures expiry dates removed:

summary statistics

With the extreme values removed, we can now check if we can trade the nearest expiry contract with the farthest.

50-day Average Basis Trade Back-Test

Lets take a look at the Near vs. Farthest basis and draw a 50-dma through it:

NIFTY.futures.basis.50dma

The basis is not stable and what’s worse, it appears to be trending. Lets try our simple trading rule: go long the basis if it is above 50-dma and short if otherwise.

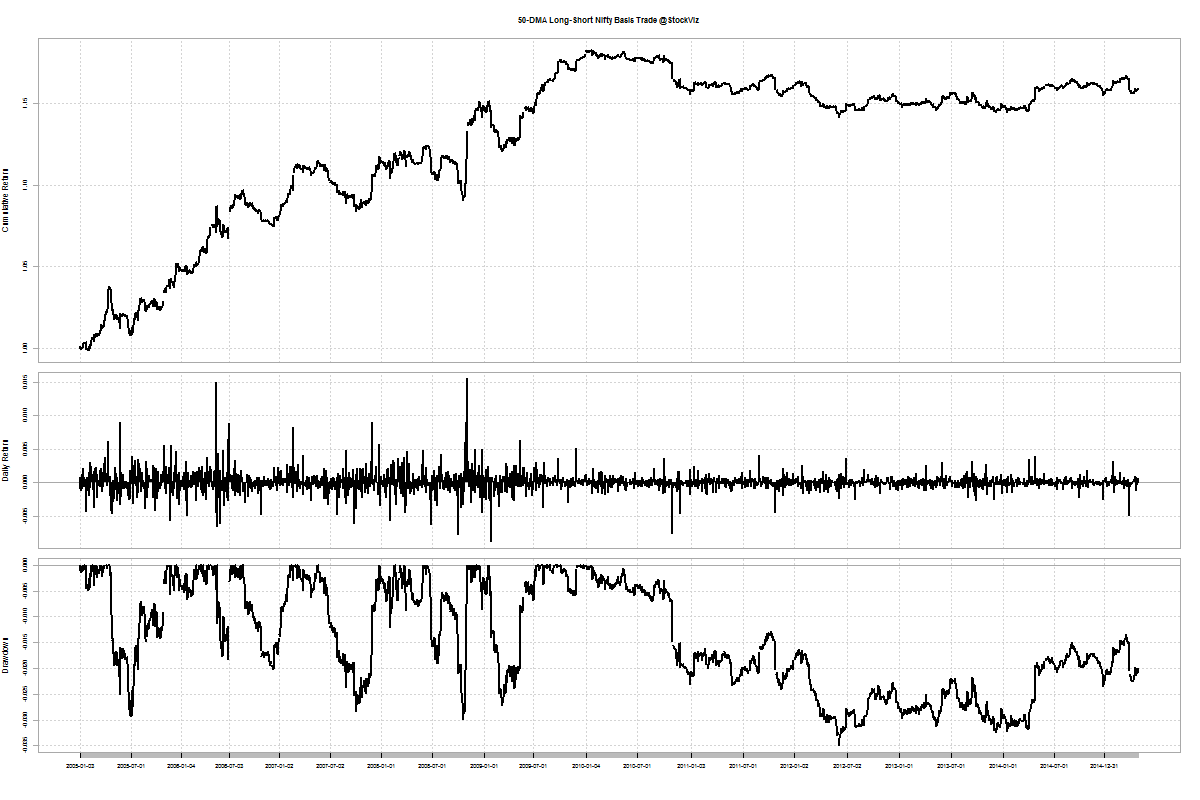
Here’s how the back-test works out (2005 through now):

NIFTY.futures.basis.50dma.trade.2005

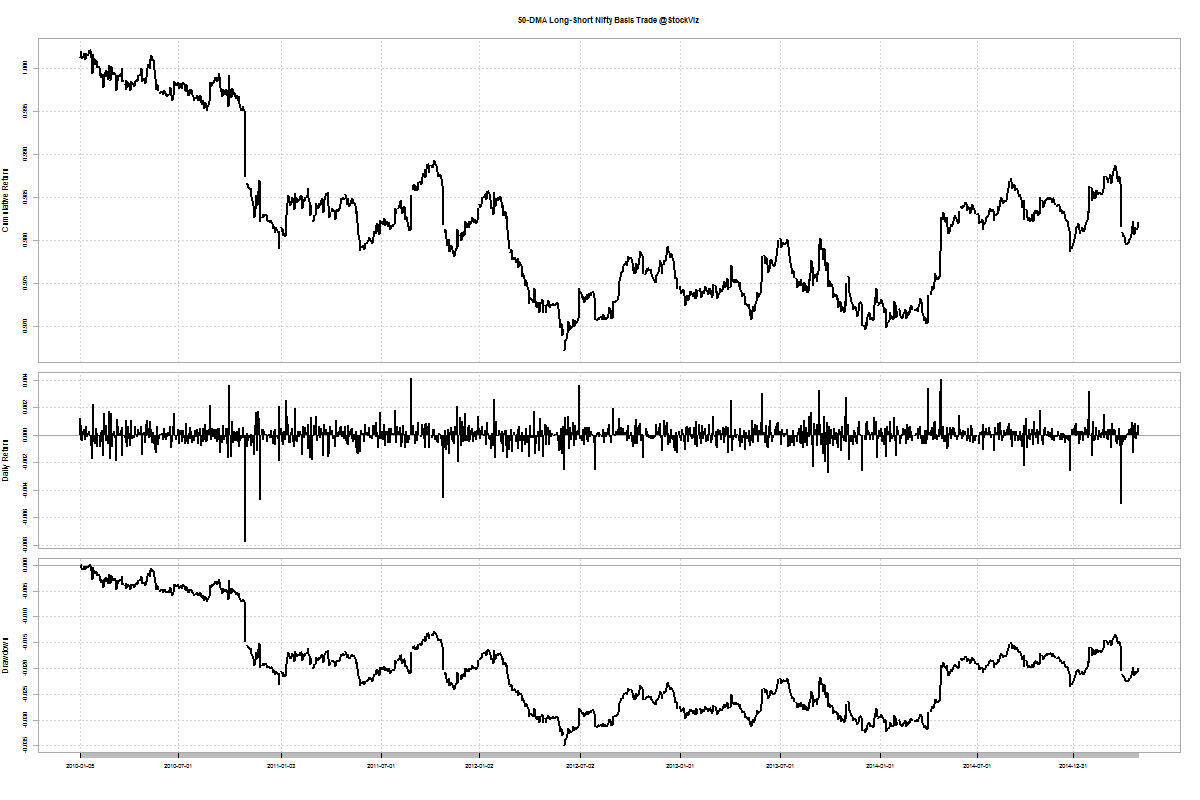
Lets check the back-test on a smaller subset (2010 through now):

NIFTY.futures.basis.50dma.trade.2010

A ~20% profit in a 10 year time-frame is barely enough to cover transaction costs. Besides, it looks like the strategy hit a wall in 2010.

Conclusion

It appears that the basis trade described above is not profitable enough after considering transaction costs and taxes. Also, whatever meager profits were there seem to have been arbitraged away lately.