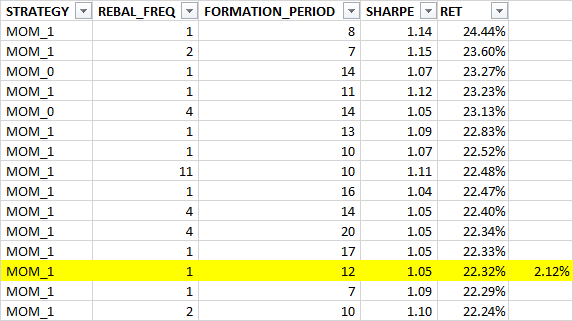
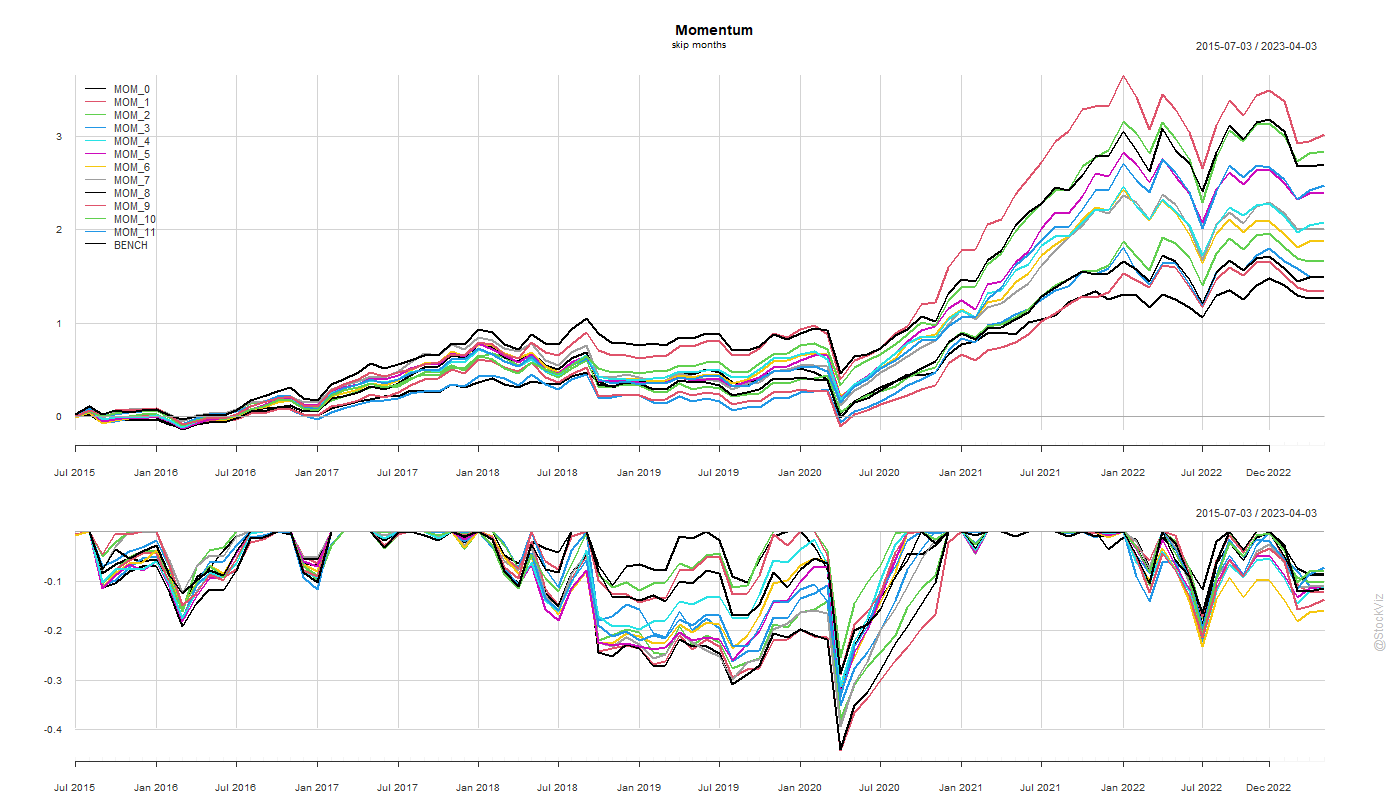
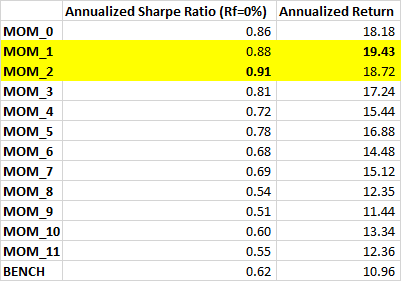
Previously, we looked at skip-months and rebalance frequencies for momentum portfolios. A 1-month skip & monthly rebalance turned out to be ideal. However, we did these analyses keeping the formation period the same at 12-months. What if we changed that as well?
Turns out, there is no single “ideal” formation period where all stats converge. However, if set the rebalance frequency to 1-month, the average of the formation periods of the top performing portfolios works out to 12-months.
If the momentum fund is large enough, then it could probably be sliced into multiple sub-portfolios, each with different configs to avoid this magic 12-month formation.
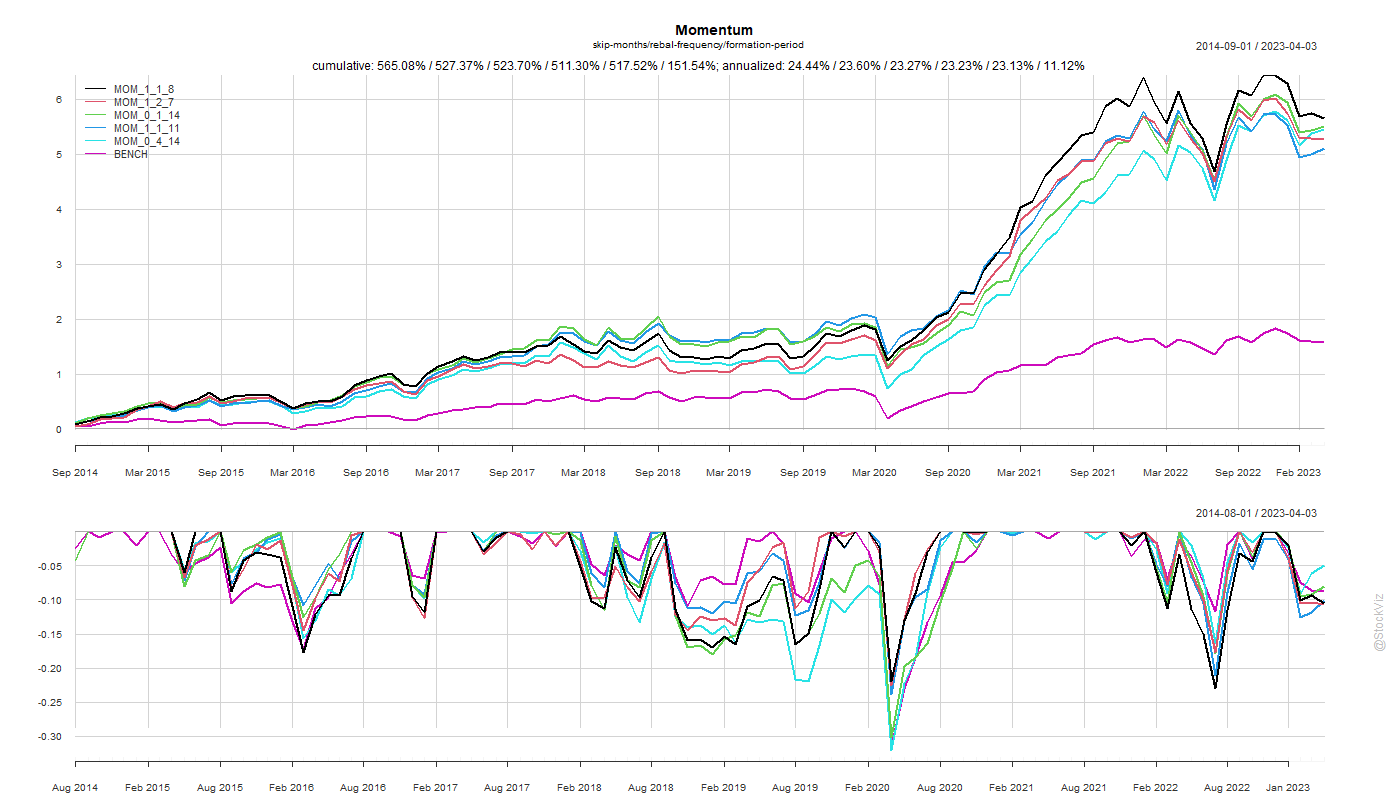
Also, since the underlying process creating these portfolios is the same, the equity curves come out all bunched together. There maybe differences in month-over-month performances but they are all highly correlated.
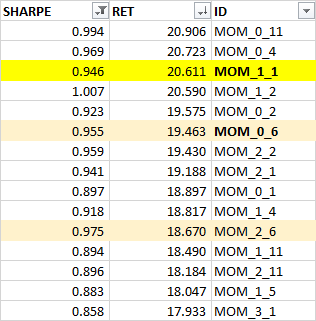
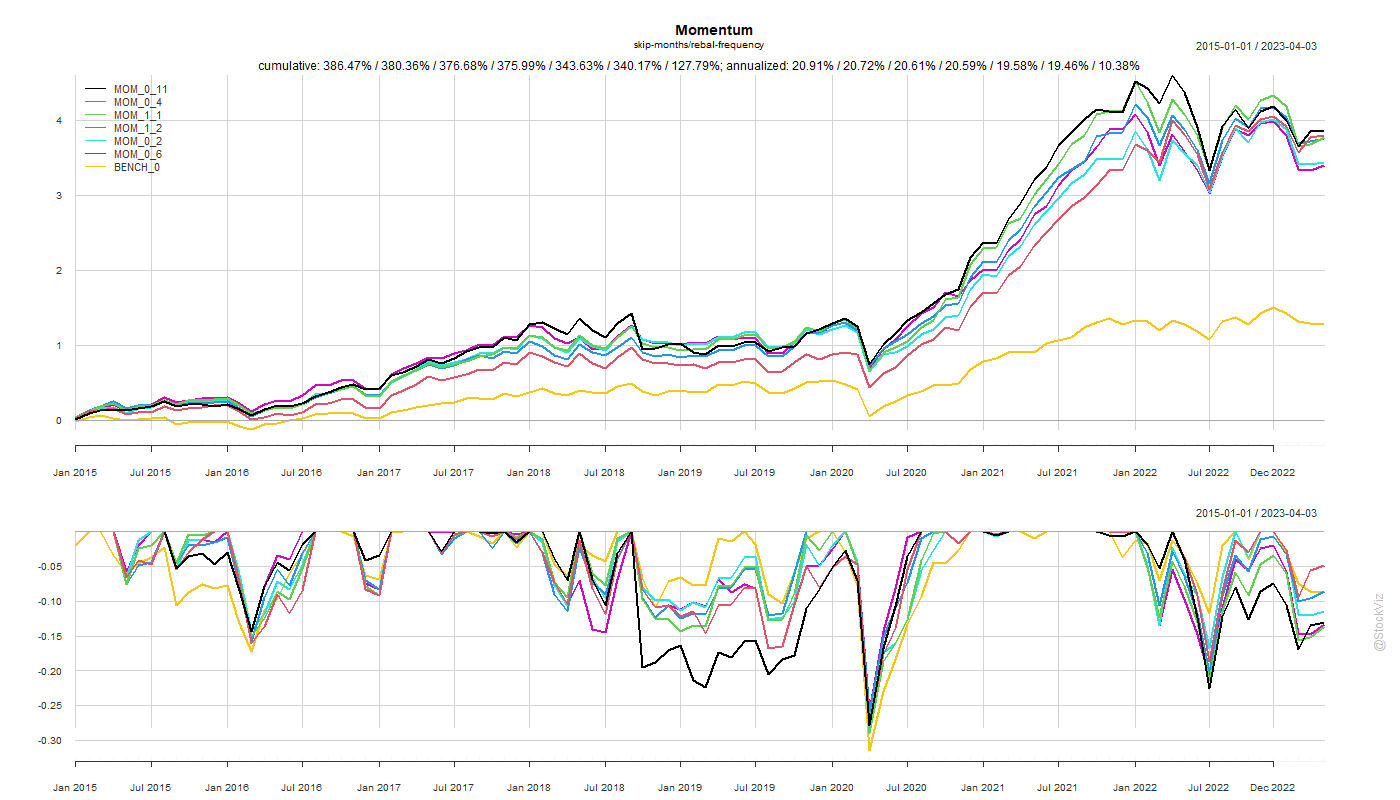
Previously, we found that the traditional 12_1 momentum configuration, where you look at the previous 12-month performance while skipping the most recent month and rebalancing every month, was indeed an ideal config (MOM_1_1). However, there are momentum index funds that rebalance once in 6-months (MOM_[0,1]_6). Is there any performance give-up if you rebalance infrequently?
Turns out that the traditional config is quantifiably better than others. However, there’s isn’t much of a performance give-up even if you rebalance once in 6-months (MOM_0_6).
Besides, the analysis here doesn’t factor in transaction costs which would be a bigger drag on the monthly rebalance config. When you add the tax-advantage and low-cost of index funds into the mix, the current crop of momentum index funds don’t look all that shabby.
The original Jegadeesh and Titman momentum paper (pdf) used a “skip month” to manage the reversal effect (quant.stackexchange). However, why is it one month and not two, or three or four?
Here’s what the equity curves of different skip month configs look like.
The “skip one month” is indeed a magical config. Also, if you are optimizing for Sharpe, skip two.
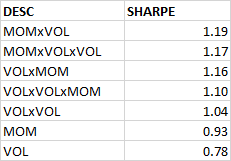
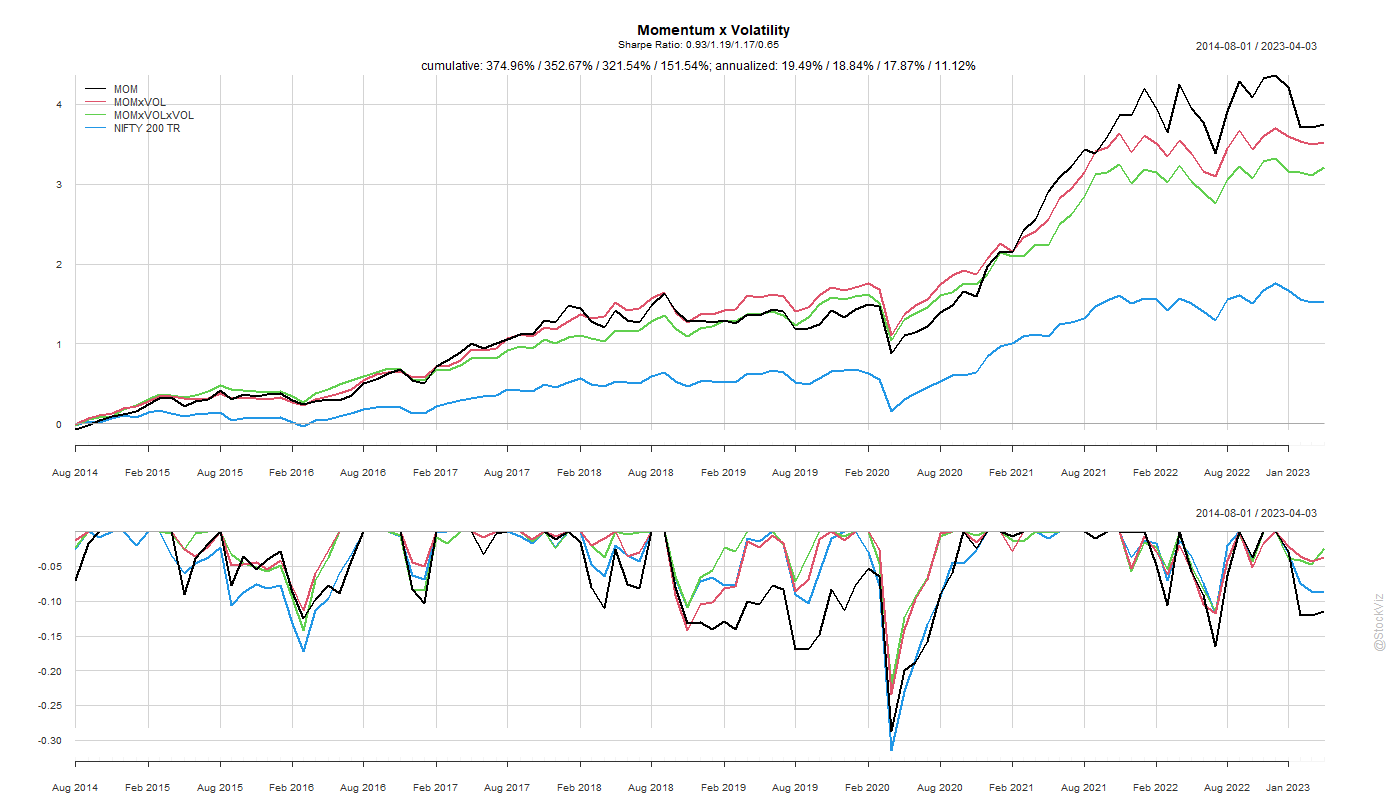
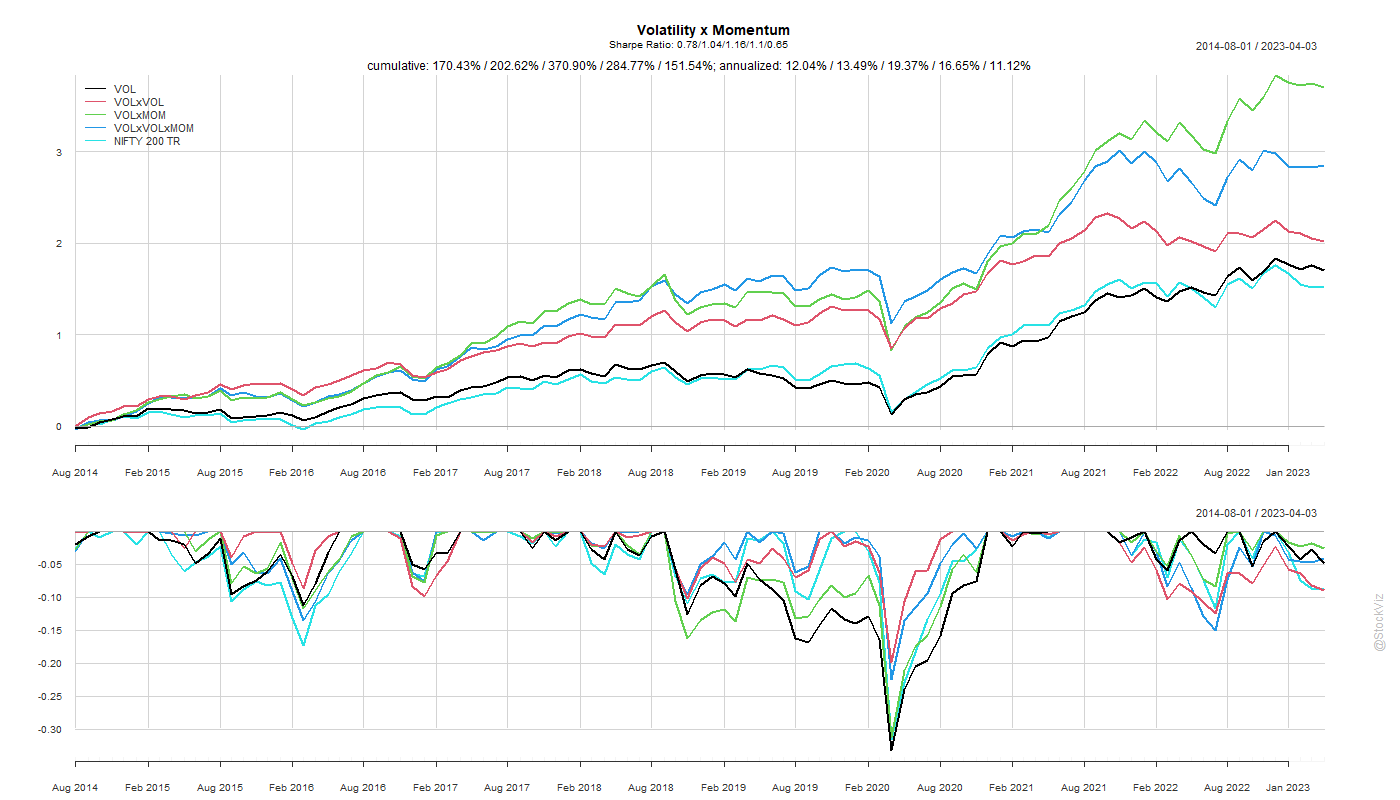
Momentum has proved to be the premier anomaly in different markets. And so has low-volatility. What happens if you combine both of them? Also, what if you also add low volatility of volatility into the mix?
There are a couple of ways to skin this cat. You can start with low-volatility and add momentum. Or, you could go the other way – start with momentum and then add a volatility sort.
tl;dr: go with low-volatility first, momentum second (VOLxMOM).
While a simple momentum sort gives the highest return, adding a low-volatility filter to it gets you a better risk-adjusted return.
The order of the sort – first volatility and then momentum or first momentum and then volatility – doesn’t seem to matter much for the Sharpe rankings but the former ended up with slightly better returns.
Trend-following systems typically use the past performance of a particular asset to trigger a buy or a sell on that asset. A research paper that came out in 2019 looked at whether the historical performance of multiple assets can be used to trade them.
Pitkäjärvi, Aleksi and Suominen, Matti and Vaittinen, Lauri Tapani, Cross-Asset Signals and Time Series Momentum (January 6, 2019). Available at SSRN: https://ssrn.com/abstract=2891434
From the abstract:
We document a new phenomenon in bond and equity markets that we call cross-asset time series momentum. Using data from 20 countries, we show that past bond market returns are positive predictors of future equity market returns, and past equity market returns are negative predictors of future bond market returns.
Unfortunately, the paper did not look at Indian markets to check if this worked. So, we rigged up a simple backtest to see for ourselves.
Rules
A simplified equity-bond cross-asset trading strategy at the beginning of month t can be constructed as follows: Compute the past 12-month equity return (E past) and the past 12-month bond return (B past). If:
a) E past is positive and B past is positive: Buy equity b) E past is negative and B past is negative: Sell equity c) E past is negative and B past is positive: Buy bonds d) E past is positive and B past is negative: Sell bonds e) Otherwise, invest in the risk-free rate. Hold the portfolio for one month and then repeat the same procedure in month t+1 (source.)
Backtest
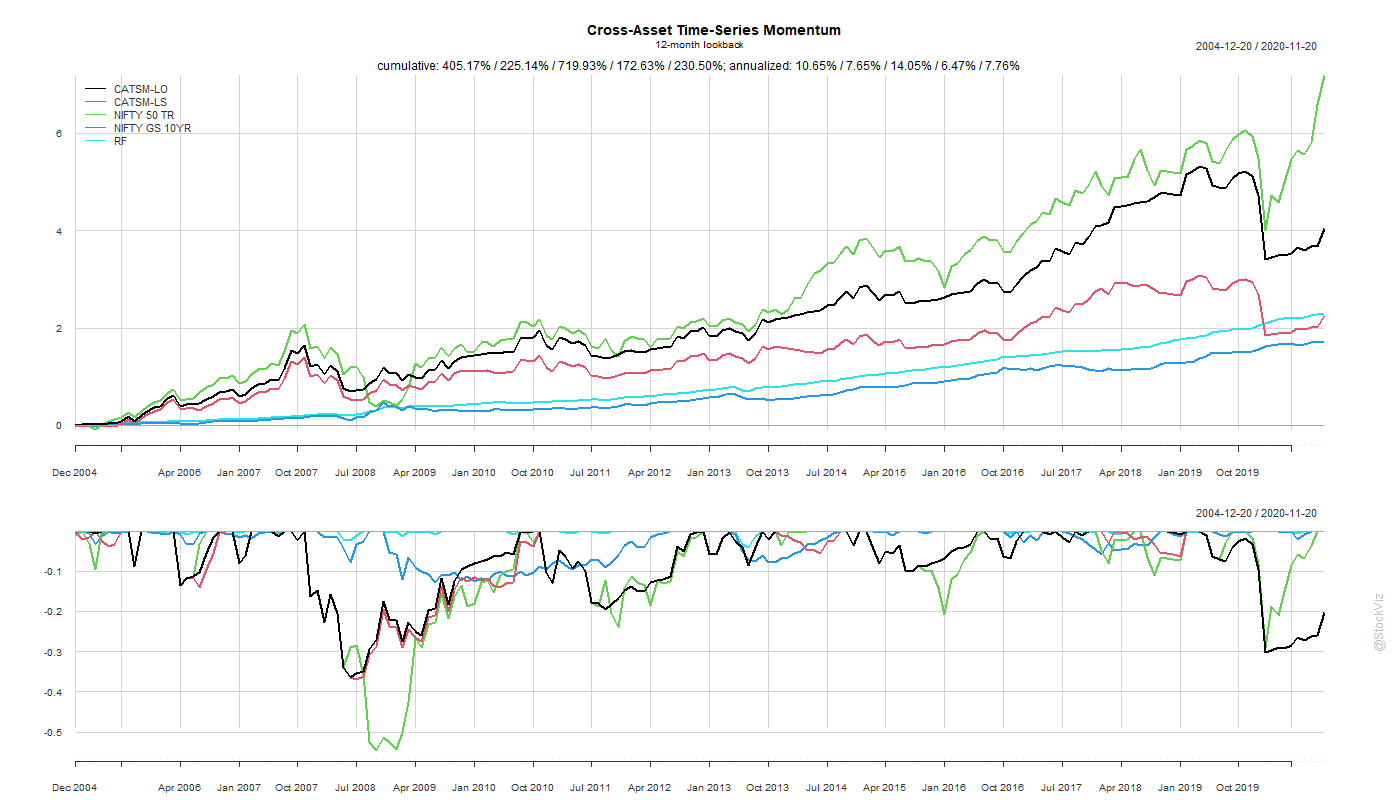
We used the NIFTY 50 TR index to represent equities, NIFTY GS 10YR index for bonds and the CCIL Index 0-5 TRI for risk-free rate.
Since our risk-free index starts only from 2004, our backtest only goes back 16 years. However, the markets have been through a lot since then, so it is unlikely we are losing much by not being able to go back much earlier.
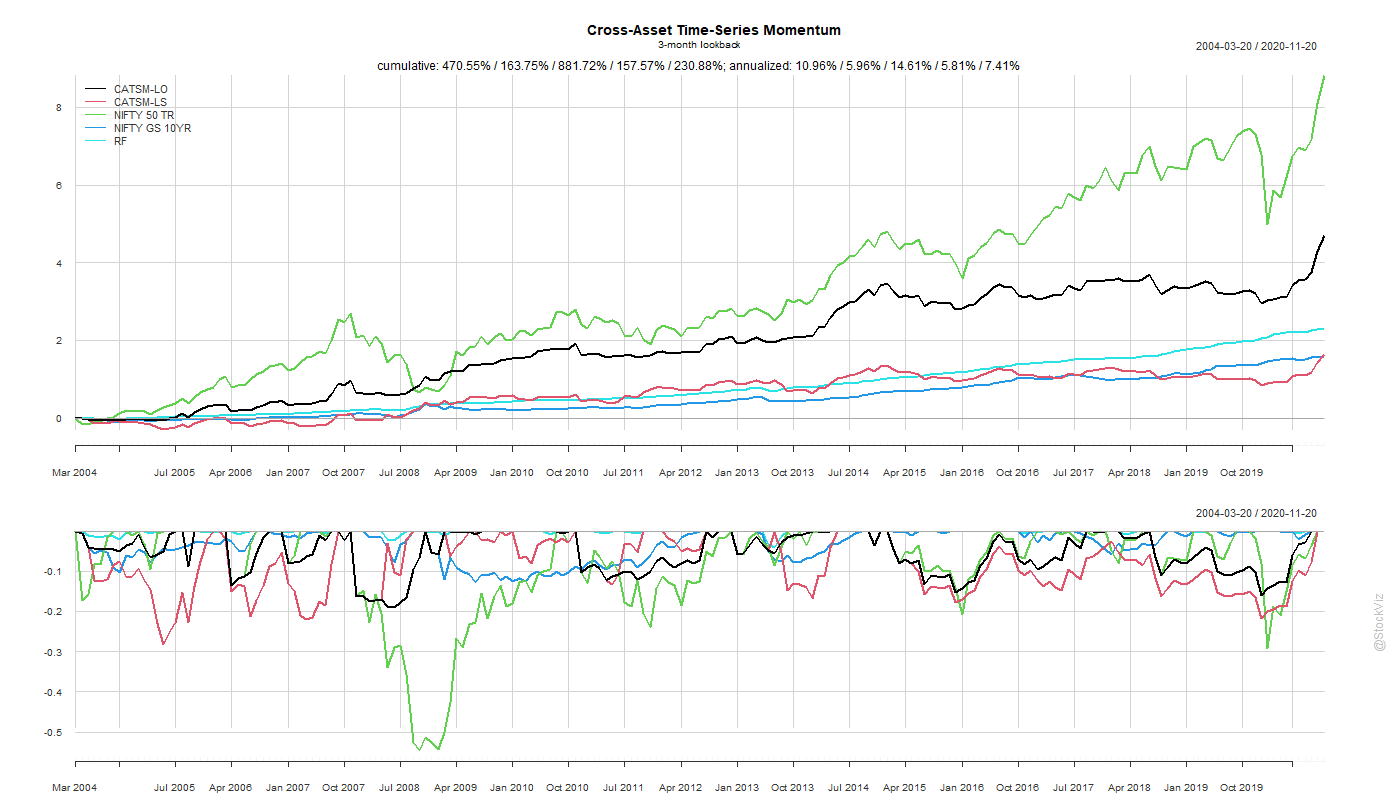
The 12-month look-back approach massively under-performs the NIFTY 50 TR buy-and-hold. We shortened the look-back to 3-months to see if we could make the strategy more responsive to trend reversals.
To our dismay, we saw only marginal improvements in overall returns but the draw-down profile of the long-only portfolio was much better.
Conclusion
While the approach outlined in the paper might be valid for the selected subset of markets, it fails a simple backtest on Indian market indices.