Tag: weekly

Correlation Update 19.09.2015

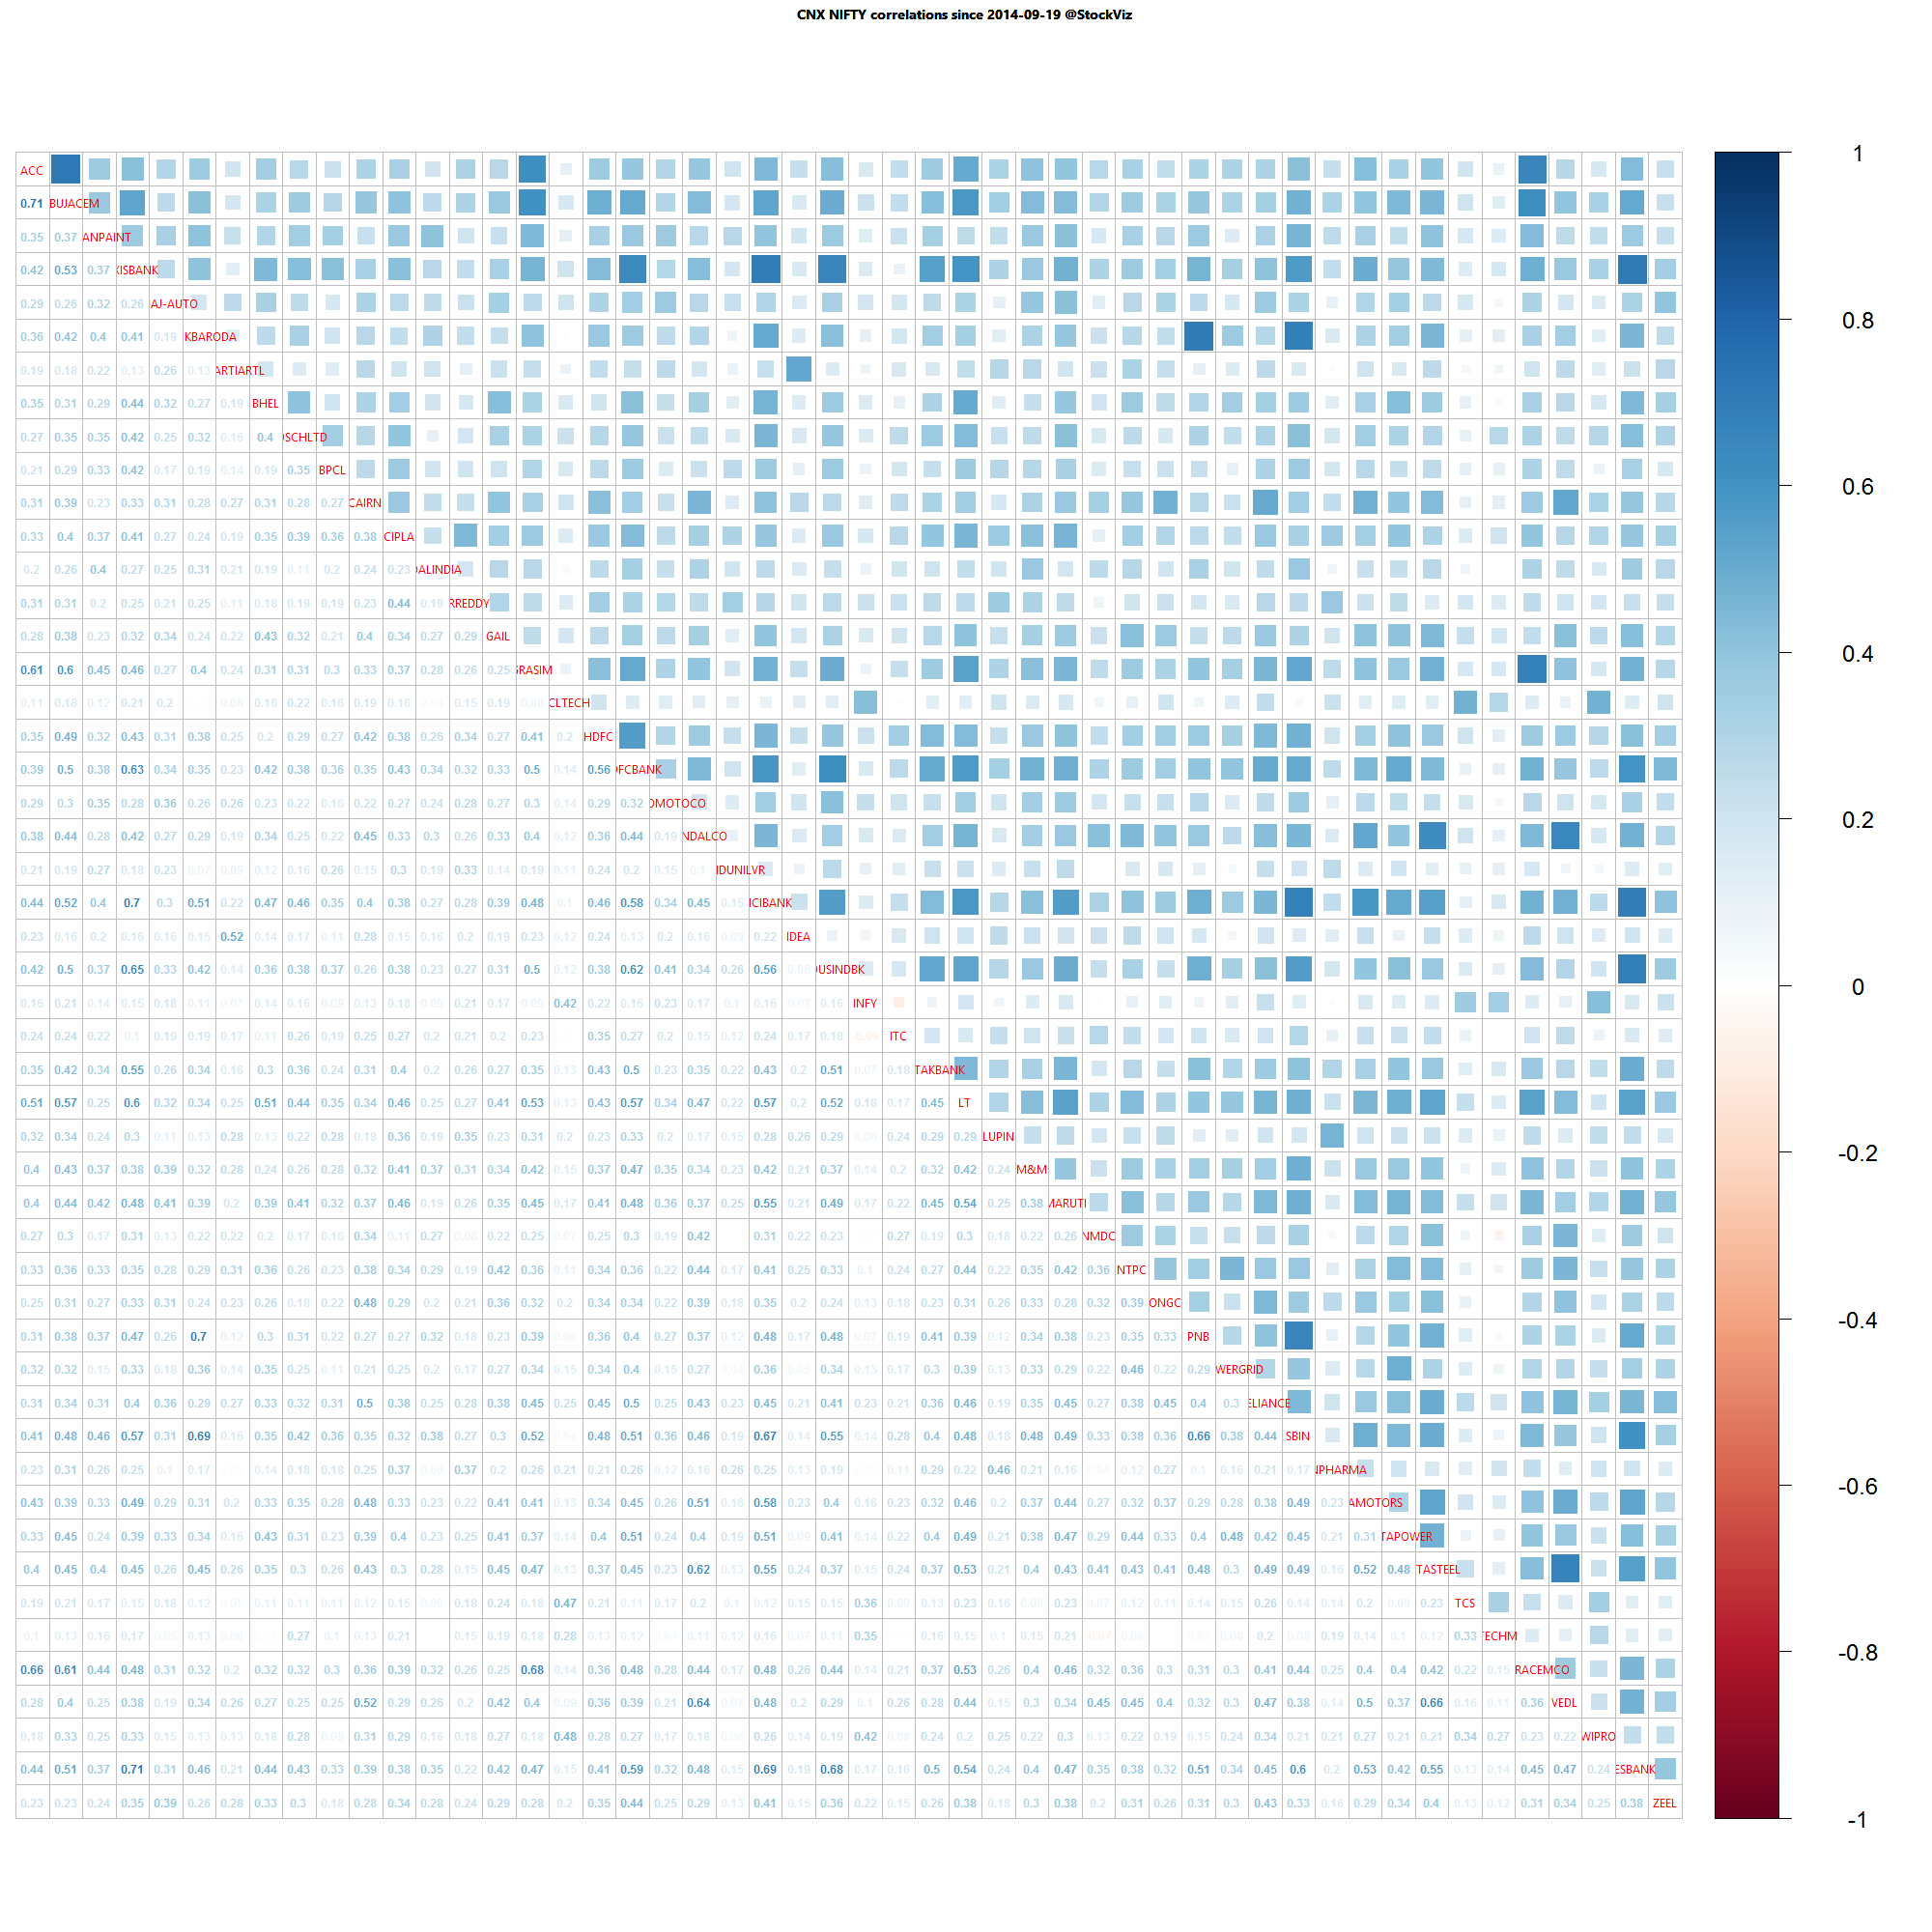
Nifty one year daily return correlations

Nifty one year daily return correlations

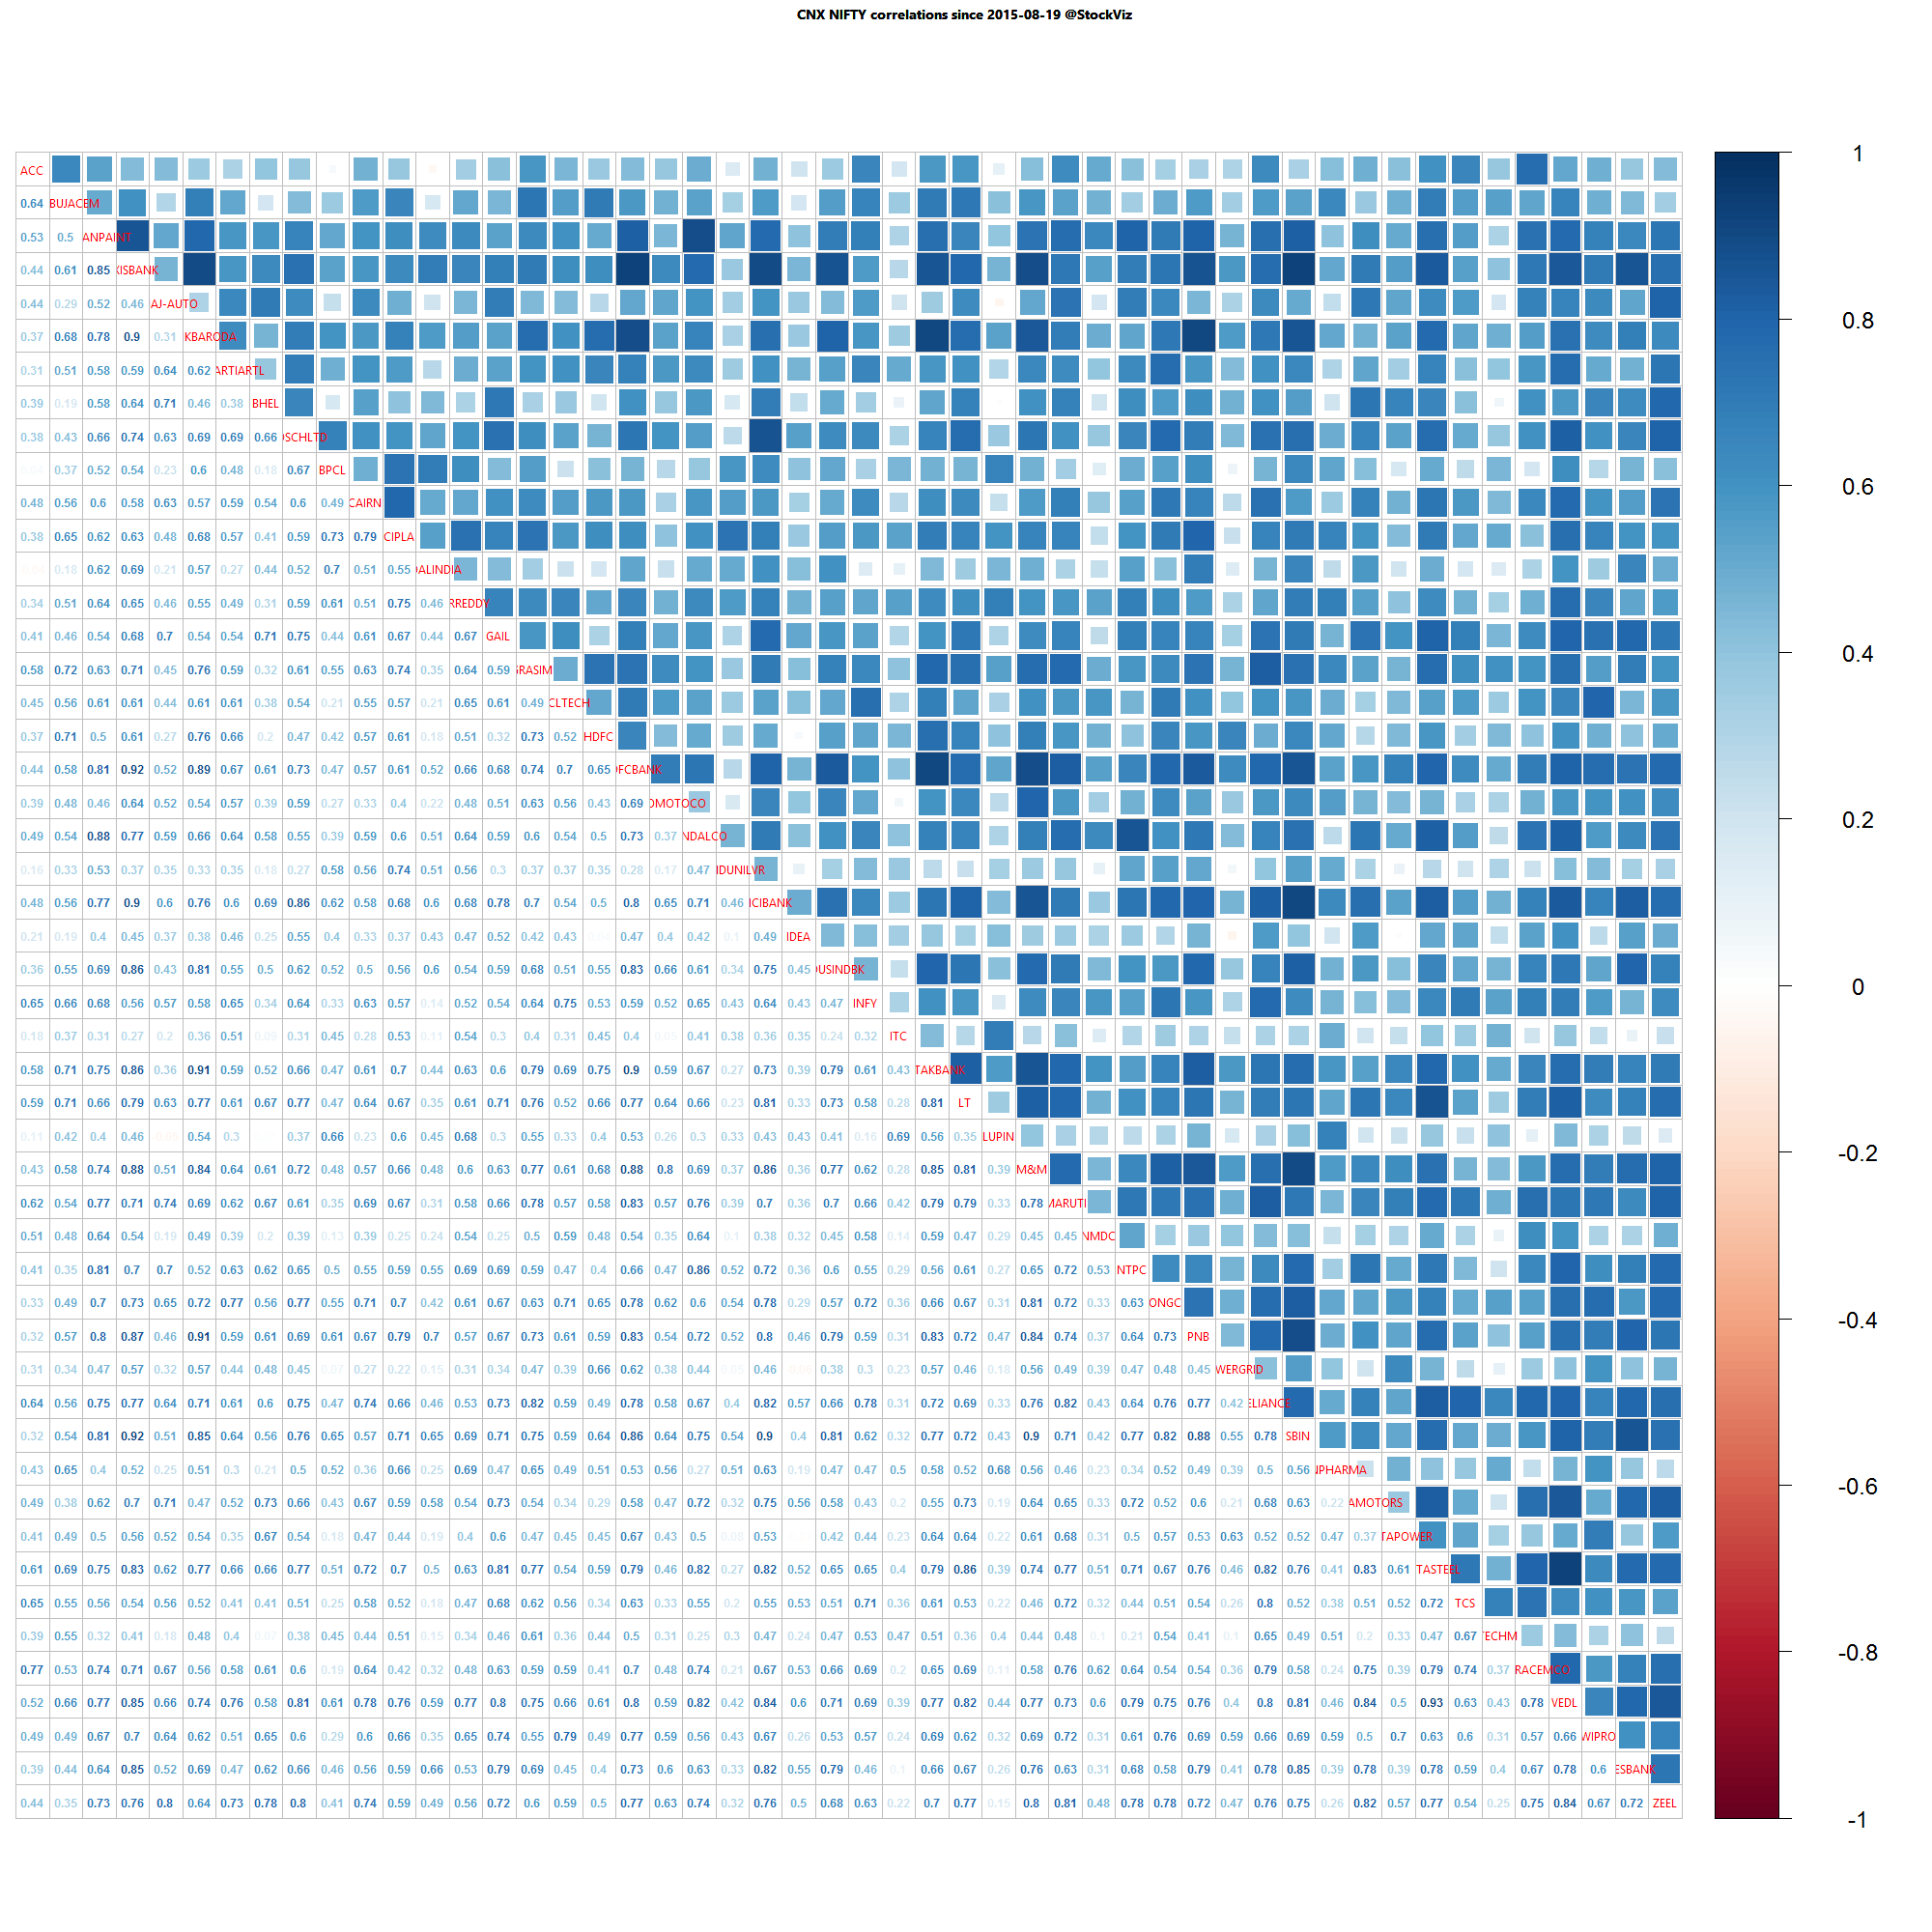
Nifty one month daily return correlations

Nifty one month daily return correlations

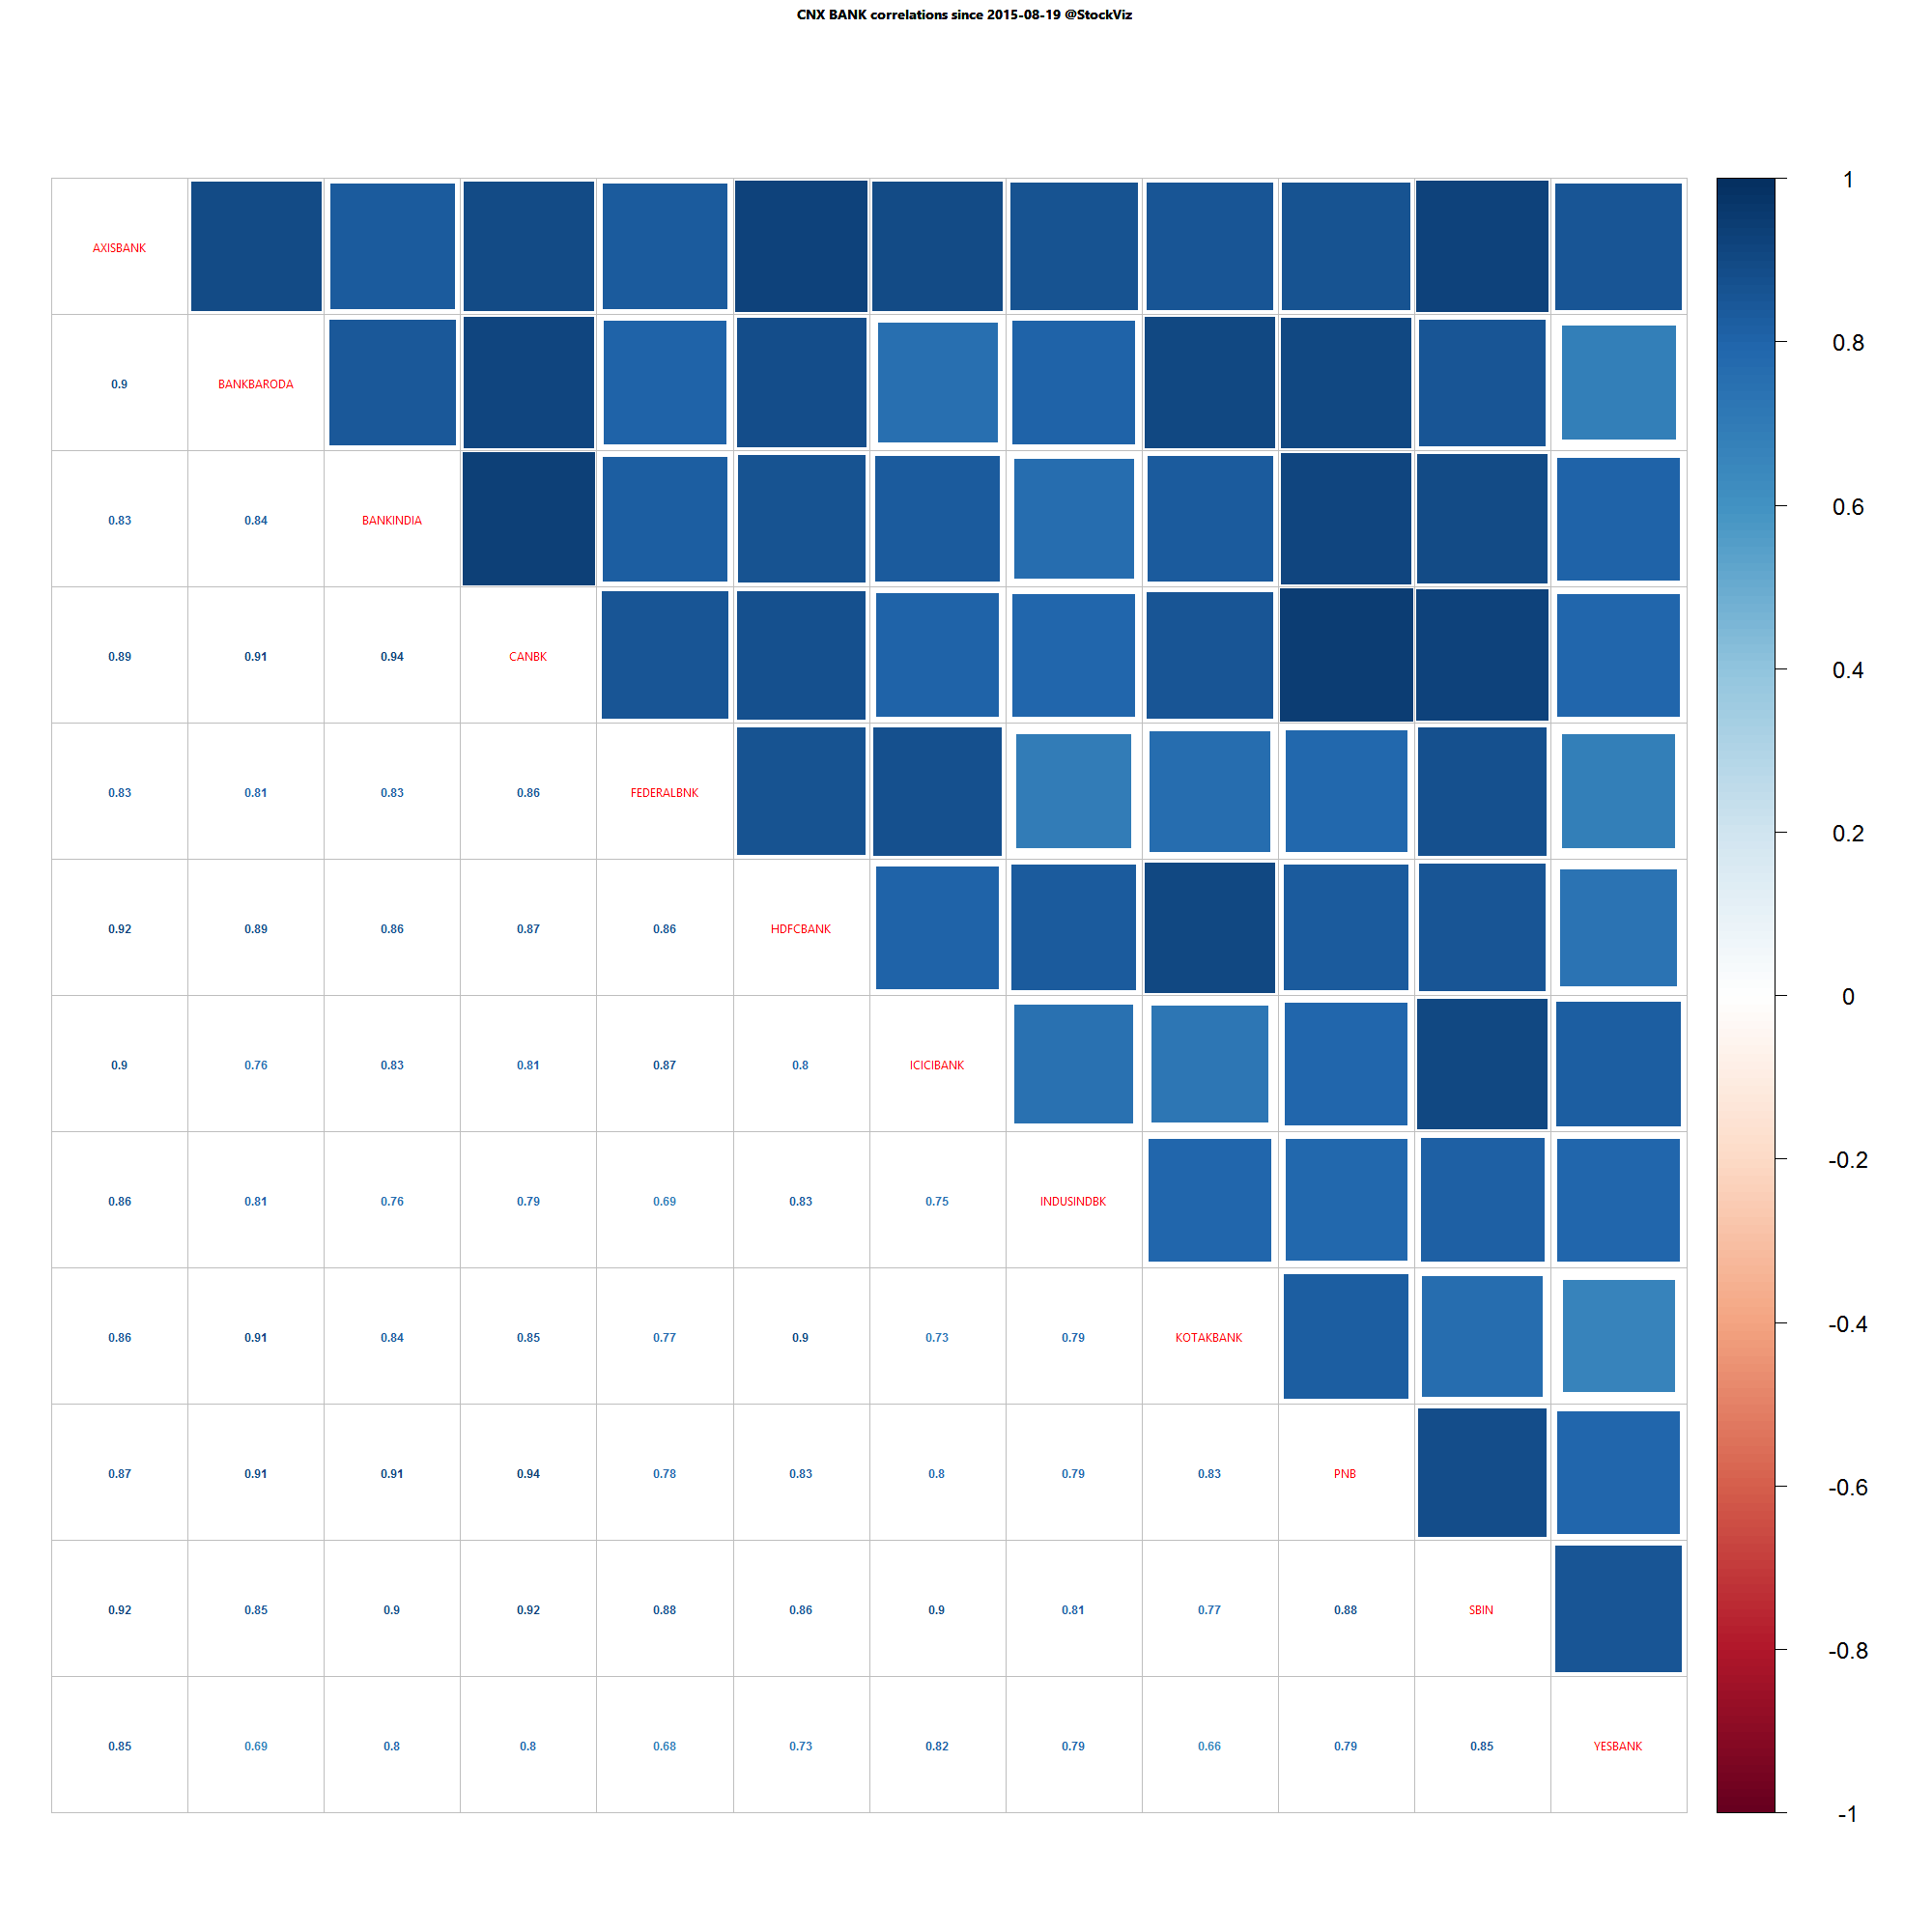
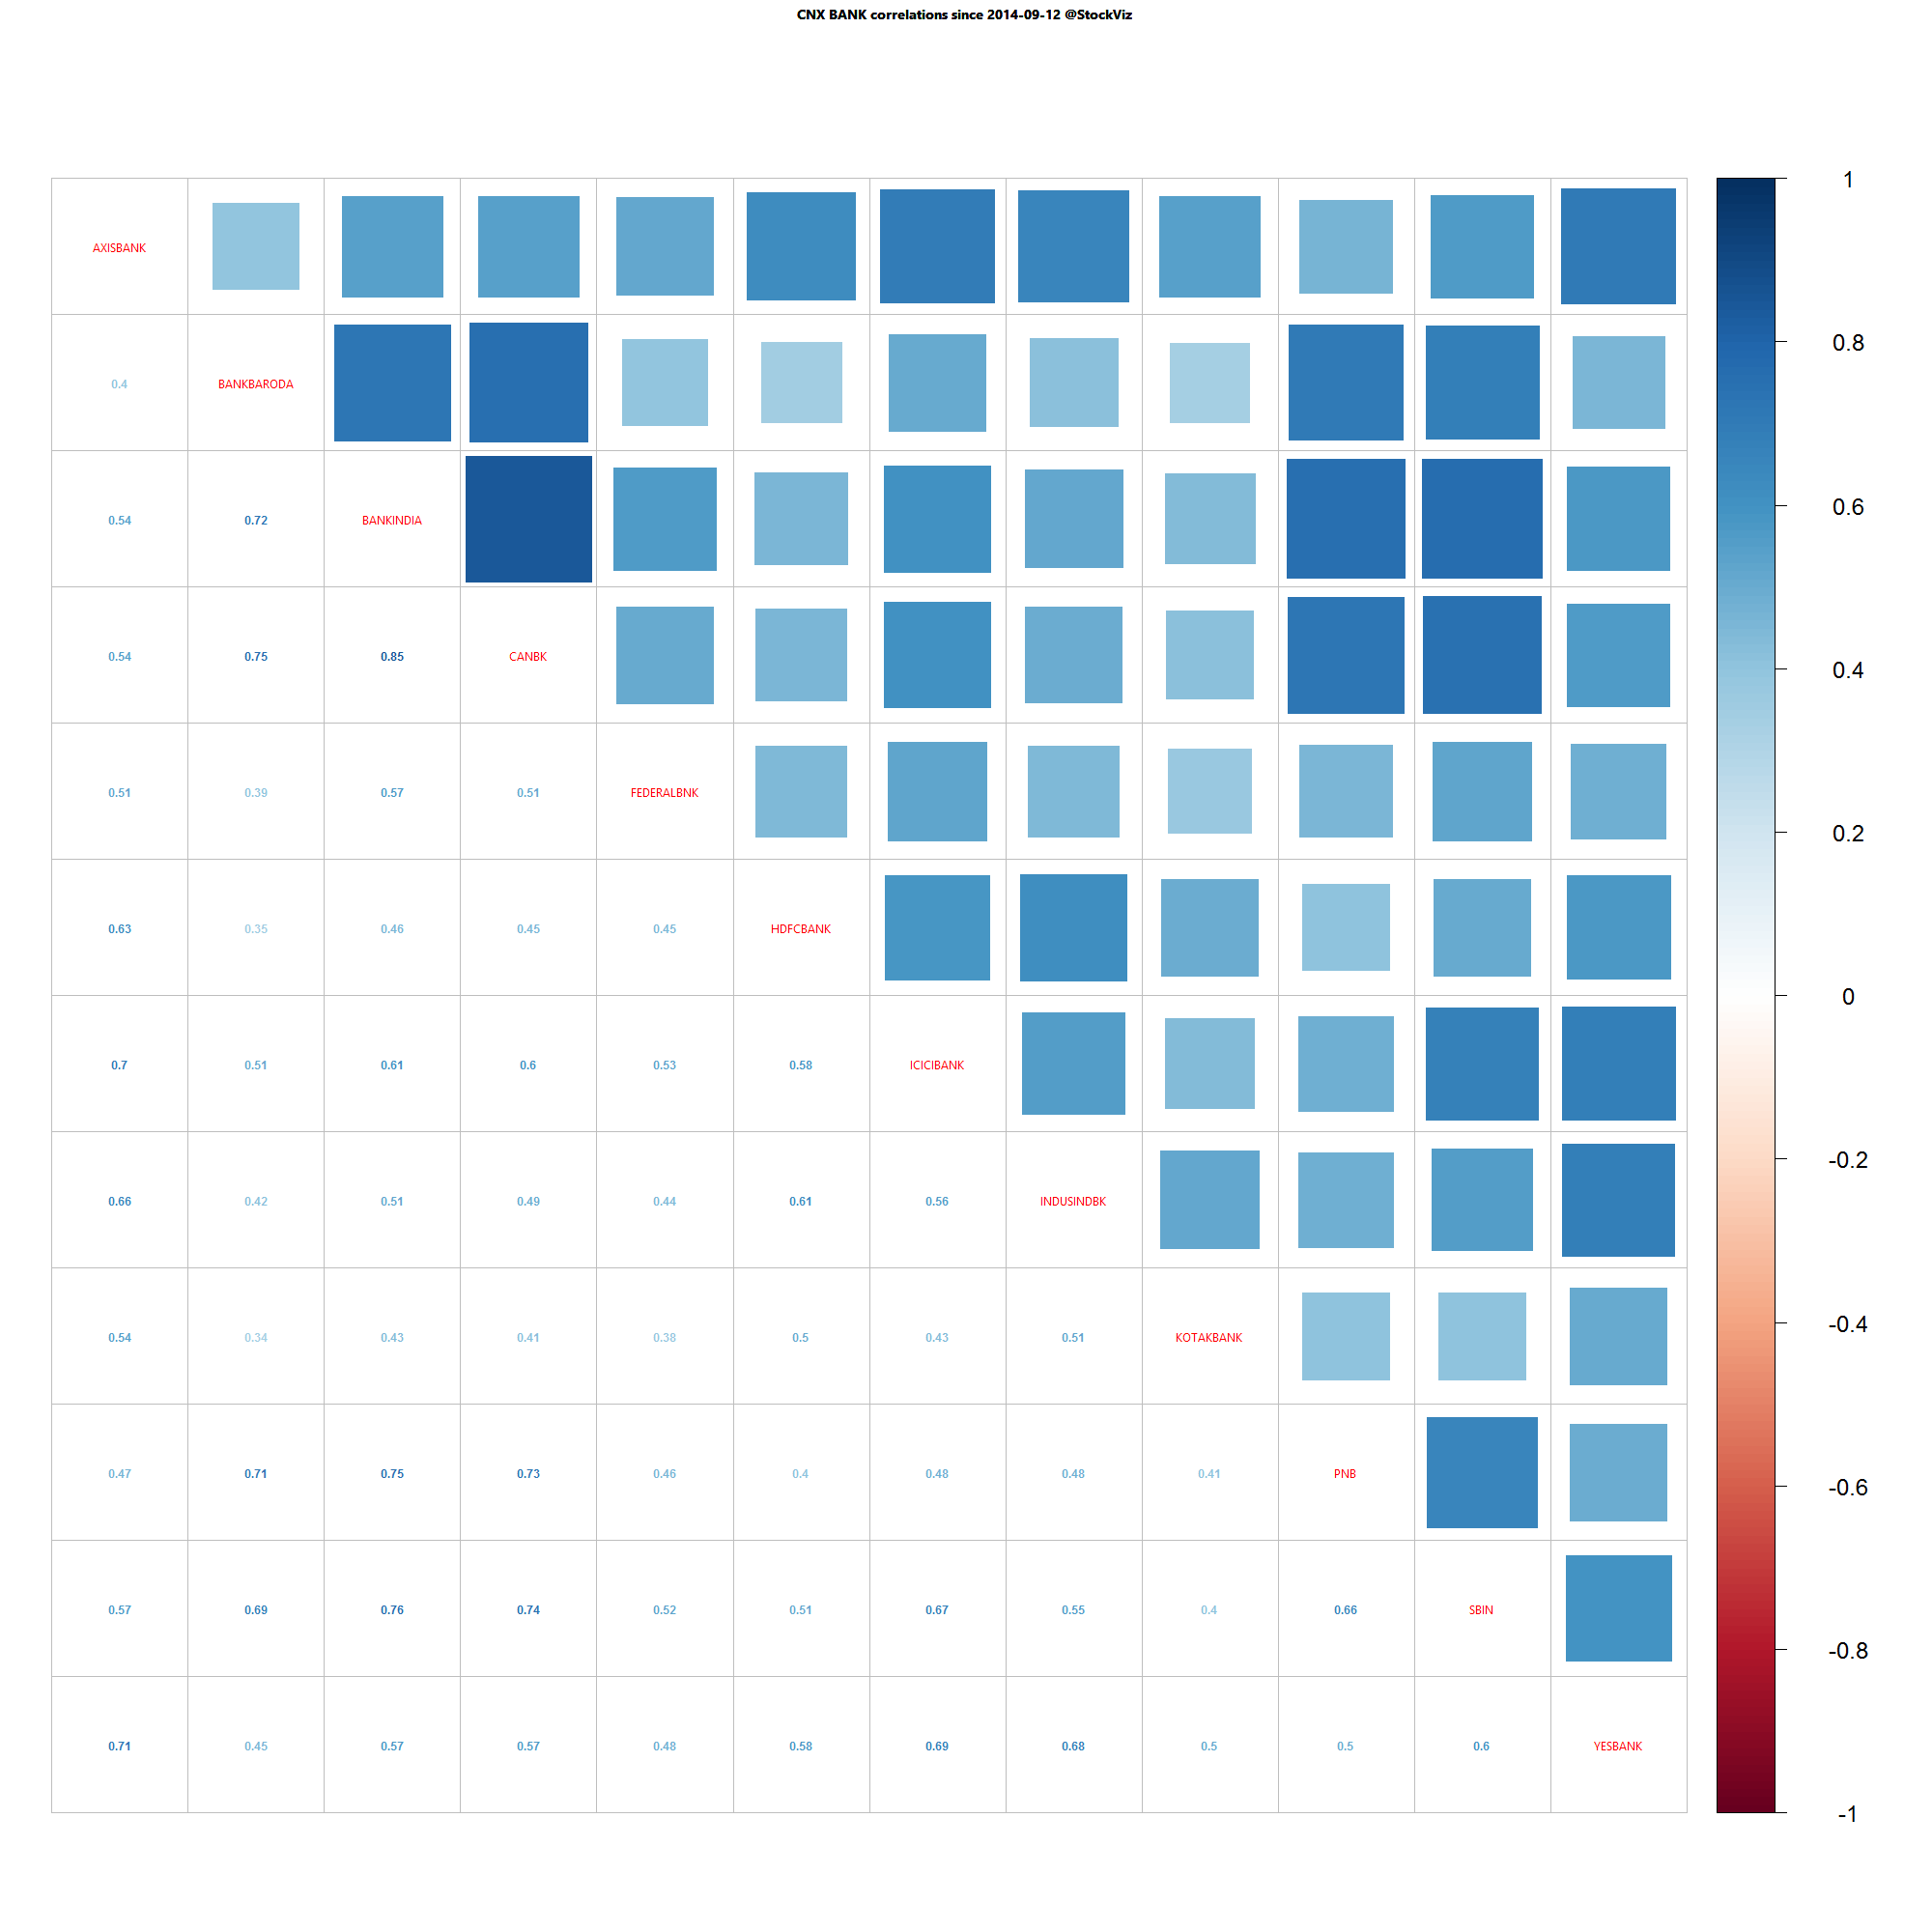
Bank Nifty one year daily return correlations

Bank Nifty one year daily return correlations

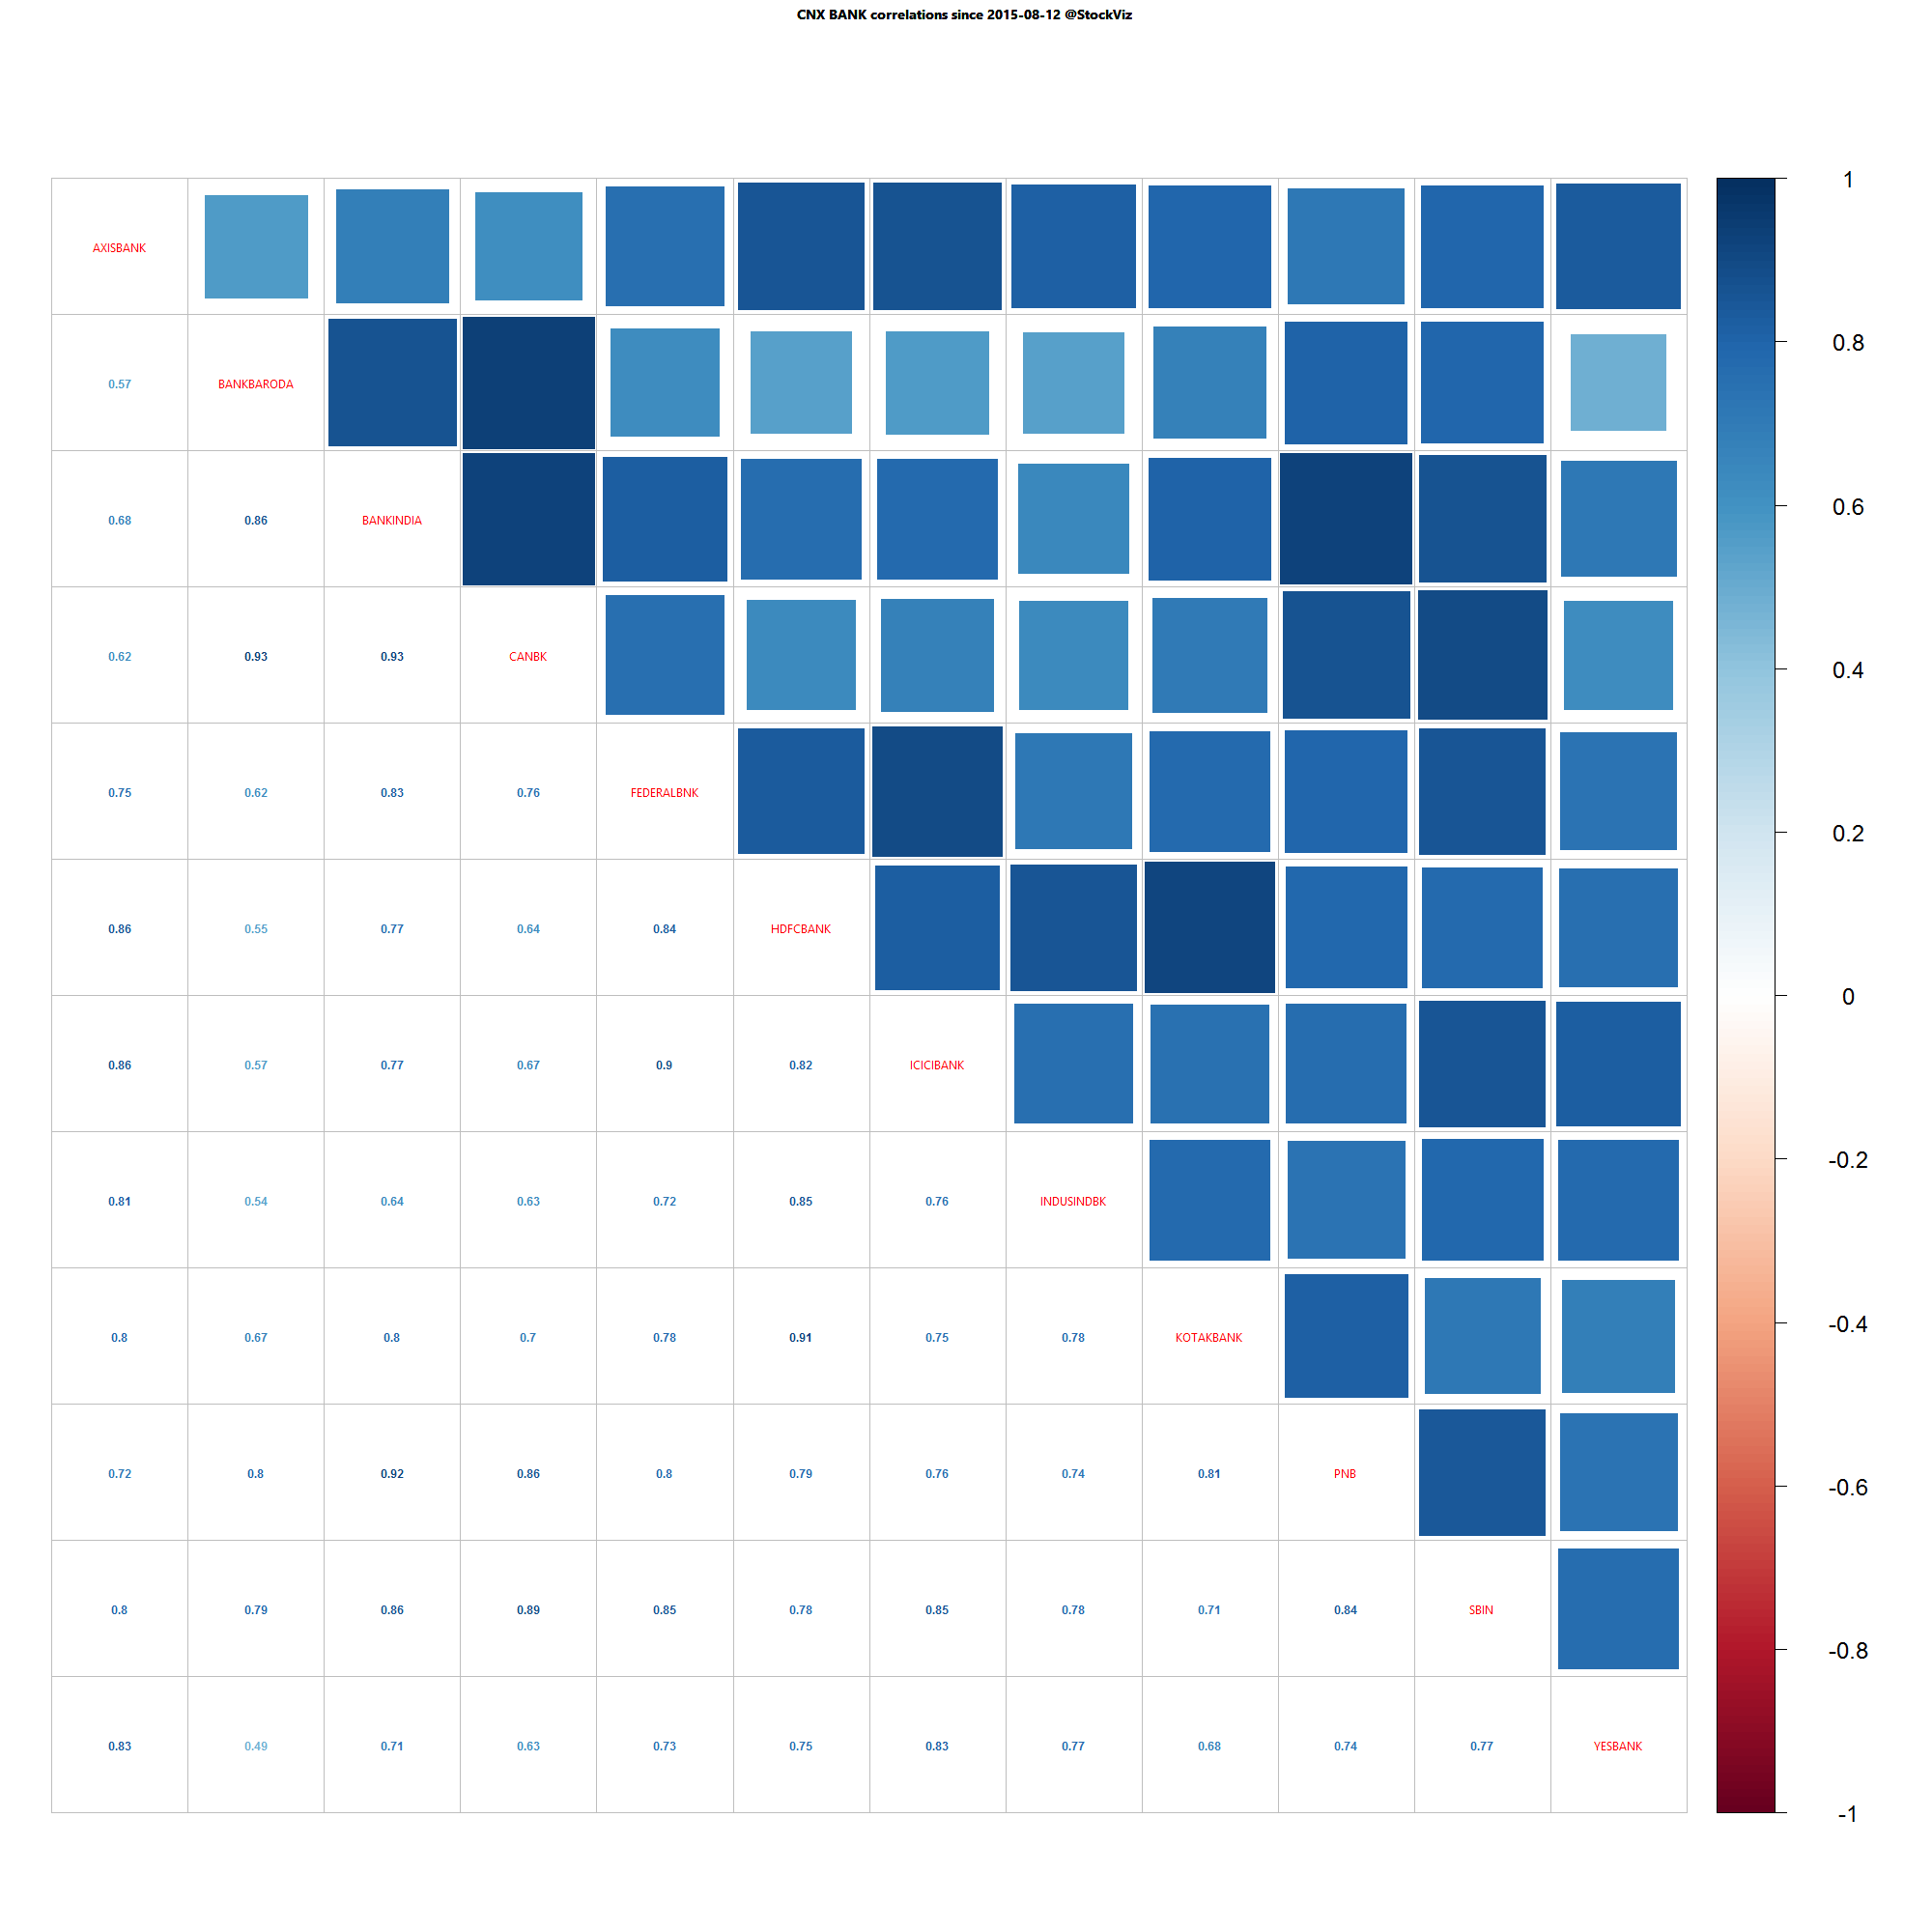
Bank Nifty one month daily return correlations

Bank Nifty one month daily return correlations

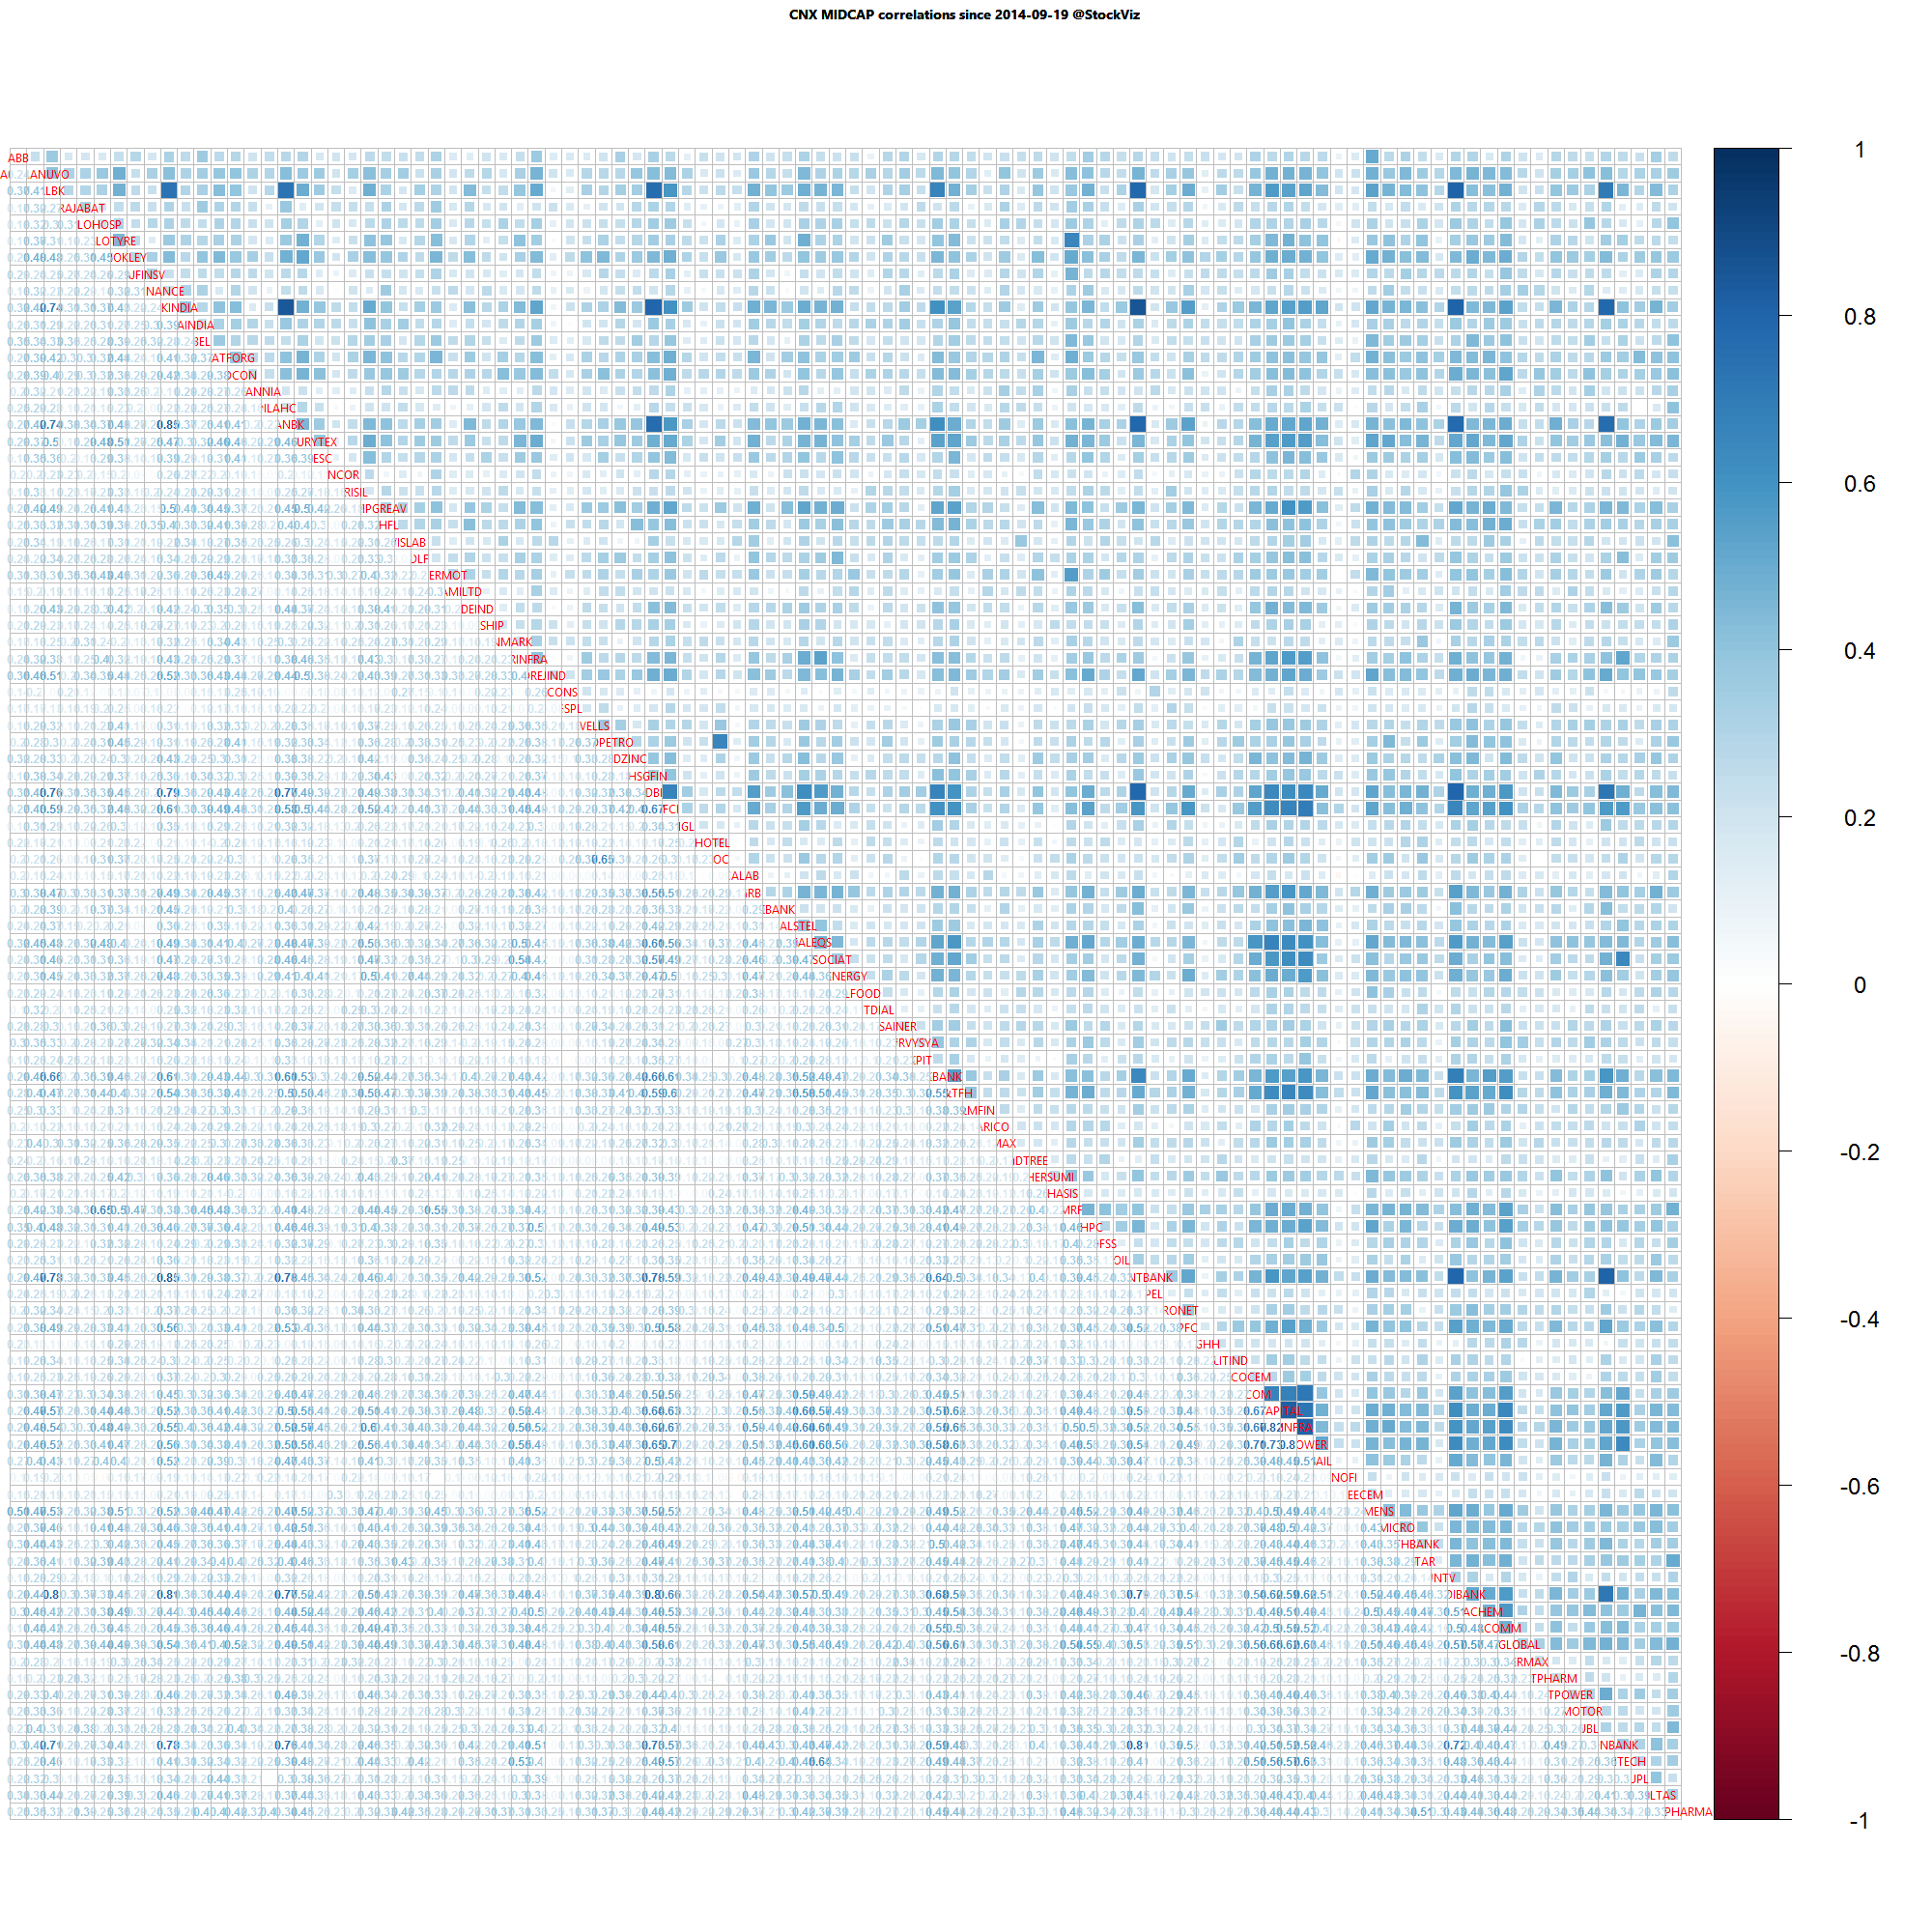
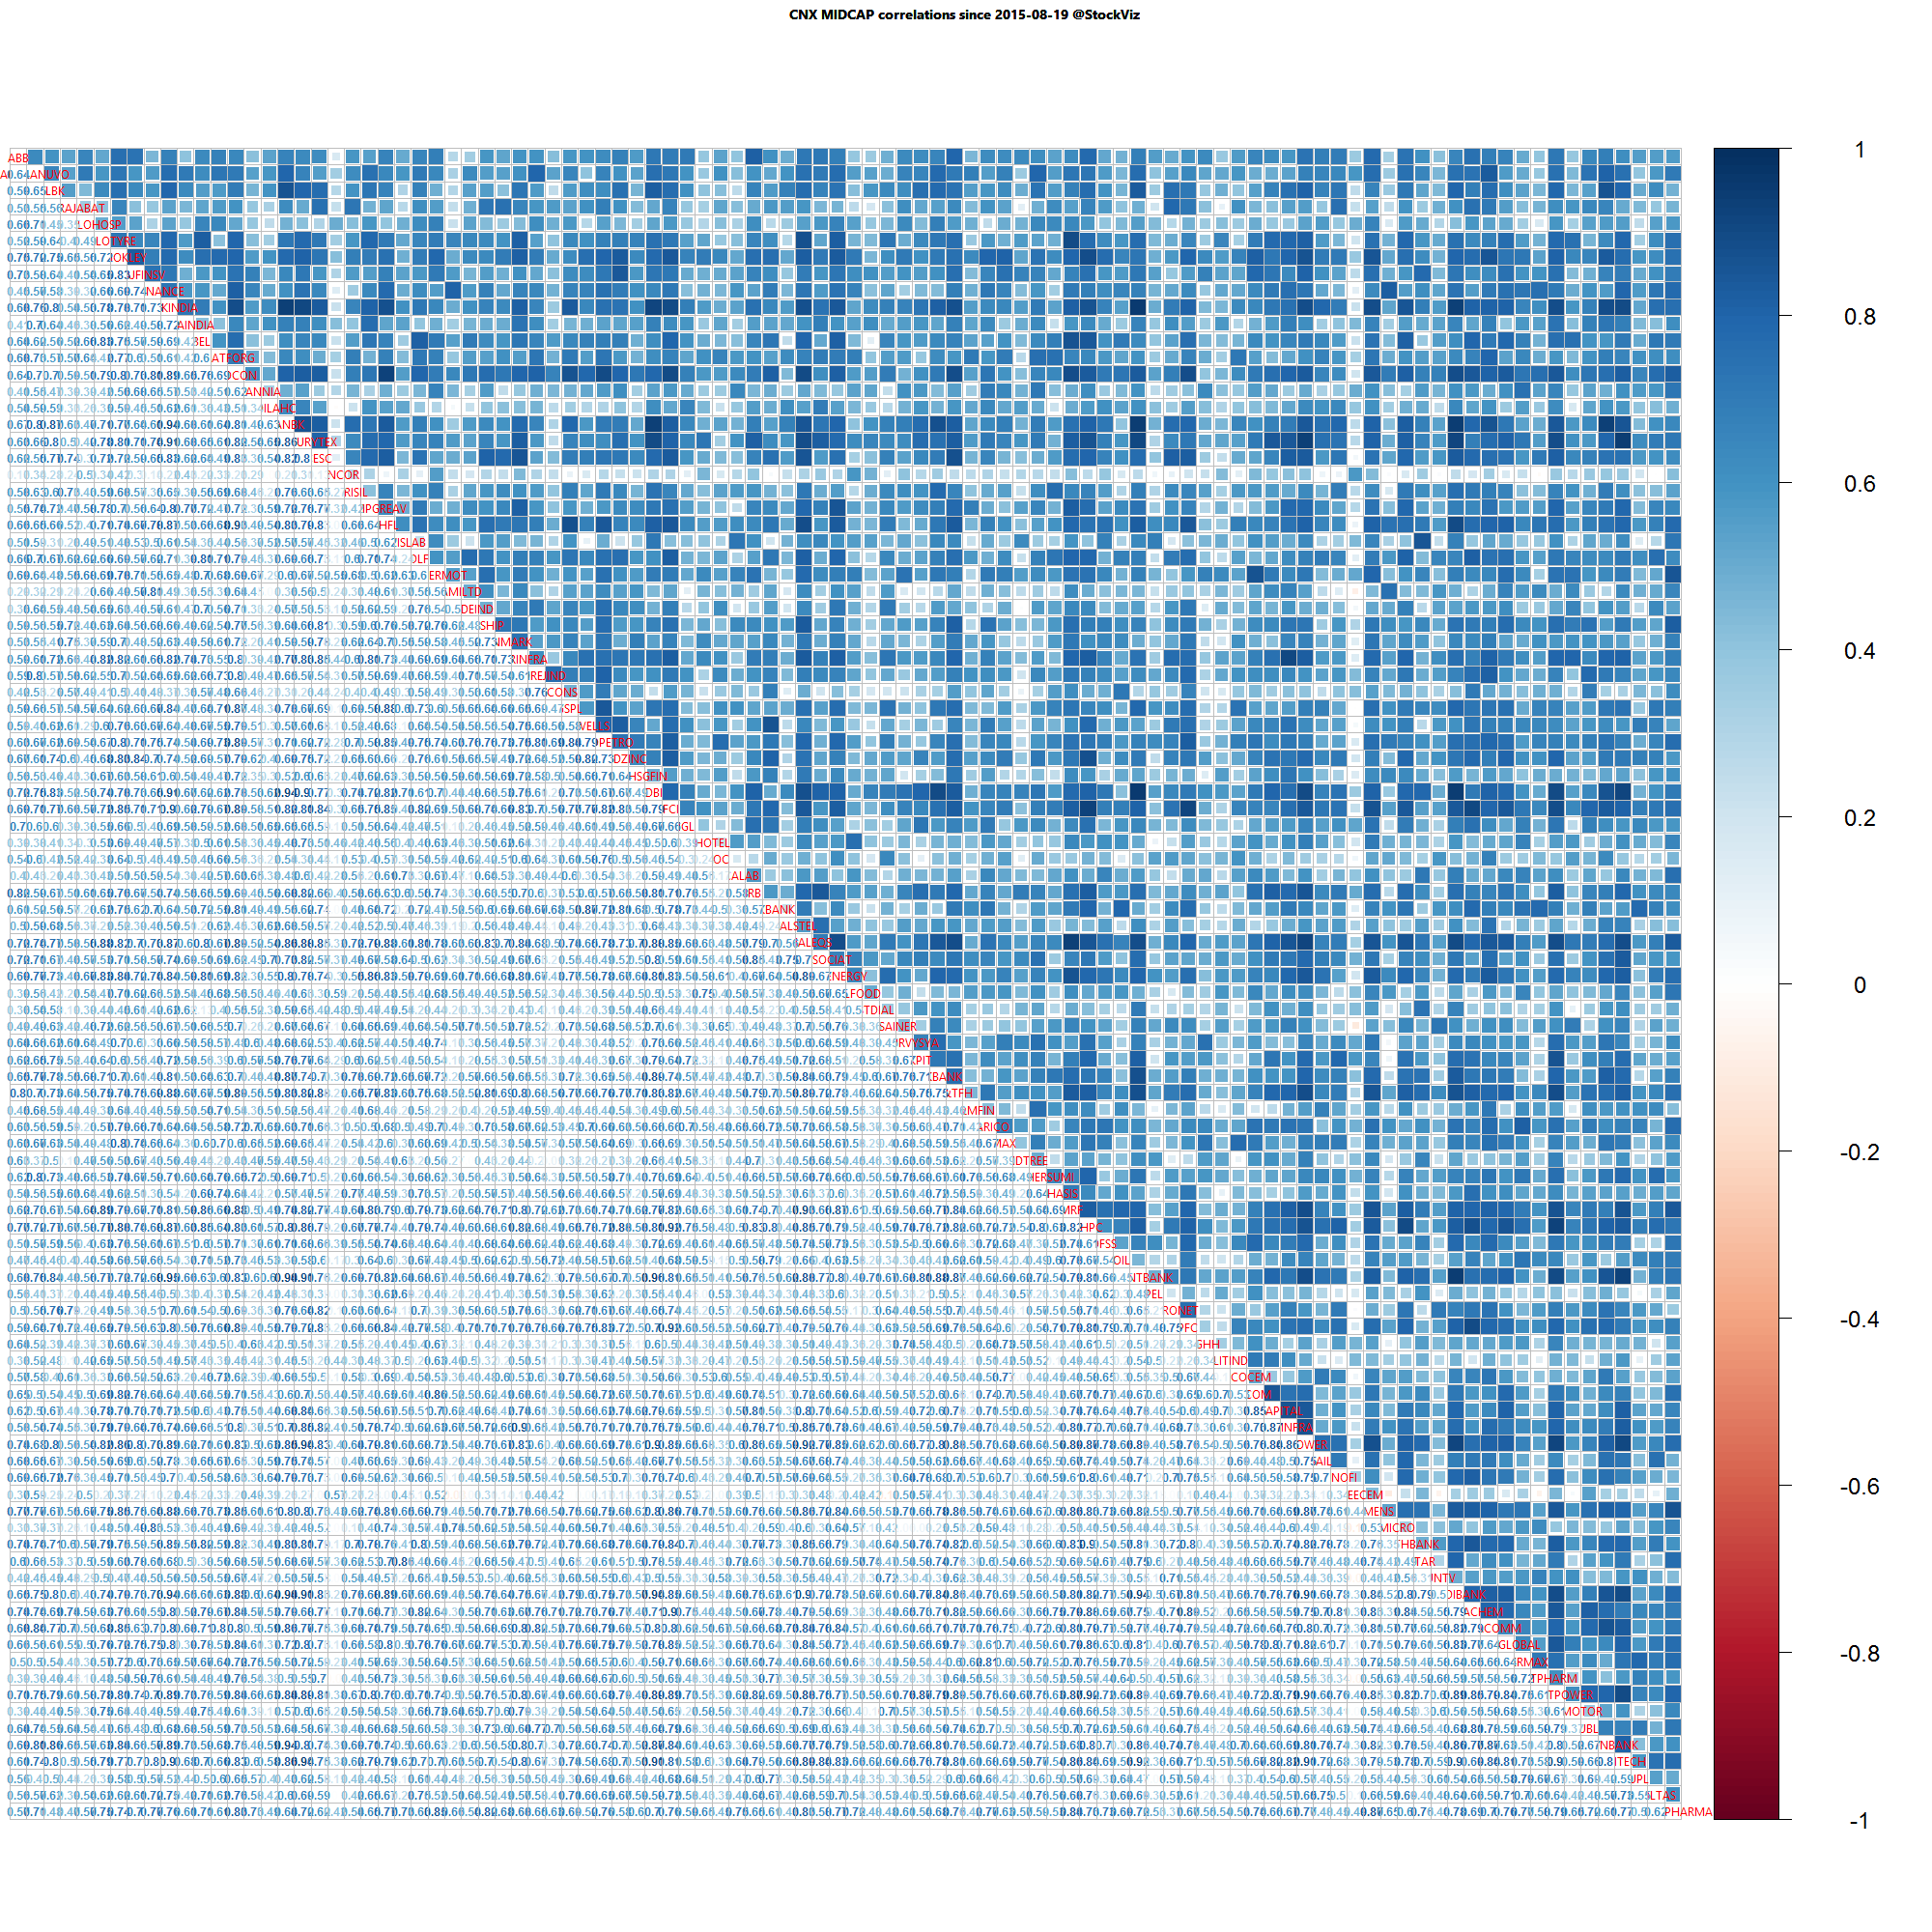
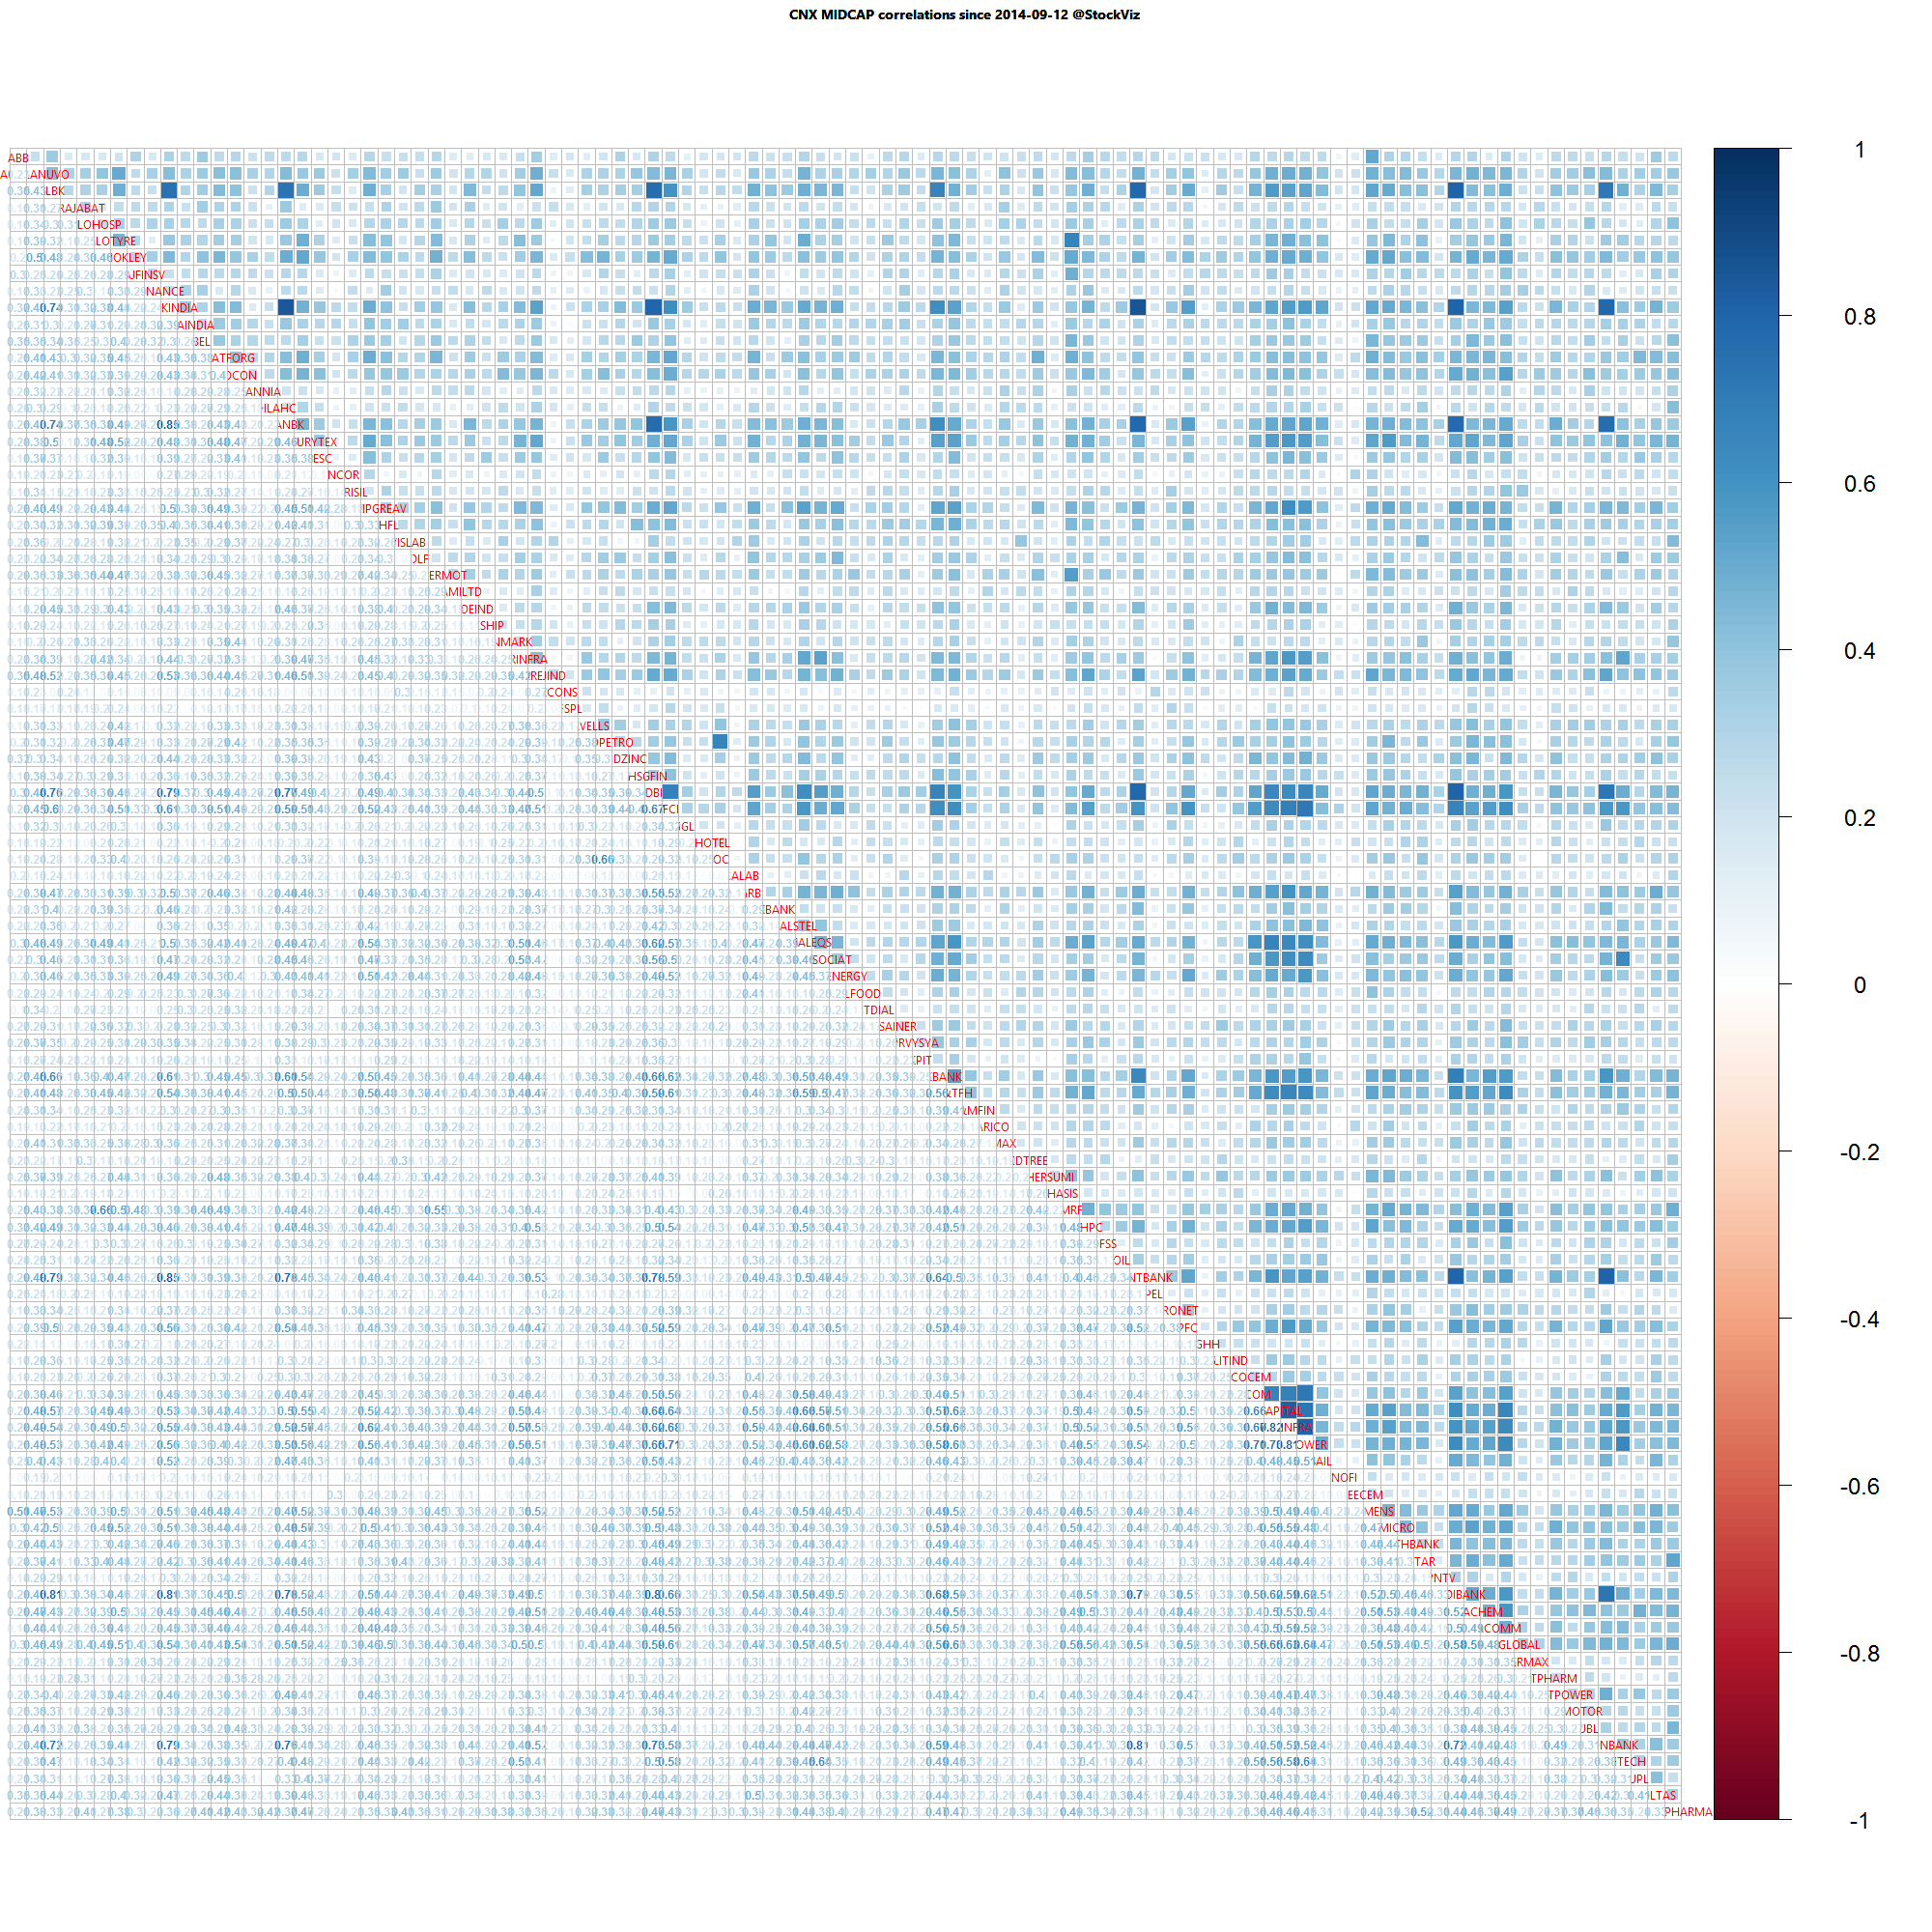
Midcap one year daily return correlations

Midcap one year daily return correlations

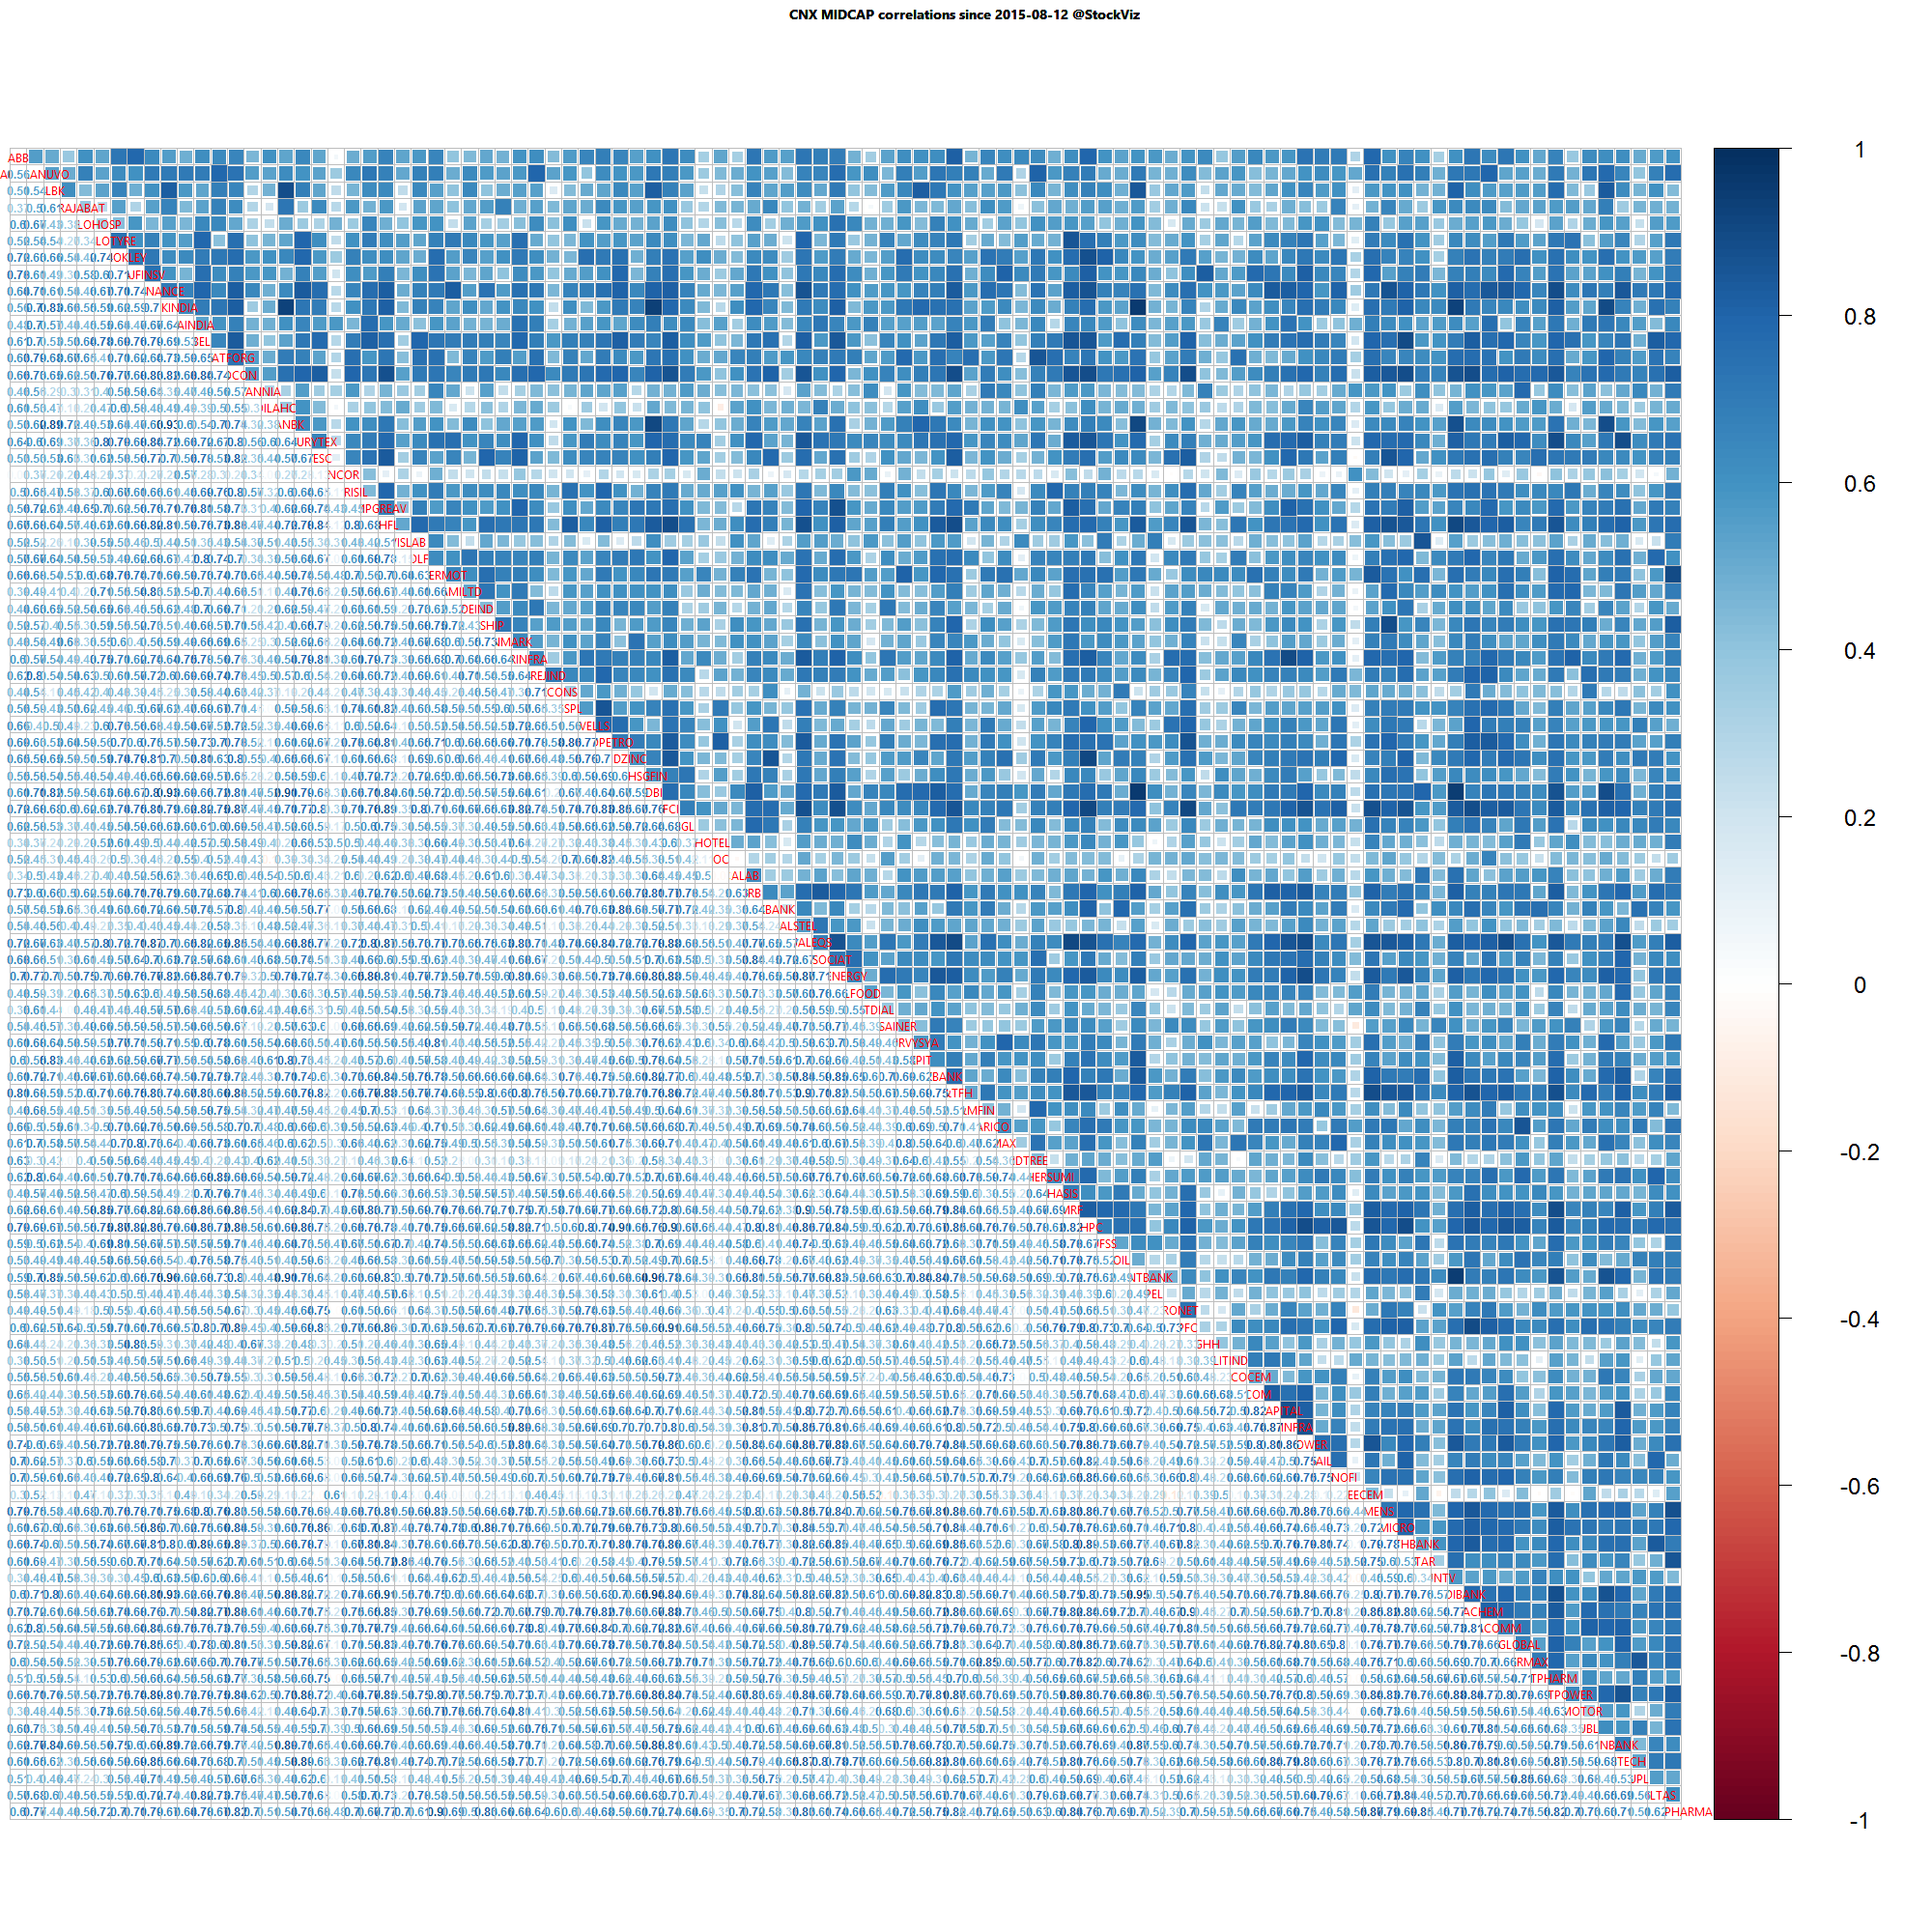
Midcap one month daily return correlations

Midcap one month daily return correlations

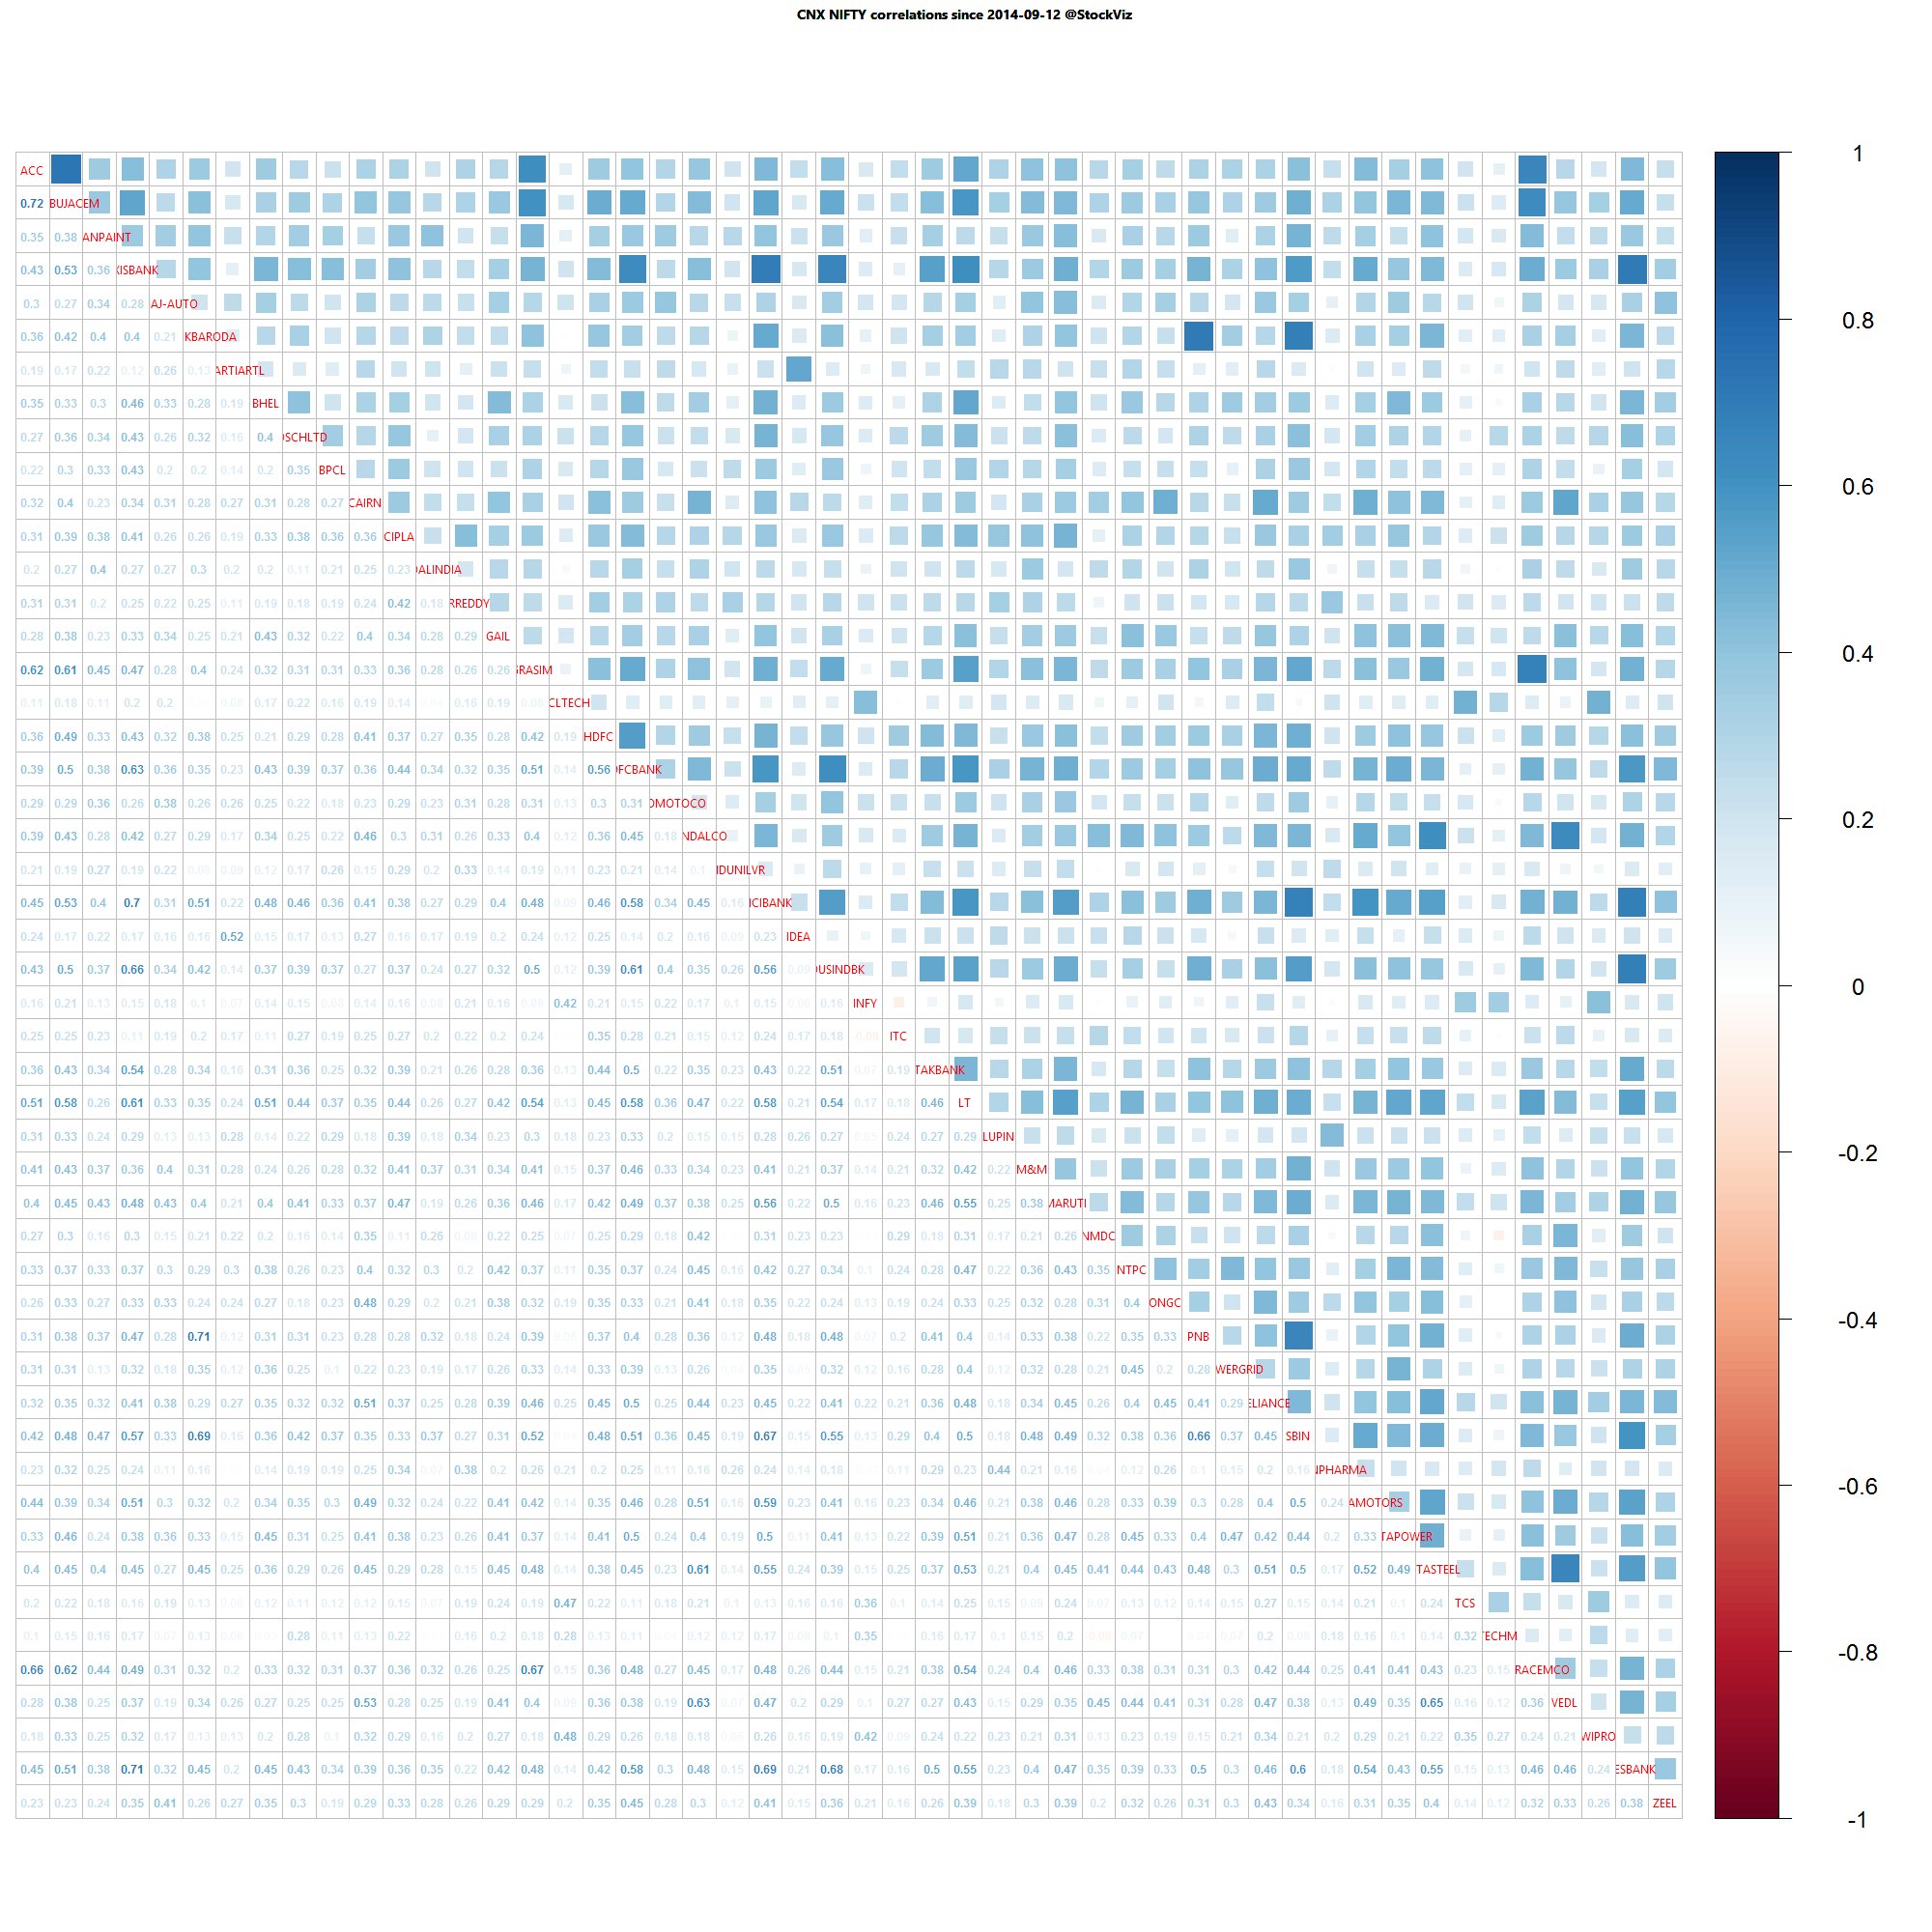
A lot of thick blue squares mean that positive correlations are high. Red squares mean negative correlations are high. Whites are the doldrums.

Weekly Recap: Munger on Risk

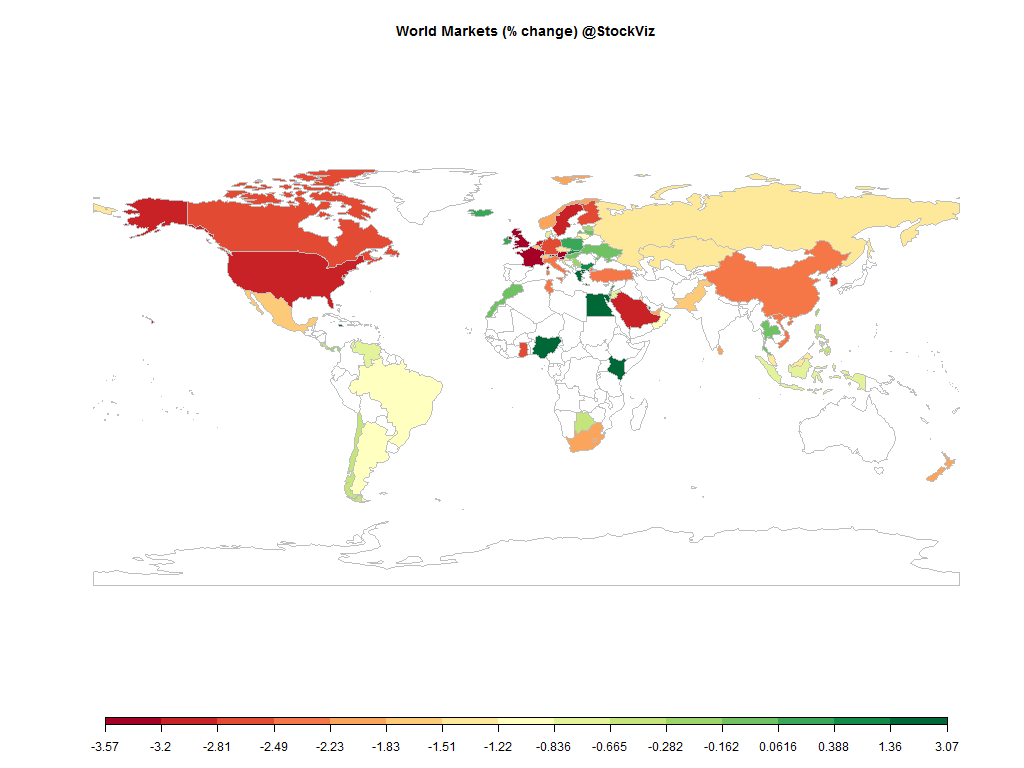
world.2015-09-04.2015-09-11

Equities

Major
DAX(DEU) +0.85%
CAC(FRA) +0.57%
UKX(GBR) +1.24%
NKY(JPN) +2.65%
SPX(USA) +2.36%
MINTs
JCI(IDN) -1.24%
INMEX(MEX) +0.34%
NGSEINDX(NGA) +0.60%
XU030(TUR) -2.08%
BRICS
IBOV(BRA) -0.20%
SHCOMP(CHN) +1.27%
NIFTY(IND) +1.75%
INDEXCF(RUS) +1.17%
TOP40(ZAF) -0.22%

Commodities

Energy
Brent Crude Oil -3.80%
WTI Crude Oil -3.66%
Heating Oil -3.50%
RBOB Gasoline -3.51%
Ethanol +2.12%
Natural Gas +1.02%
Metals
Palladium +2.49%
Platinum -2.16%
Silver 5000oz -0.68%
Copper +6.47%
Gold 100oz -1.58%

Currencies

USDEUR:-1.62% USDJPY:+1.40%

MINTs
USDIDR(IDN) +1.06%
USDMXN(MEX) -0.51%
USDNGN(NGA) +0.00%
USDTRY(TUR) +1.12%
BRICS
USDBRL(BRA) +0.57%
USDCNY(CHN) +0.30%
USDINR(IND) +0.11%
USDRUB(RUS) -0.22%
USDZAR(ZAF) -2.15%
Agricultural
Coffee (Arabica) -2.16%
Cotton +2.60%
Sugar #11 +4.19%
White Sugar -0.09%
Corn +7.38%
Cocoa +2.20%
Feeder Cattle -0.42%
Lean Hogs -2.41%
Soybean Meal +0.22%
Soybeans +1.34%
Wheat +3.44%
Cattle +0.06%
Coffee (Robusta) -3.02%
Lumber +6.22%
Orange Juice -5.97%

Credit Indices

Index Change
Markit CDX EM -0.04%
Markit CDX NA HY +0.30%
Markit CDX NA IG -1.02%
Markit iTraxx Asia ex-Japan IG -5.46%
Markit iTraxx Australia -2.71%
Markit iTraxx Europe -2.42%
Markit iTraxx Europe Crossover -11.48%
Markit iTraxx Japan -1.82%
Markit iTraxx SovX Western Europe -0.17%
Markit LCDX (Loan CDS) +0.00%
Markit MCDX (Municipal CDS) -0.27%
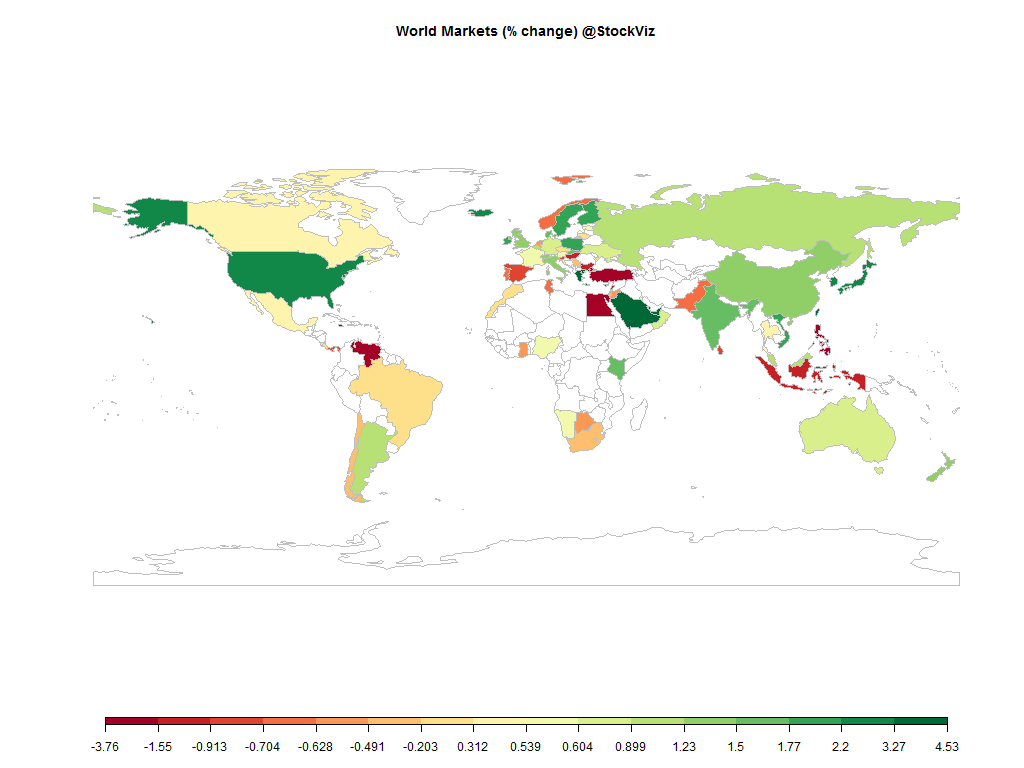
Markets ended in the green after the brutal beating it took the previous week. The VIX ended below 25 but is still way about its long-run average. The next week is going to be all about the US Fed – and maybe a short-covering rally ahead of Thursday’s meeting.

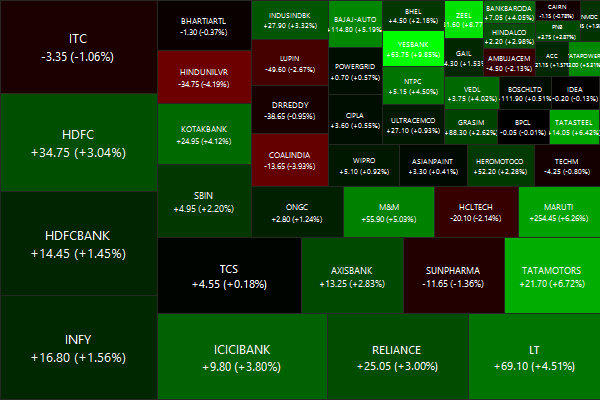
Nifty Heatmap

CNX NIFTY.2015-09-04.2015-09-11

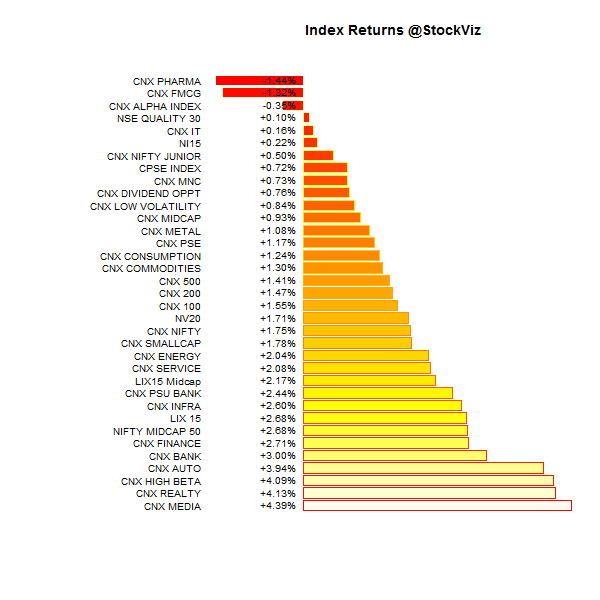
Index Returns

For a deeper dive into indices, check out our weekly Index Update.
index.performance.2015-09-04.2015-09-11

Market Cap Decile Performance

Decile Mkt. Cap. Adv/Decl
1 (micro) -5.60% 60/73
2 -3.21% 59/74
3 -3.70% 58/76
4 -2.97% 59/74
5 -2.98% 59/74
6 -3.00% 63/71
7 -3.32% 57/76
8 -2.20% 65/69
9 -1.38% 59/74
10 (mega) -0.37% 65/69
Overall, markets were down – NIFTY’s performance did not bleed into the rest of the market…

Top Winners and Losers

CONCOR +9.40%
YESBANK +9.85%
RCOM +11.02%
INFRATEL -8.11%
MOTHERSUMI -4.99%
ADANIPORTS -4.83%
A mixed bag of a market…

ETF Performance

INFRABEES +3.37%
PSUBNKBEES +3.17%
BANKBEES +2.16%
NIFTYBEES +1.50%
CPSEETF +0.00%
GOLDBEES -1.08%
JUNIORBEES -1.17%
Gold continued to tank…

Yield Curve

yield Curve.2015-09-04.2015-09-11

Bond Indices

Sub Index Change in YTM Total Return(%)
0 5 +0.01 +0.12%
5 10 +0.03 -0.01%
10 15 +0.02 +0.02%
15 20 +0.04 -0.18%
20 30 +0.01 -0.02%
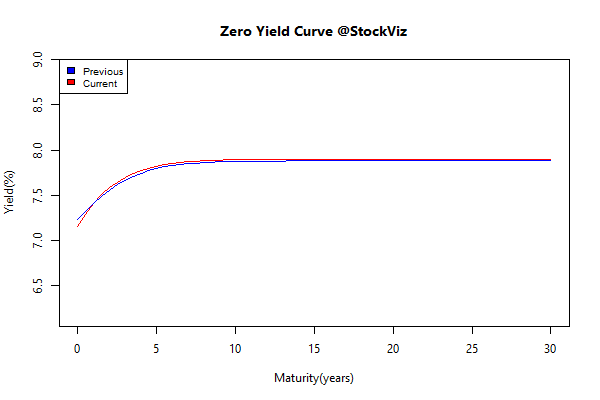
Bond yields ticked up marginally…

Investment Theme Performance

Hopefully, in the first stages of recovering from their drawdowns…

Equity Mutual Funds

Bond Mutual Funds

Thoughts for the weekend

Charlie Munger on Risk:

  1. Risk to us is a) the risk of permanent loss of capital, or b) the risk of inadequate return.
  2. Using a stock’s volatility as a measure of risk is nuts.
  3. Volatility is an overworked concept. You shouldn’t be imprisoned by volatility.
  4. Someone will always be getting richer faster than you. This is not a tragedy.
  5. When any person offers you a chance to earn lots of money without risk, don’t listen to the rest of their sentence.

Source: A Dozen Things I’ve Learned from Charlie Munger about Risk

Index Update 12.09.2015

MOMENTUM

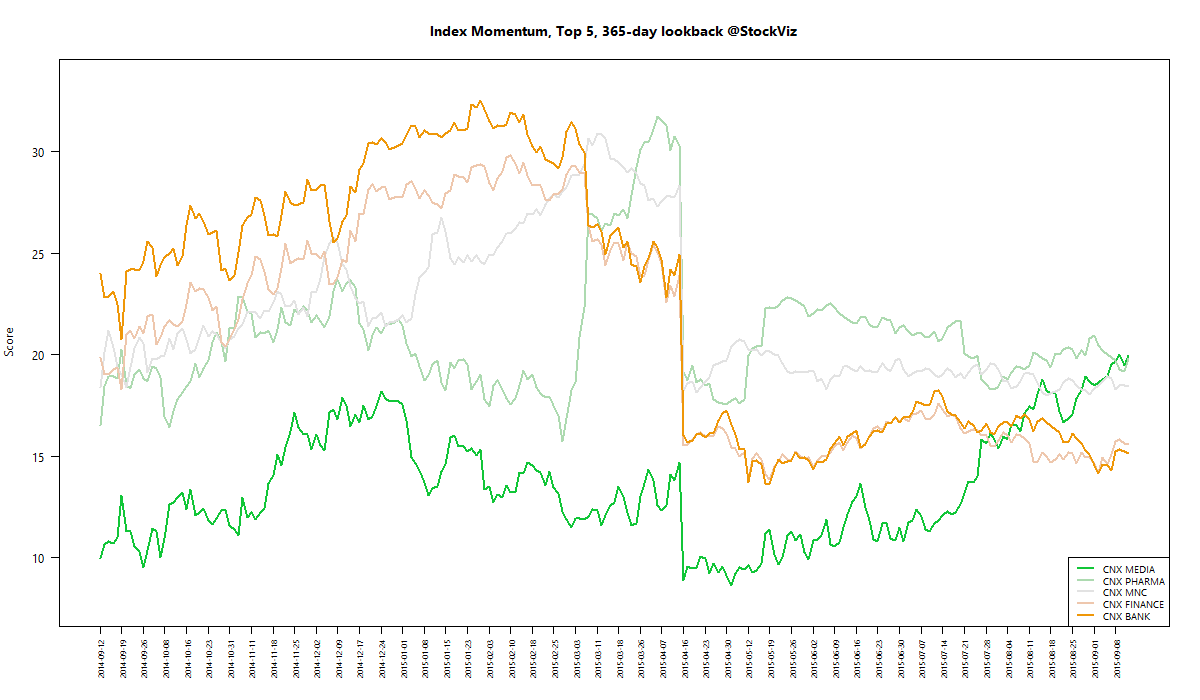
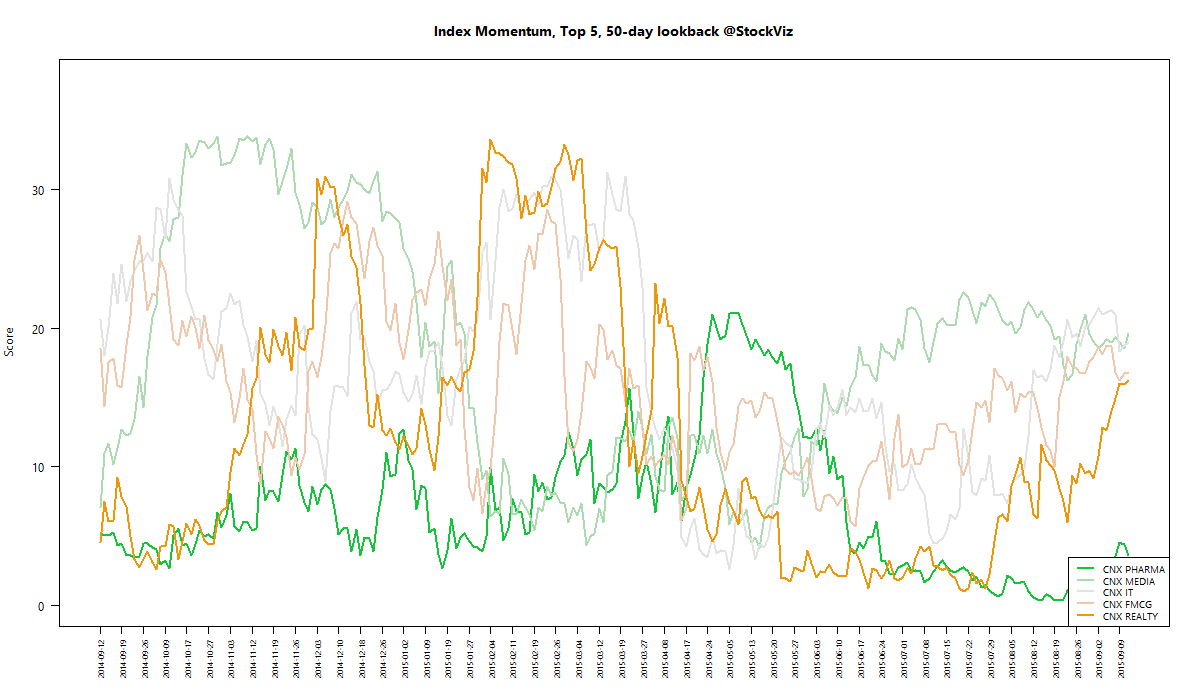
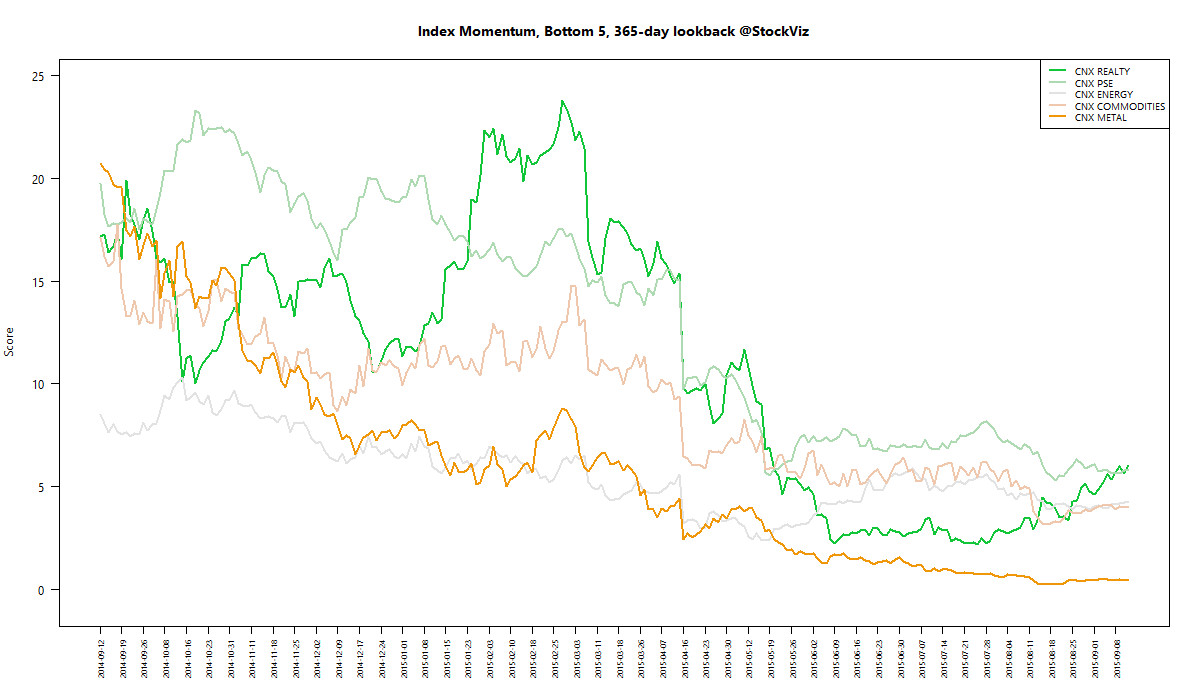
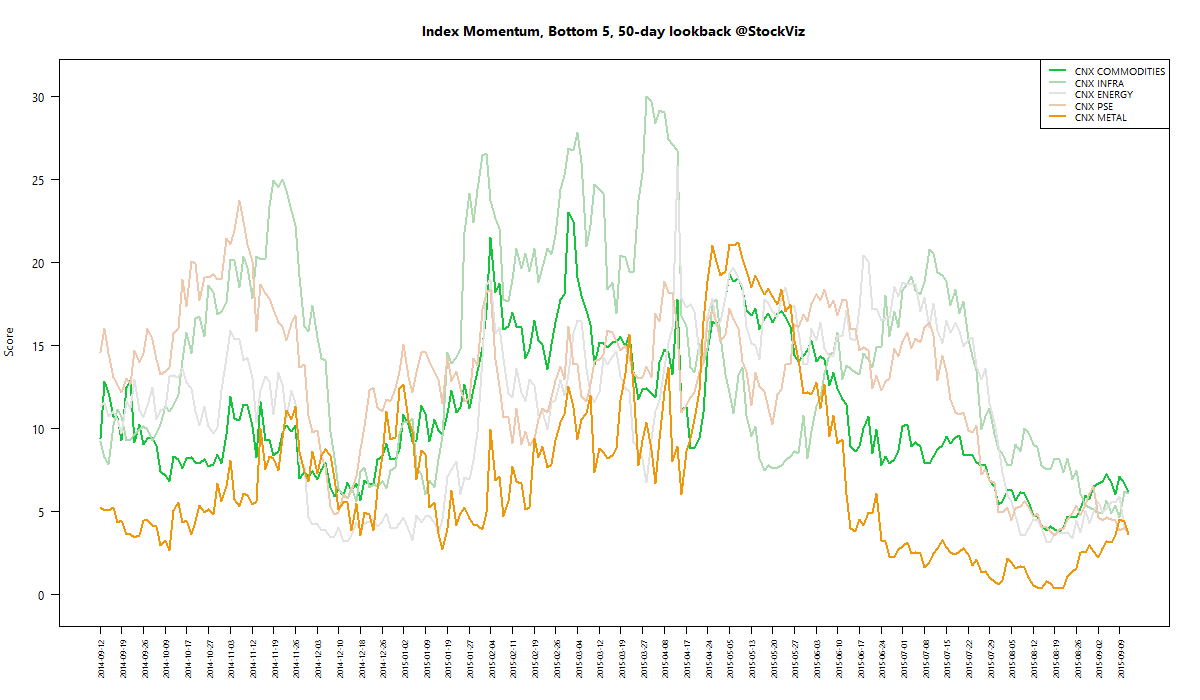
We run our proprietary momentum scoring algorithm on indices just like we do on stocks. You can use the momentum scores of sub-indices to get a sense for which sectors have the wind on their backs and those that are facing headwinds.

Traders can pick their longs in sectors with high short-term momentum and their shorts in sectors with low momentum. Investors can use the longer lookback scores to position themselves using our re-factored index Themes.

You can see how the momentum algorithm has performed on individual stocks here.

Here are the best and the worst sub-indices:

index momentum best 365 2015-09-11 png

index momentum best 50 2015-09-11 png

index momentum worst 365 2015-09-11 png

index momentum worst 50 2015-09-11 png

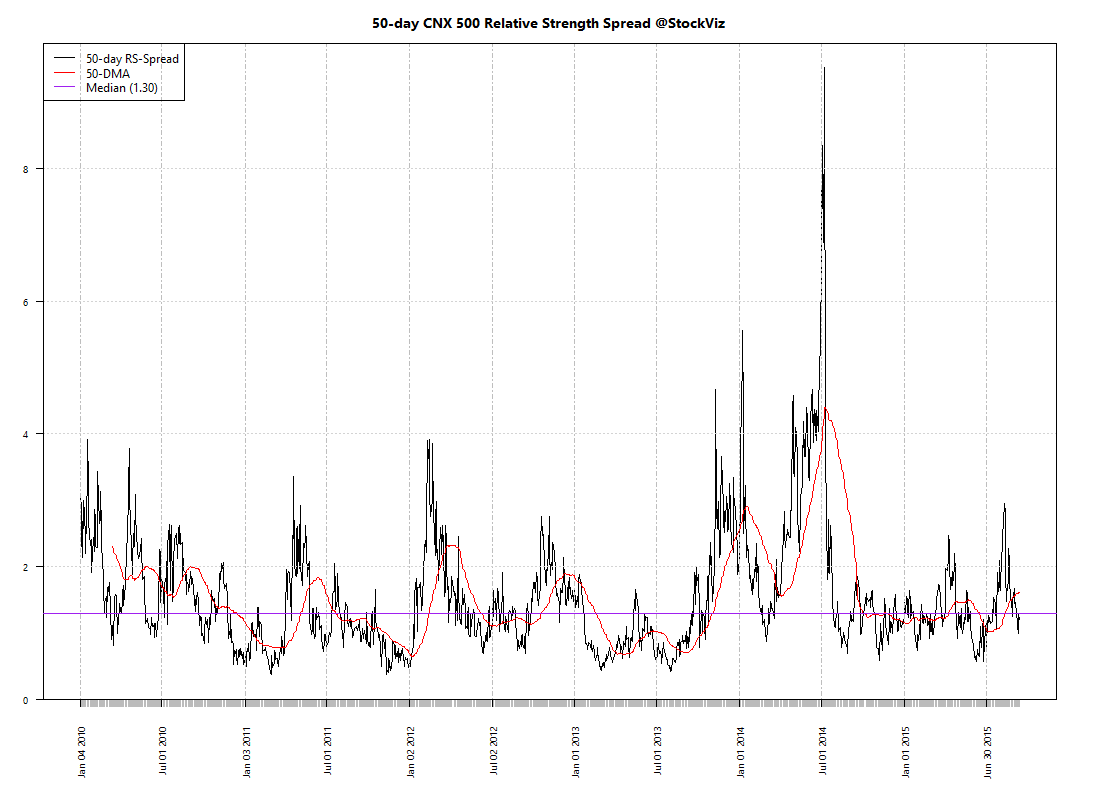
Relative Strength Spread

CNX_500 relative-spread-index 50 2015-09-11 png

Refactored Index Performance

50-day performance, from July 06, 2015 through September 11, 2015:

Trend Model Summary

Index Signal % From Peak Day of Peak
CNX AUTO SHORT
13.65
2015-Jan-27
CNX BANK LONG
19.18
2015-Jan-27
CNX COMMODITIES SHORT
37.69
2008-Jan-04
CNX CONSUMPTION LONG
9.96
2015-Aug-05
CNX ENERGY LONG
37.47
2008-Jan-14
CNX FMCG LONG
12.93
2015-Feb-25
CNX INFRA LONG
53.86
2008-Jan-09
CNX IT SHORT
88.03
2000-Feb-21
CNX MEDIA SHORT
20.45
2008-Jan-04
CNX METAL SHORT
67.83
2008-Jan-04
CNX MNC LONG
10.38
2015-Aug-10
CNX NIFTY SHORT
13.42
2015-Mar-03
CNX PHARMA SHORT
10.77
2015-Apr-08
CNX PSE LONG
36.23
2008-Jan-04
CNX PSU BANK LONG
44.30
2010-Nov-05
CNX REALTY SHORT
91.21
2008-Jan-14
CNX SERVICE LONG
13.95
2015-Mar-03
Has the momentum crash run its course? Seems like the pendulum has swung too far out…

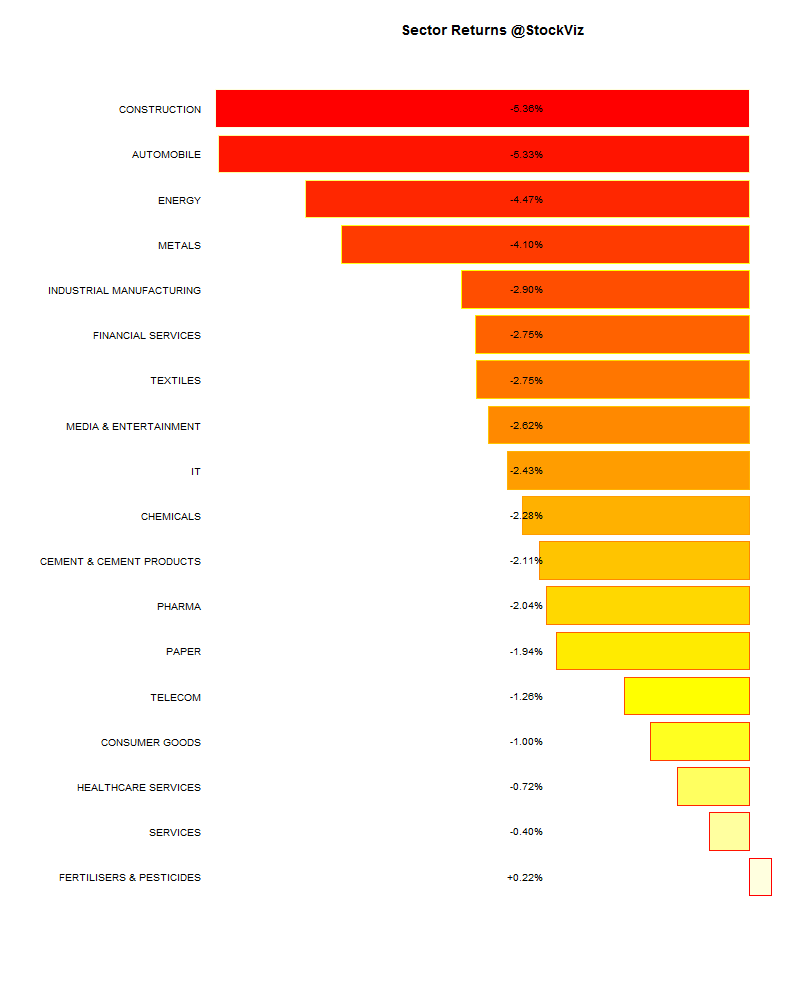
Correlation Update 12.09.2015

Nifty one year daily return correlations

Nifty one year daily return correlations

Nifty one month daily return correlations

Nifty one month daily return correlations

Bank Nifty one year daily return correlations

Bank Nifty one year daily return correlations

Bank Nifty one month daily return correlations

Bank Nifty one month daily return correlations

Midcap one year daily return correlations

Midcap one year daily return correlations

Midcap one month daily return correlations

Midcap one month daily return correlations

A lot of thick blue squares mean that positive correlations are high. Red squares mean negative correlations are high. Whites are the doldrums.

Weekly Recap: Who owns a company?

world.2015-08-28.2015-09-04

Equities

Major
DAX(DEU) -2.53%
CAC(FRA) -3.25%
UKX(GBR) -3.28%
NKY(JPN) -7.02%
SPX(USA) -3.03%
MINTs
JCI(IDN) -0.69%
INMEX(MEX) -1.58%
NGSEINDX(NGA) +2.36%
XU030(TUR) -2.29%
BRICS
IBOV(BRA) -1.17%
SHCOMP(CHN) -2.23%
NIFTY(IND) -4.34%
INDEXCF(RUS) -1.22%
TOP40(ZAF) -1.88%

Commodities

Energy
RBOB Gasoline -7.45%
Ethanol +1.32%
Natural Gas -2.28%
WTI Crude Oil +1.10%
Brent Crude Oil -1.08%
Heating Oil +0.74%
Metals
Gold 100oz -0.98%
Platinum -2.53%
Silver 5000oz +0.69%
Copper -0.43%
Palladium -2.30%

Currencies

USDEUR:+0.30% USDJPY:-1.90%

MINTs
USDIDR(IDN) +1.36%
USDMXN(MEX) +1.03%
USDNGN(NGA) +0.04%
USDTRY(TUR) +2.88%
BRICS
USDBRL(BRA) +7.20%
USDCNY(CHN) -0.53%
USDINR(IND) +0.46%
USDRUB(RUS) +4.73%
USDZAR(ZAF) +4.06%
Agricultural
Cattle -3.81%
Lean Hogs +3.91%
Lumber -1.47%
Sugar #11 +2.65%
White Sugar +2.26%
Cocoa +2.79%
Orange Juice +1.51%
Soybean Meal -2.37%
Coffee (Arabica) -4.06%
Soybeans -1.96%
Wheat -4.08%
Coffee (Robusta) +1.66%
Corn -3.79%
Cotton -1.87%
Feeder Cattle -0.74%

Credit Indices

Index Change
Markit CDX EM -0.65%
Markit CDX NA HY -1.01%
Markit CDX NA IG +3.80%
Markit iTraxx Asia ex-Japan IG +9.23%
Markit iTraxx Australia +3.94%
Markit iTraxx Europe +3.26%
Markit iTraxx Europe Crossover +16.42%
Markit iTraxx Japan +2.03%
Markit iTraxx SovX Western Europe +0.09%
Markit LCDX (Loan CDS) +0.00%
Markit MCDX (Municipal CDS) -1.50%
Markets ended the week in an ocean of red ink. Being “better” than other EMs may mean just that we tank 10% while others tank 20%…

Nifty Heatmap
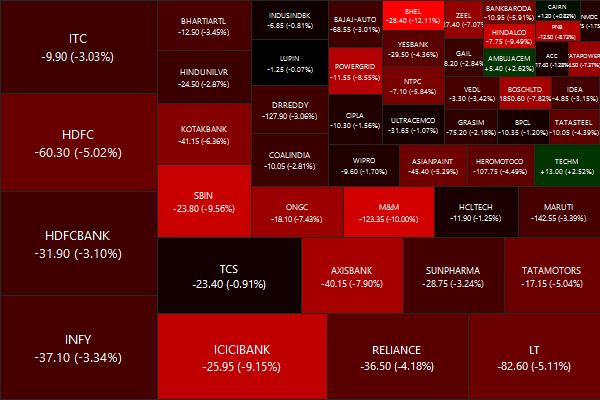
CNX NIFTY.2015-08-28.2015-09-04

Index Returns

For a deeper dive into indices, check out our weekly Index Update.
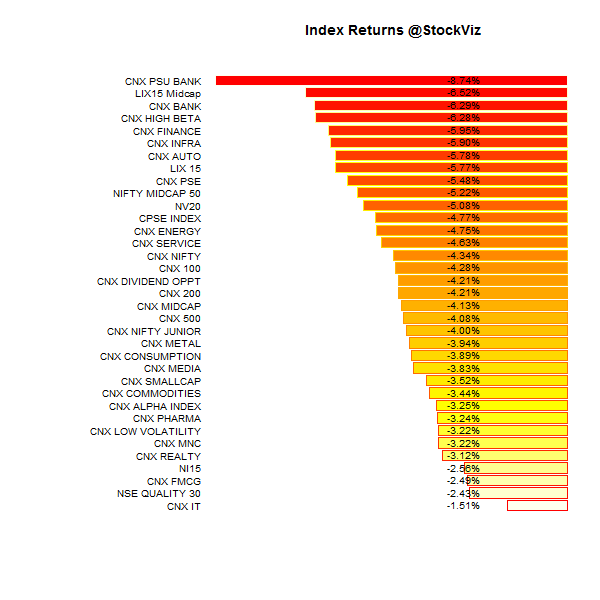
index.performance.2015-08-28.2015-09-04

Sector Performance

sector performance.2015-08-28.2015-09-04

Market Cap Decile Performance

Decile Mkt. Cap. Adv/Decl
1 (micro) -3.55% 74/61
2 -3.57% 65/69
3 -1.10% 68/66
4 -1.12% 70/65
5 -1.60% 65/69
6 -1.91% 65/69
7 -1.03% 63/72
8 -0.72% 69/65
9 -0.28% 70/64
10 (mega) -1.63% 68/67
Stocks were punished across the board…

Top Winners and Losers

INFRATEL +4.33%
RELCAPITAL +4.48%
SRTRANSFIN +4.74%
GLENMARK -12.64%
BHEL -12.11%
UNIONBANK -10.37%
A total tossup…

ETF Performance

GOLDBEES -0.27%
JUNIORBEES -2.75%
CPSEETF -3.83%
NIFTYBEES -4.04%
INFRABEES -5.82%
BANKBEES -5.93%
PSUBNKBEES -9.29%
PSBs got shellacked… Gold didn’t escape the selling pressure either…

Yield Curve
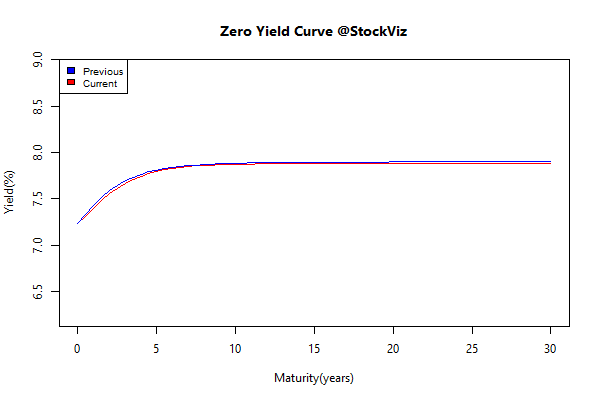
yield Curve.2015-08-28.2015-09-04

Bond Indices

Sub Index Change in YTM Total Return(%)
0 5 -0.01 +0.15%
5 10 -0.02 +0.23%
10 15 +0.02 +0.02%
15 20 -0.06 +0.67%
20 30 -0.01 +0.20%
Bonds went up a smidgen…

Investment Theme Performance

No investment strategy escaped the relentless selling pressure…

Equity Mutual Funds

Bond Mutual Funds

Thought for the weekend

For publicly listed companies, its owners are its shareholders. It is they who claim the profits of the company, potentially in perpetuity. It is they who exercise control rights over the management of the company from whom they are distinct. And it is they whose objectives have primacy in the running of the company.

Yet despite its durability and success, across countries and across time, this corporate model has not gone unquestioned. Recently, these questions have come thick and fast, with a rising tide of criticism of companies’ behaviour, from excessive executive remuneration, to unethical practices, to monopoly or oligopoly powers, to short-termism. These concerns appear to be both strongly-felt and widely-held.

So who owns them?

Source: Andrew G Haldane: Who owns a company?