Equities
Commodities
| Energy |
| RBOB Gasoline |
-1.41% |
| WTI Crude Oil |
-0.38% |
| Natural Gas |
-3.41% |
| Brent Crude Oil |
-2.43% |
| Heating Oil |
-4.14% |
| Ethanol |
+3.91% |
| Metals |
| Gold 100oz |
+3.22% |
| Copper |
-2.85% |
| Palladium |
+2.54% |
| Platinum |
+1.58% |
| Silver 5000oz |
+5.52% |
| Agricultural |
| Cattle |
-3.34% |
| Feeder Cattle |
-3.78% |
| Sugar #11 |
-5.90% |
| White Sugar |
-1.24% |
| Cocoa |
+1.15% |
| Soybeans |
-2.28% |
| Wheat |
+2.85% |
| Coffee (Robusta) |
+1.36% |
| Lean Hogs |
+5.91% |
| Lumber |
-5.86% |
| Orange Juice |
-1.46% |
| Soybean Meal |
-1.46% |
| Coffee (Arabica) |
+4.42% |
| Corn |
+0.73% |
| Cotton |
-7.91% |
Credit Indices
| Index |
Change |
| Markit CDX EM |
+0.87% |
| Markit CDX NA HY |
+0.25% |
| Markit CDX NA IG |
-2.42% |
| Markit iTraxx Asia ex-Japan IG |
-6.65% |
| Markit iTraxx Australia |
-1.53% |
| Markit iTraxx Europe |
-0.30% |
| Markit iTraxx Europe Crossover |
-2.09% |
| Markit iTraxx Japan |
-1.94% |
| Markit iTraxx SovX Western Europe |
-0.41% |
| Markit LCDX (Loan CDS) |
+0.00% |
| Markit MCDX (Municipal CDS) |
-0.22% |
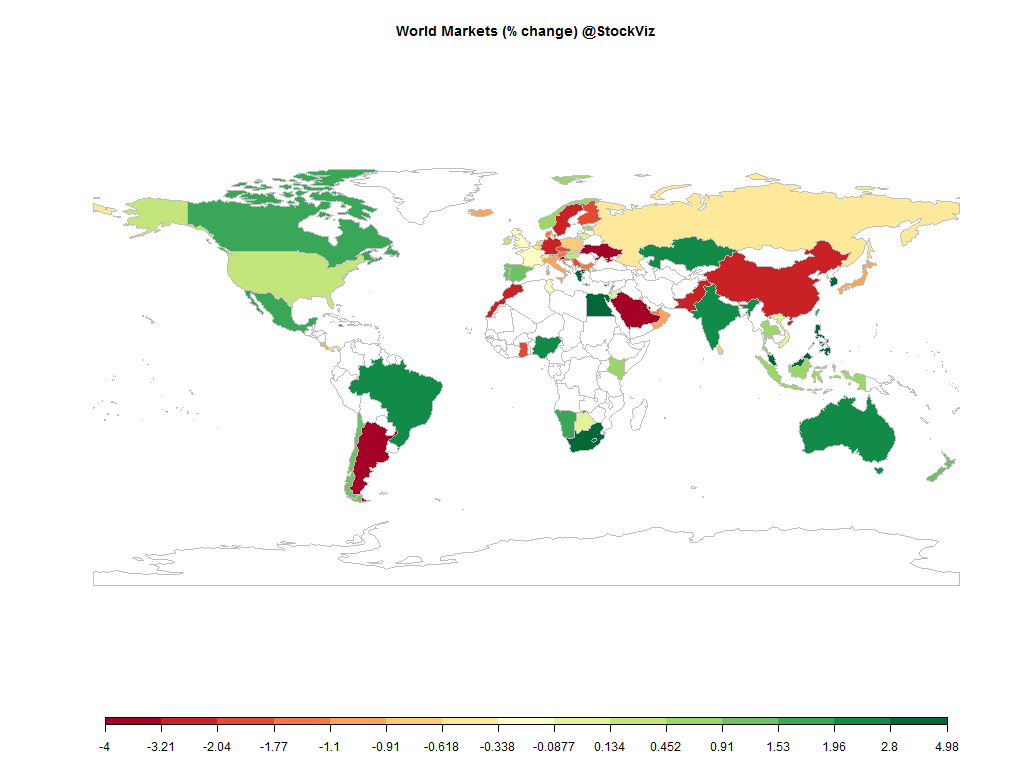
Did the Fed just yell “FIRE” in a crowded room? Their decision to hold rates at zero on Thursday seemed to have shifted the market’s worry on the slowing world economy…
International ETFs (in USD)
|
5yr
|
2yr
|
1yr
|
1wk
|
EWM
iShares MSCI Malaysia |
-11.55%
|
-30.48%
|
-30.9%
|
+5.64%
|
GREK
Global X FTSE Greece 20 |
|
-45.28%
|
-45.54%
|
+4.76%
|
NGE
Global X MSCI Nigeria |
|
-37.25%
|
-40.9%
|
+4.22%
|
EZA
iShares MSCI South Africa |
-0.41%
|
-14.19%
|
-16.79%
|
+3.5%
|
TUR
iShares MSCI Turkey |
-41.1%
|
-37.41%
|
-30.19%
|
+3.15%
|
EWY
iShares MSCI South Korea Capped |
+0.4%
|
-20.12%
|
-20.37%
|
+3.11%
|
GXG
Global X MSCI Colombia |
-52.87%
|
-53.55%
|
-52.94%
|
+2.99%
|
ICOL
iShares MSCI Colombia Capped |
|
-53.45%
|
-53.5%
|
+2.58%
|
EPHE
iShares MSCI Philippines |
|
-2.17%
|
-8.73%
|
+2.57%
|
INDA
iShares MSCI India |
|
+18.41%
|
-10.88%
|
+2.35%
|
EGPT
Market Vectors Egypt |
-37.94%
|
-9.32%
|
-43.79%
|
+2.2%
|
ENZL
iShares MSCI New Zealand Capped |
+47.44%
|
-9.44%
|
-14.61%
|
+2.1%
|
ECH
iShares MSCI Chile Capped |
-49.65%
|
-33.38%
|
-18.67%
|
+1.63%
|
EIRL
iShares MSCI Ireland Capped |
+128.56%
|
+26.76%
|
+16.69%
|
+1.56%
|
RSX
Market Vectors Russia |
-43.09%
|
-42.19%
|
-29.21%
|
+1.39%
|
EWA
iShares MSCI Australia |
-1.38%
|
-23.64%
|
-24.2%
|
+1.36%
|
ERUS
iShares MSCI Russia Capped |
|
-42.52%
|
-27.7%
|
+1.14%
|
EWT
iShares MSCI Taiwan |
+16.88%
|
-0.86%
|
-12.23%
|
+1.1%
|
PGAL
Global X FTSE Portugal 20 |
|
|
-27.98%
|
+0.99%
|
FXI
iShares China Large-Cap |
-4.75%
|
-4.27%
|
-8.7%
|
+0.72%
|
EWC
iShares MSCI Canada |
-5.21%
|
-14.43%
|
-25.55%
|
+0.72%
|
EWH
iShares MSCI Hong Kong |
+27.47%
|
+1.13%
|
-6.89%
|
+0.41%
|
EWG
iShares MSCI Germany |
+32.24%
|
-6.97%
|
-12.02%
|
-2.72%
|
EWI
iShares MSCI Italy Capped |
+0.48%
|
+3.26%
|
-9.28%
|
-2.28%
|
FEZ
SPDR Euro STOXX 50 |
+13.31%
|
-7.27%
|
-14.7%
|
-2.16%
|
EWD
iShares MSCI Sweden |
+23.83%
|
-11.94%
|
-11.29%
|
-1.89%
|
EWJ
iShares MSCI Japan |
+24.7%
|
-2.62%
|
-1.79%
|
-1.88%
|
EWZ
iShares MSCI Brazil Capped |
-63.52%
|
-52.16%
|
-52.42%
|
-1.81%
|
QAT
iShares MSCI Qatar Capped |
|
|
-20.51%
|
-1.57%
|
EWQ
iShares MSCI France |
+18.69%
|
-6.81%
|
-9.71%
|
-1.56%
|
EIDO
iShares MSCI Indonesia |
-31.34%
|
-32.2%
|
-34.27%
|
-1.39%
|
EWO
iShares MSCI Austria Capped |
-9.4%
|
-17.77%
|
-10.68%
|
-1.23%
|
EPOL
iShares MSCI Poland Capped |
-16.52%
|
-22.39%
|
-23.13%
|
-1.09%
|
EWU
iShares MSCI United Kingdom |
+22.5%
|
-9%
|
-14.92%
|
-0.71%
|
THD
iShares MSCI Thailand Capped |
+25.81%
|
-18.42%
|
-22.42%
|
-0.63%
|
NORW
Global X MSCI Norway |
|
-29.21%
|
-32.51%
|
-0.56%
|
UAE
iShares MSCI UAE Capped |
|
|
-28.03%
|
-0.53%
|
EDEN
iShares MSCI Denmark Capped |
|
+36.37%
|
+7.13%
|
-0.48%
|
SPY
SPDR S&P 500 |
+87.49%
|
+16.81%
|
-1.77%
|
-0.25%
|
ISRA
Market Vectors Israel |
|
+15.03%
|
-0.1%
|
-0.19%
|
EWL
iShares MSCI Switzerland Capped |
+52.24%
|
+2.83%
|
-5.36%
|
-0.13%
|
EPU
iShares MSCI All Peru Capped |
-37.31%
|
-31.38%
|
-36.47%
|
-0.04%
|
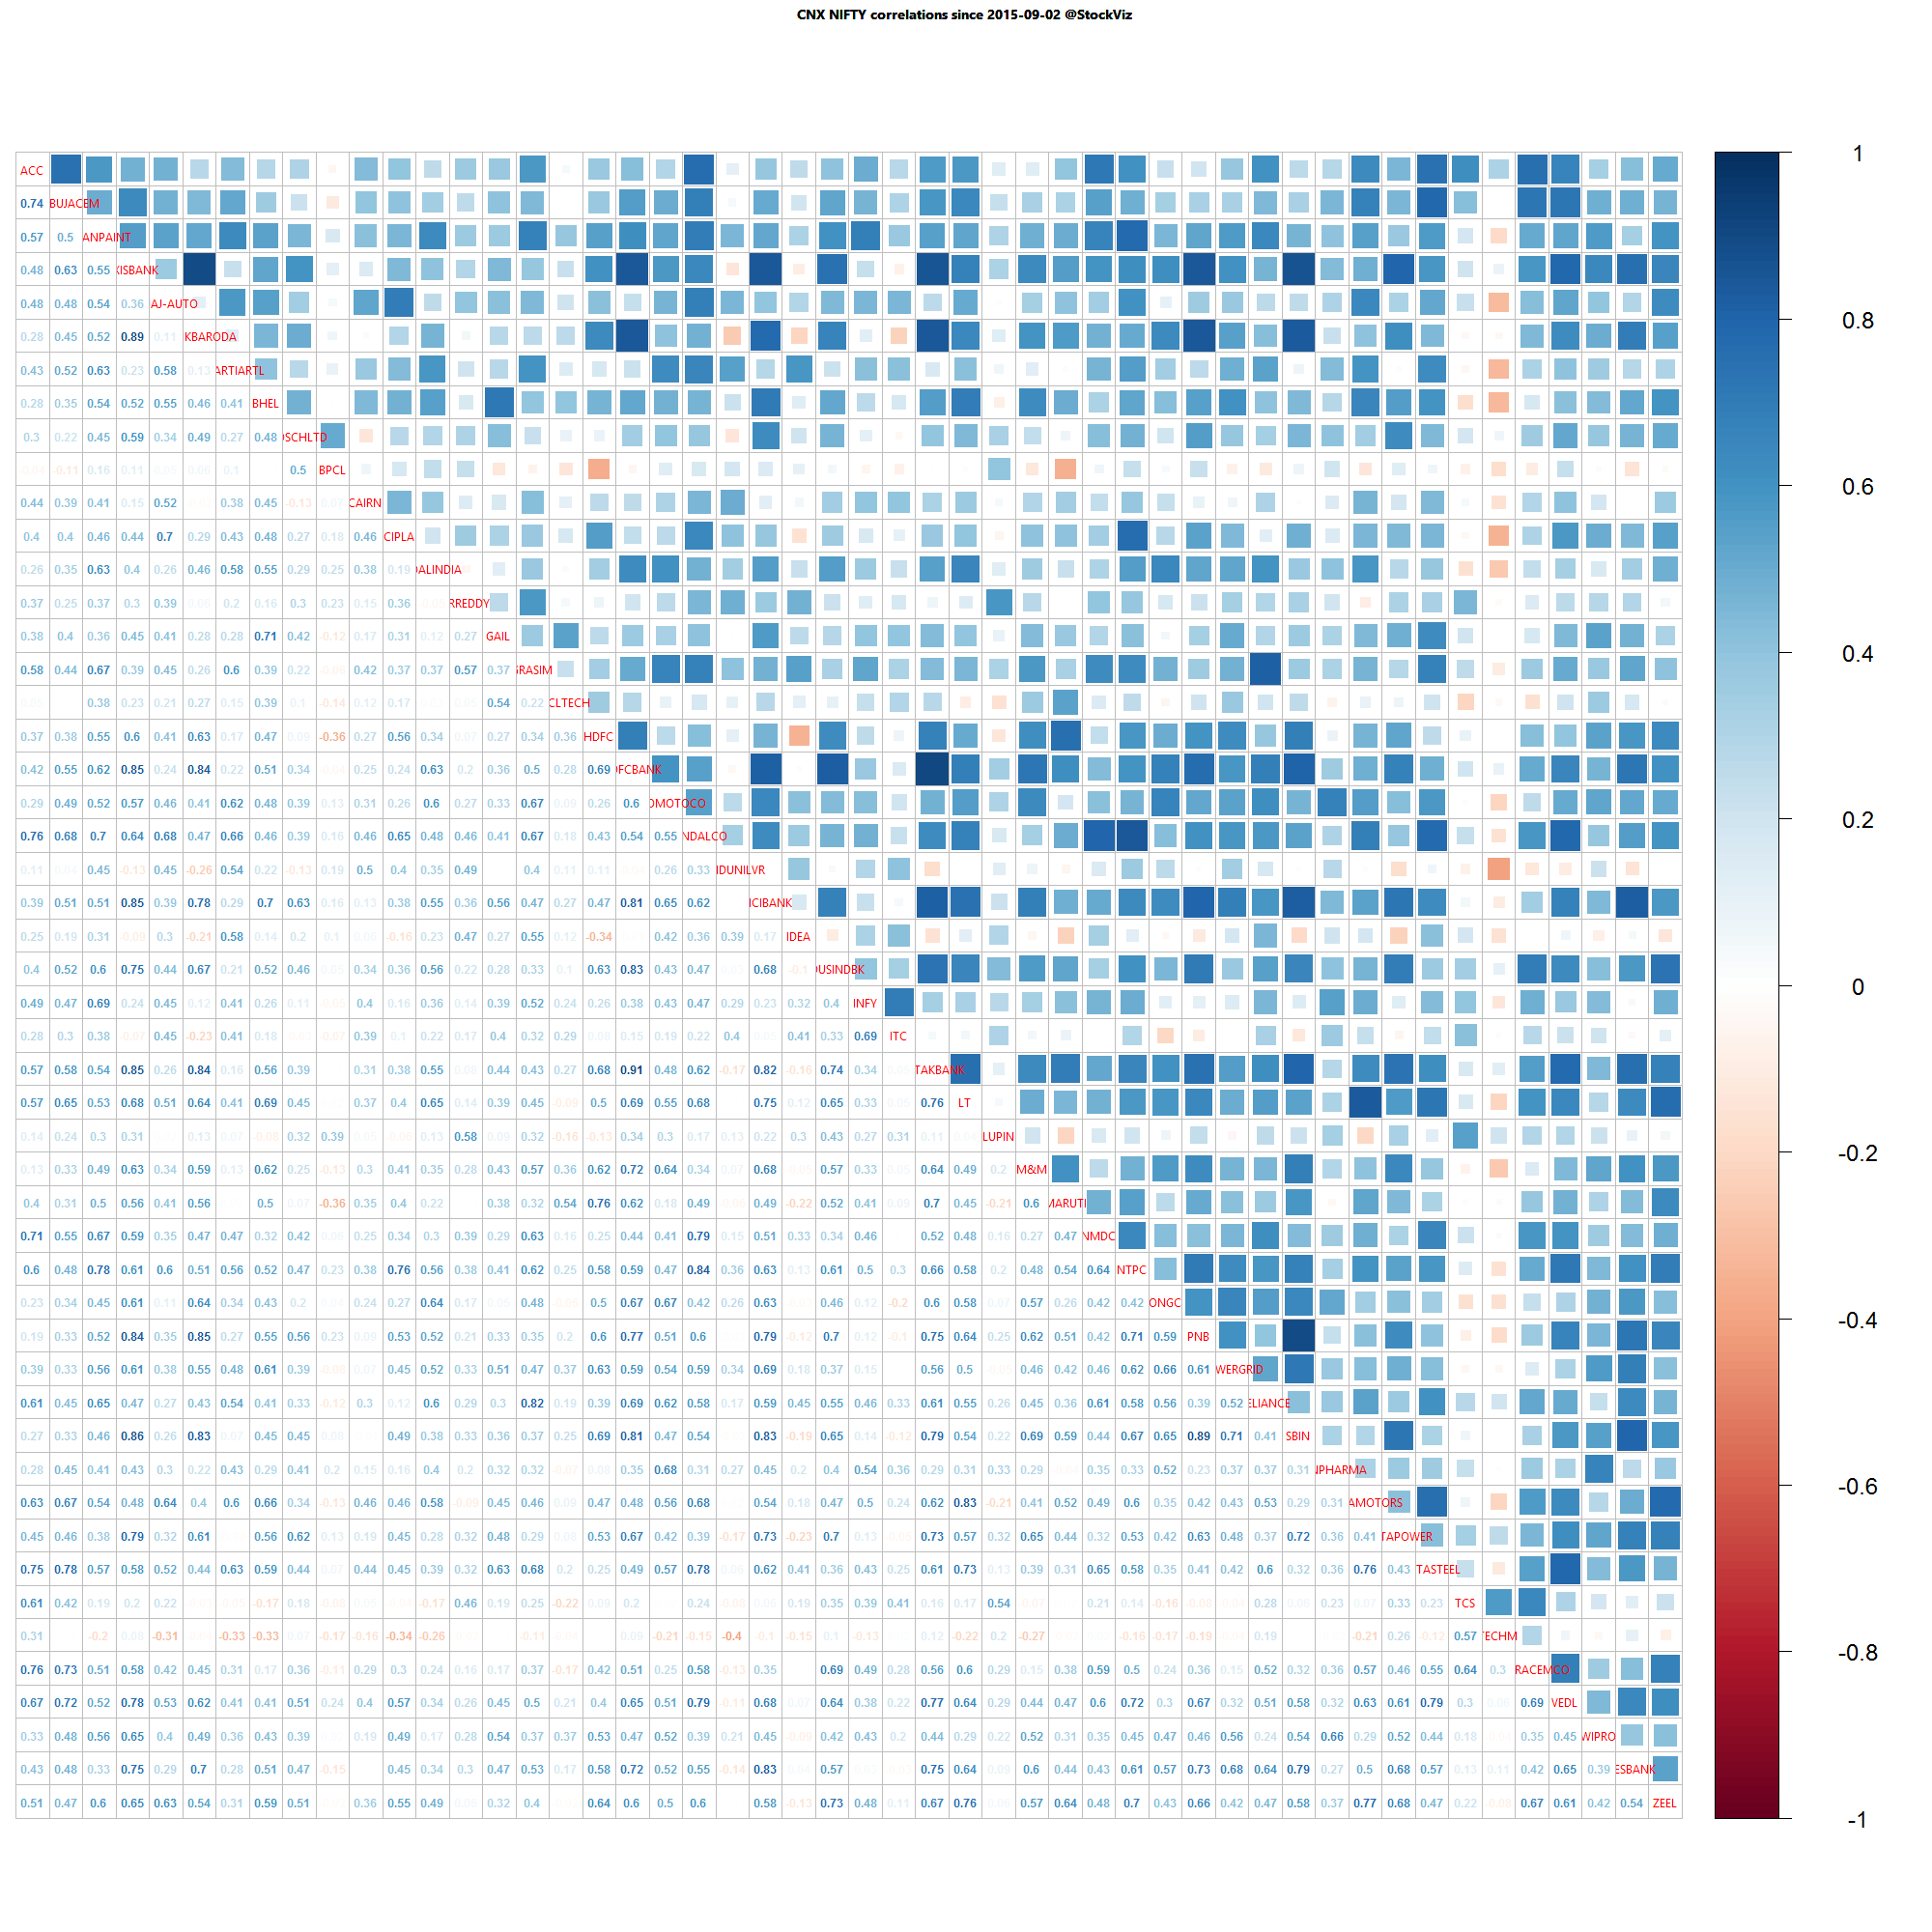
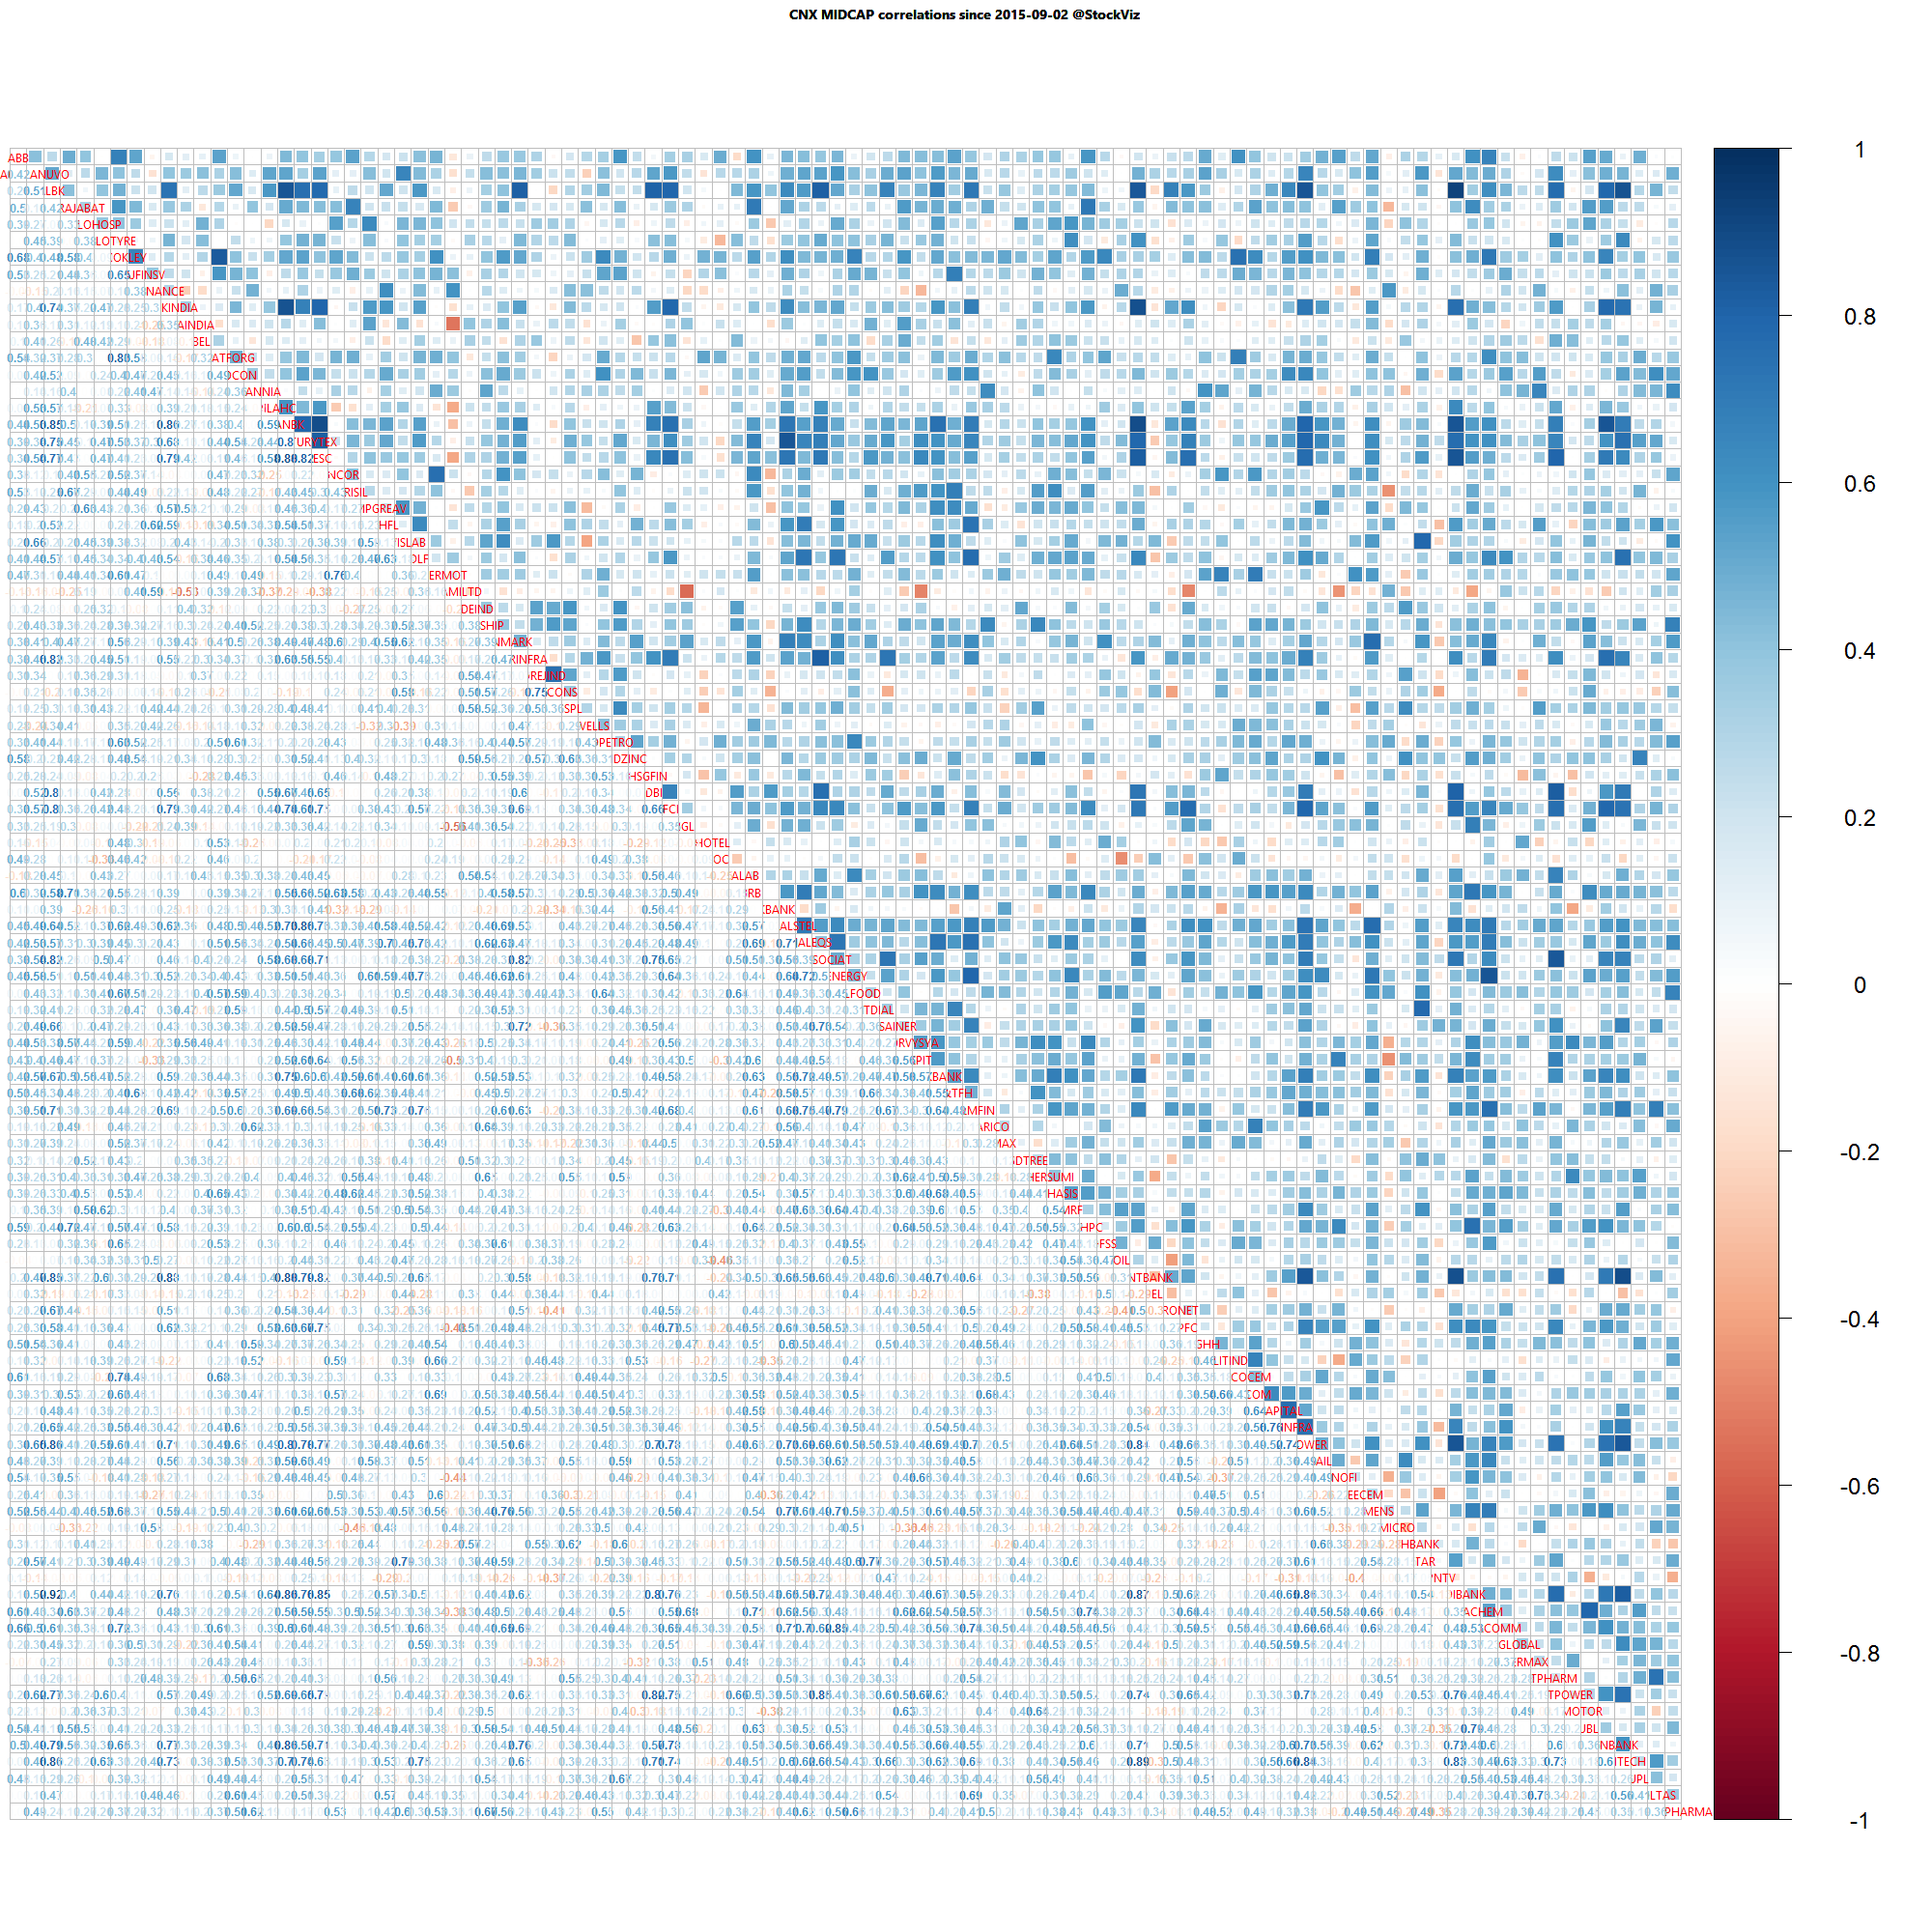
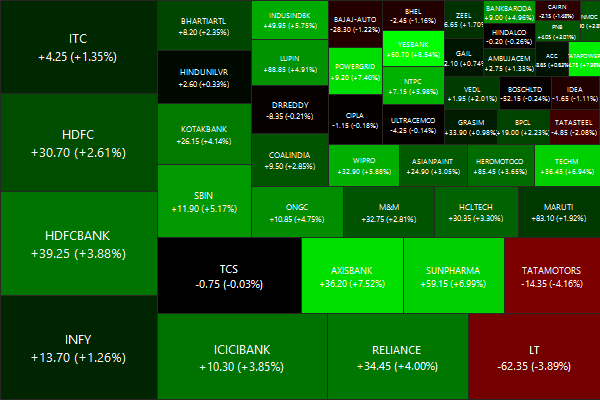
Nifty Heatmap
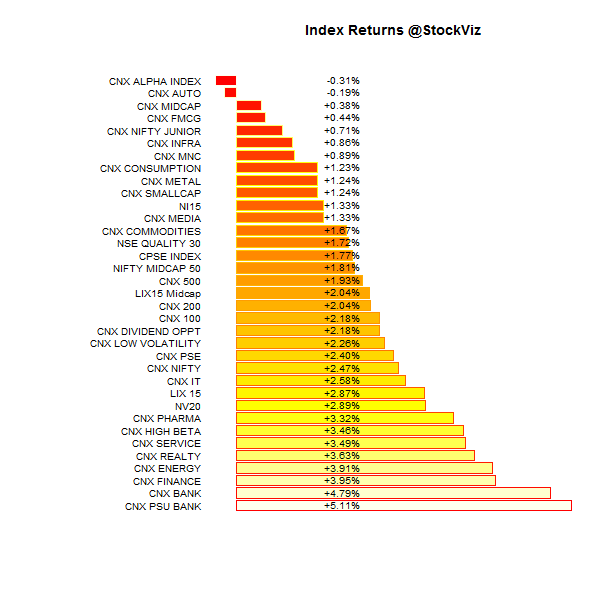
Index Returns
For a deeper dive into indices, check out our weekly Index Update.
Market Cap Decile Performance
| Decile |
Mkt. Cap. |
Adv/Decl |
| 1 |
+1.75% |
63/66 |
| 2 |
+1.78% |
70/59 |
| 3 |
+2.87% |
67/62 |
| 4 |
+2.11% |
75/54 |
| 5 |
+2.82% |
75/54 |
| 6 |
+2.10% |
62/67 |
| 7 |
+0.92% |
65/65 |
| 8 |
+1.20% |
64/64 |
| 9 |
+0.90% |
64/65 |
| 10 |
+1.03% |
59/71 |
A broad based rally on the back of ZIRP…
Top Winners and Losers
Bharat Forge got dinged pretty bad…
ETF Performance
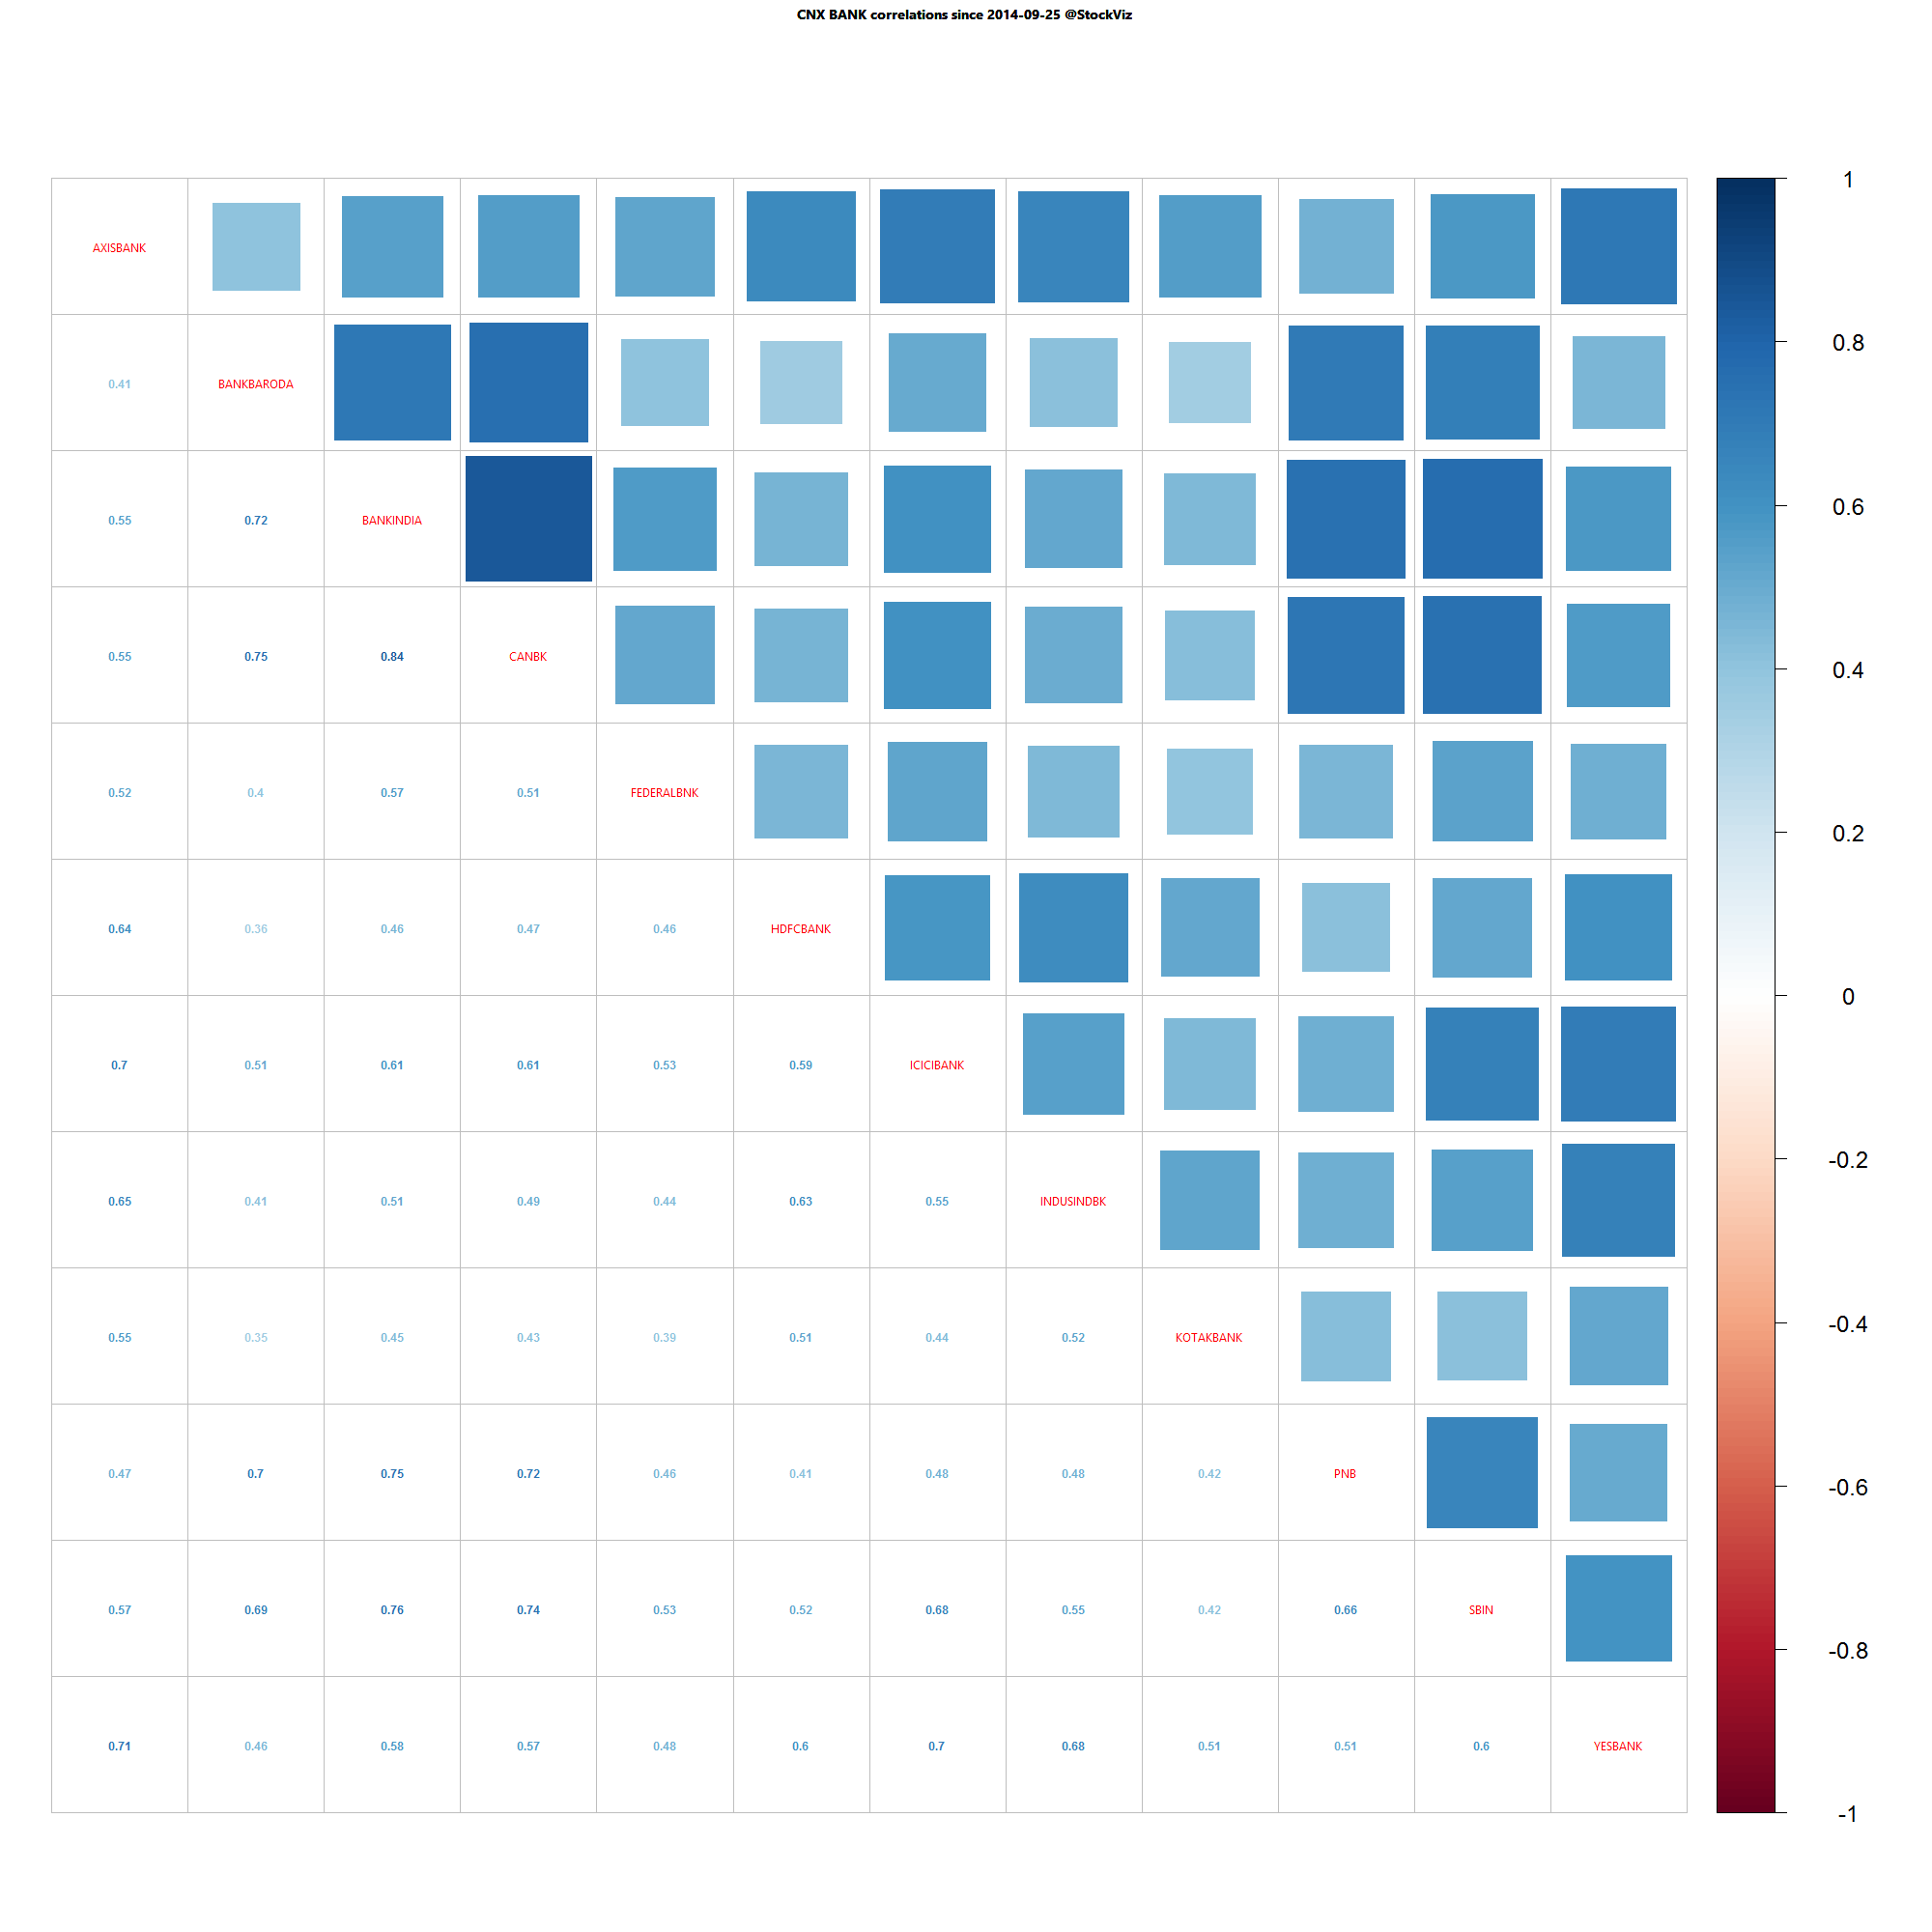
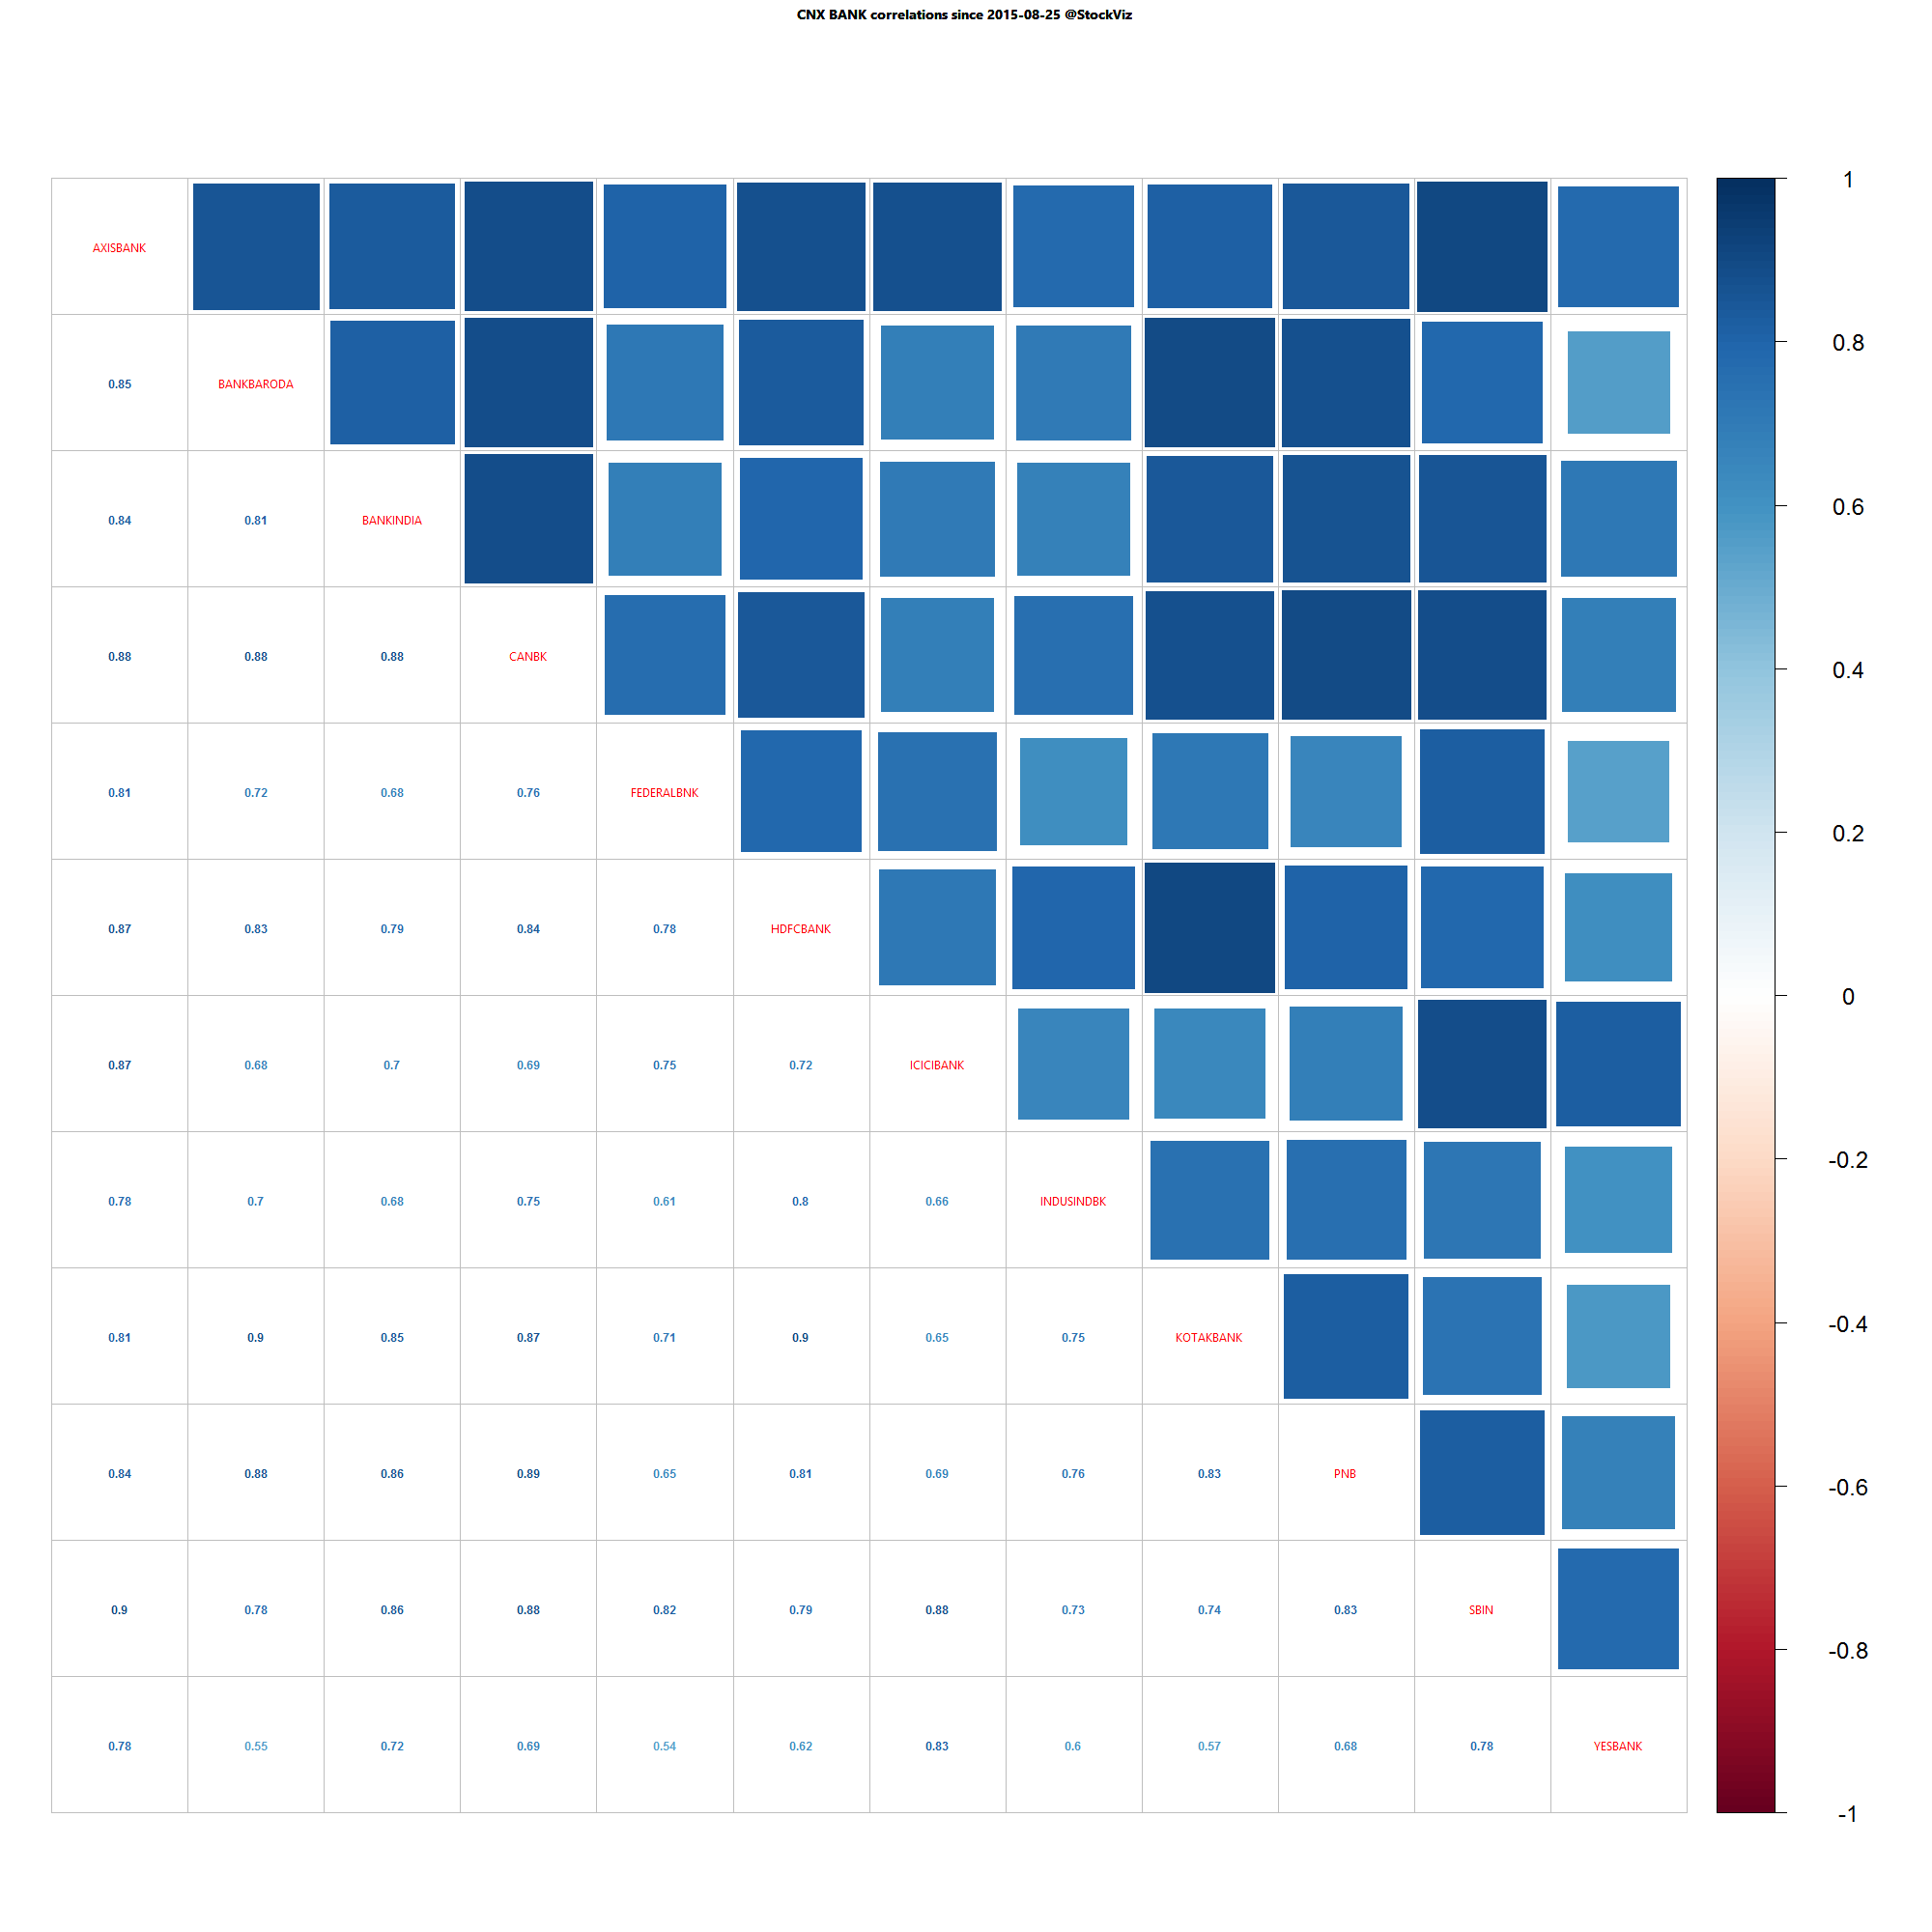
Banks caught a rally on the back of rumors of FDI being hiked to 100%…
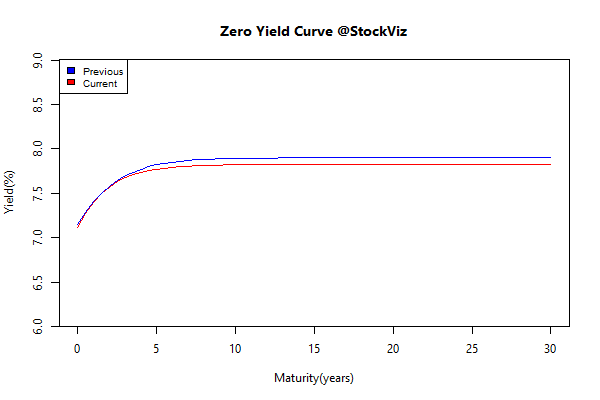
Yield Curve
Bond Indices
| Sub Index |
Change in YTM |
Total Return(%) |
| 0 5 |
-0.05 |
+0.29% |
| 5 10 |
-0.05 |
+0.43% |
| 10 15 |
-0.06 |
+0.62% |
| 15 20 |
-0.06 |
+0.72% |
| 20 30 |
-0.06 |
+0.79% |
The bond market has factored in a rate-cut later this month…
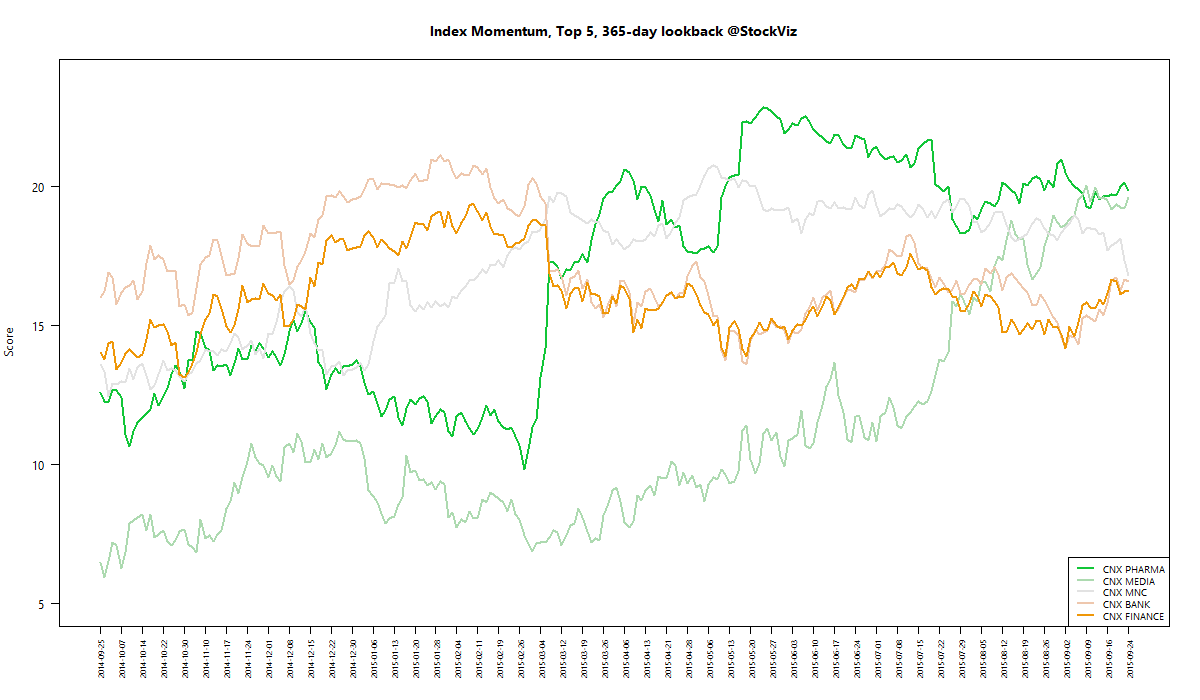
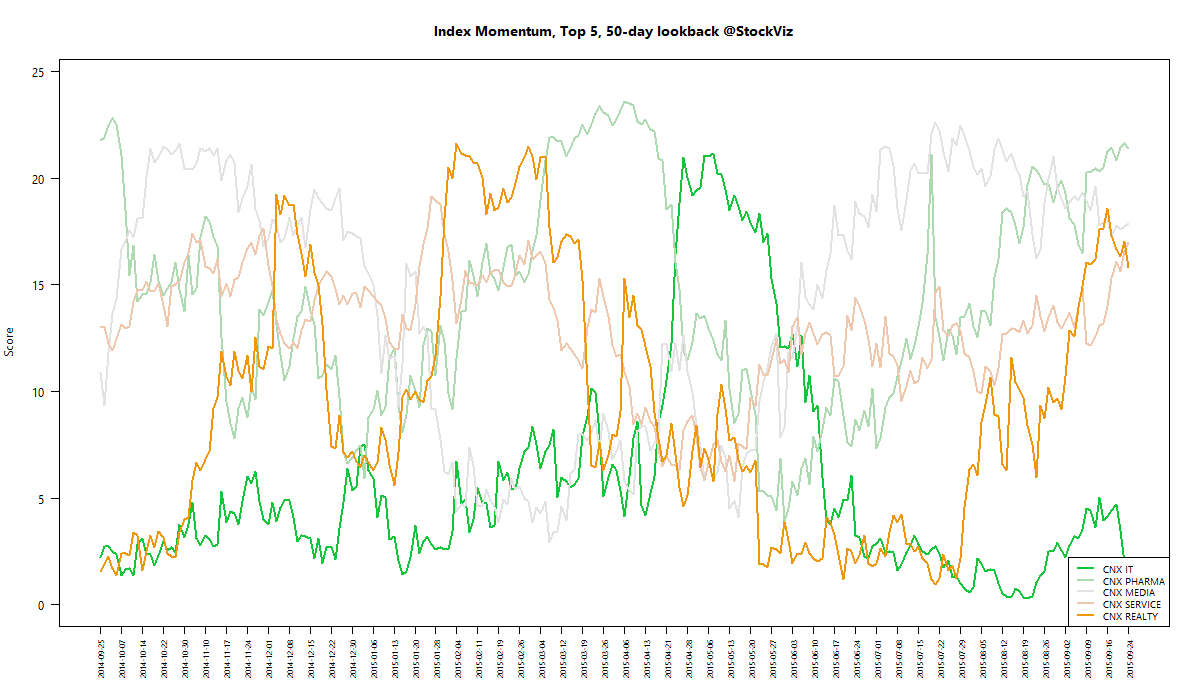
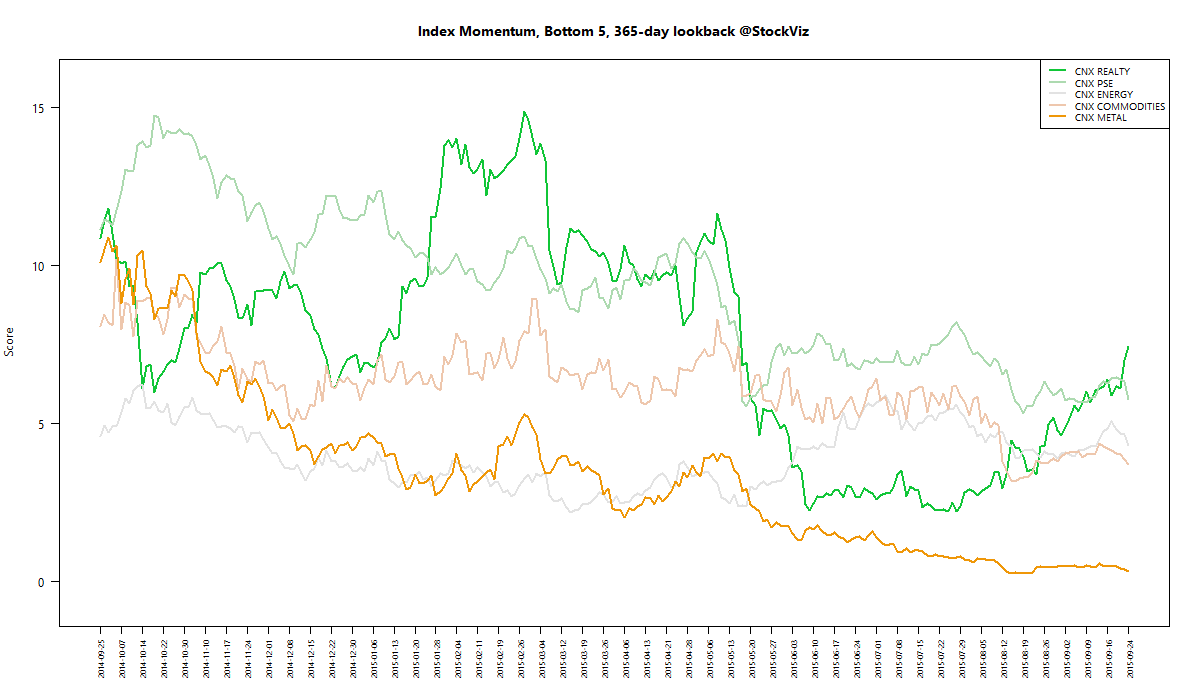
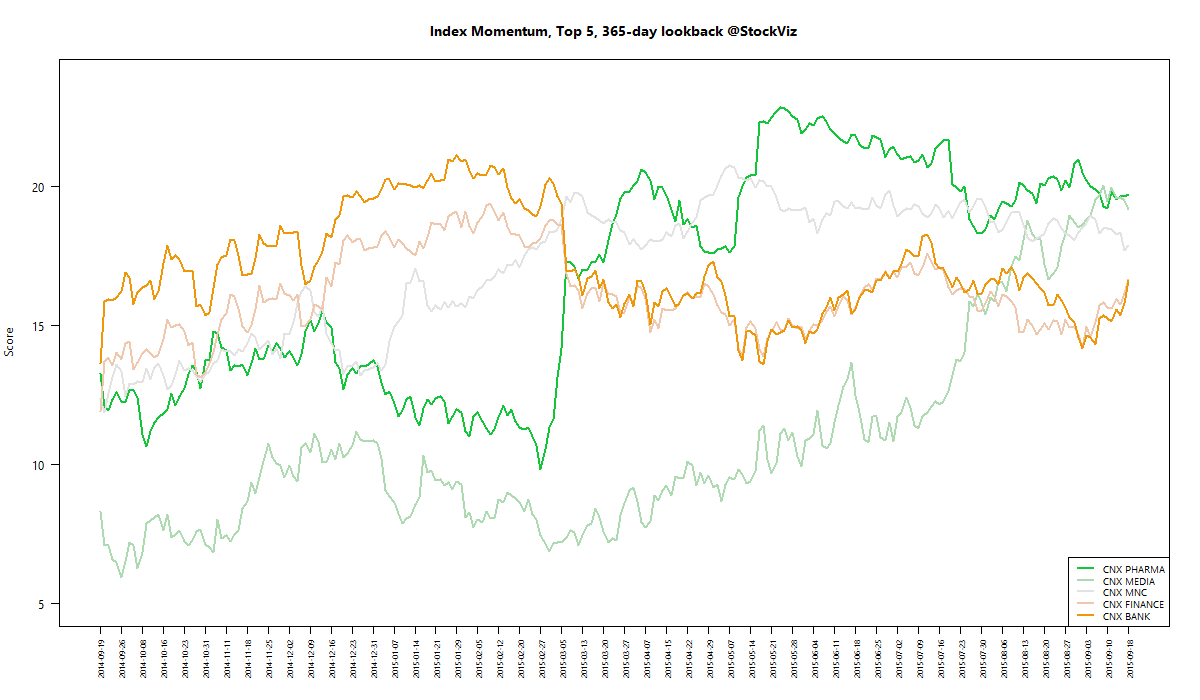
Investment Theme Performance
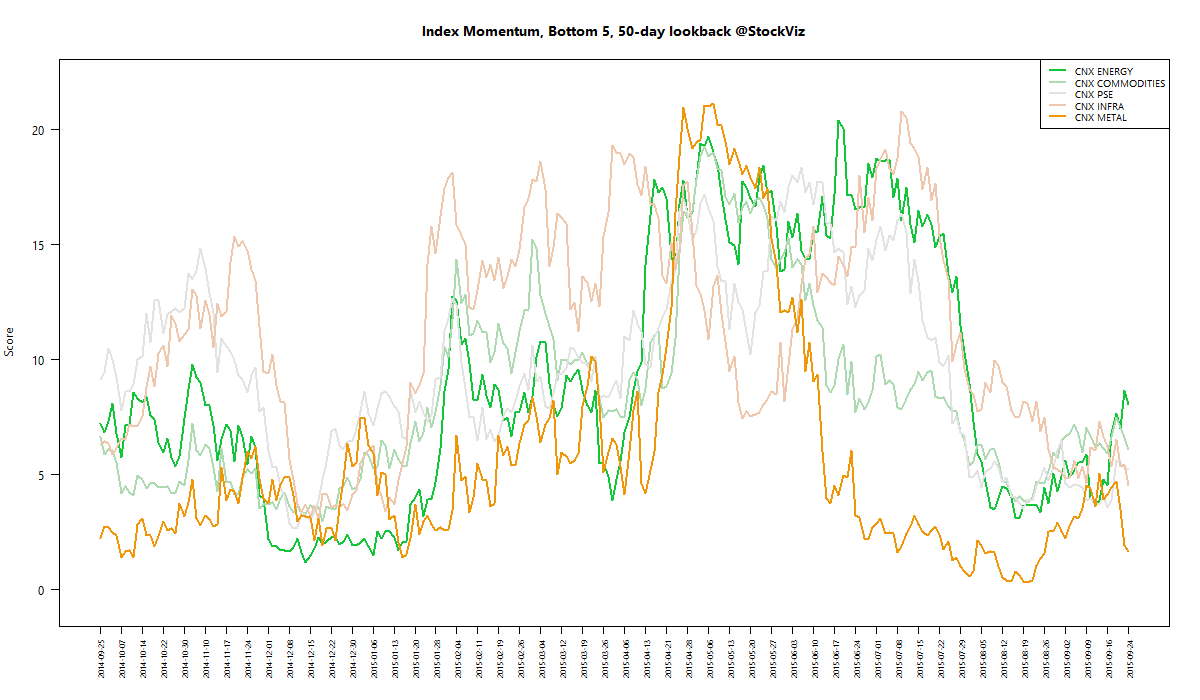
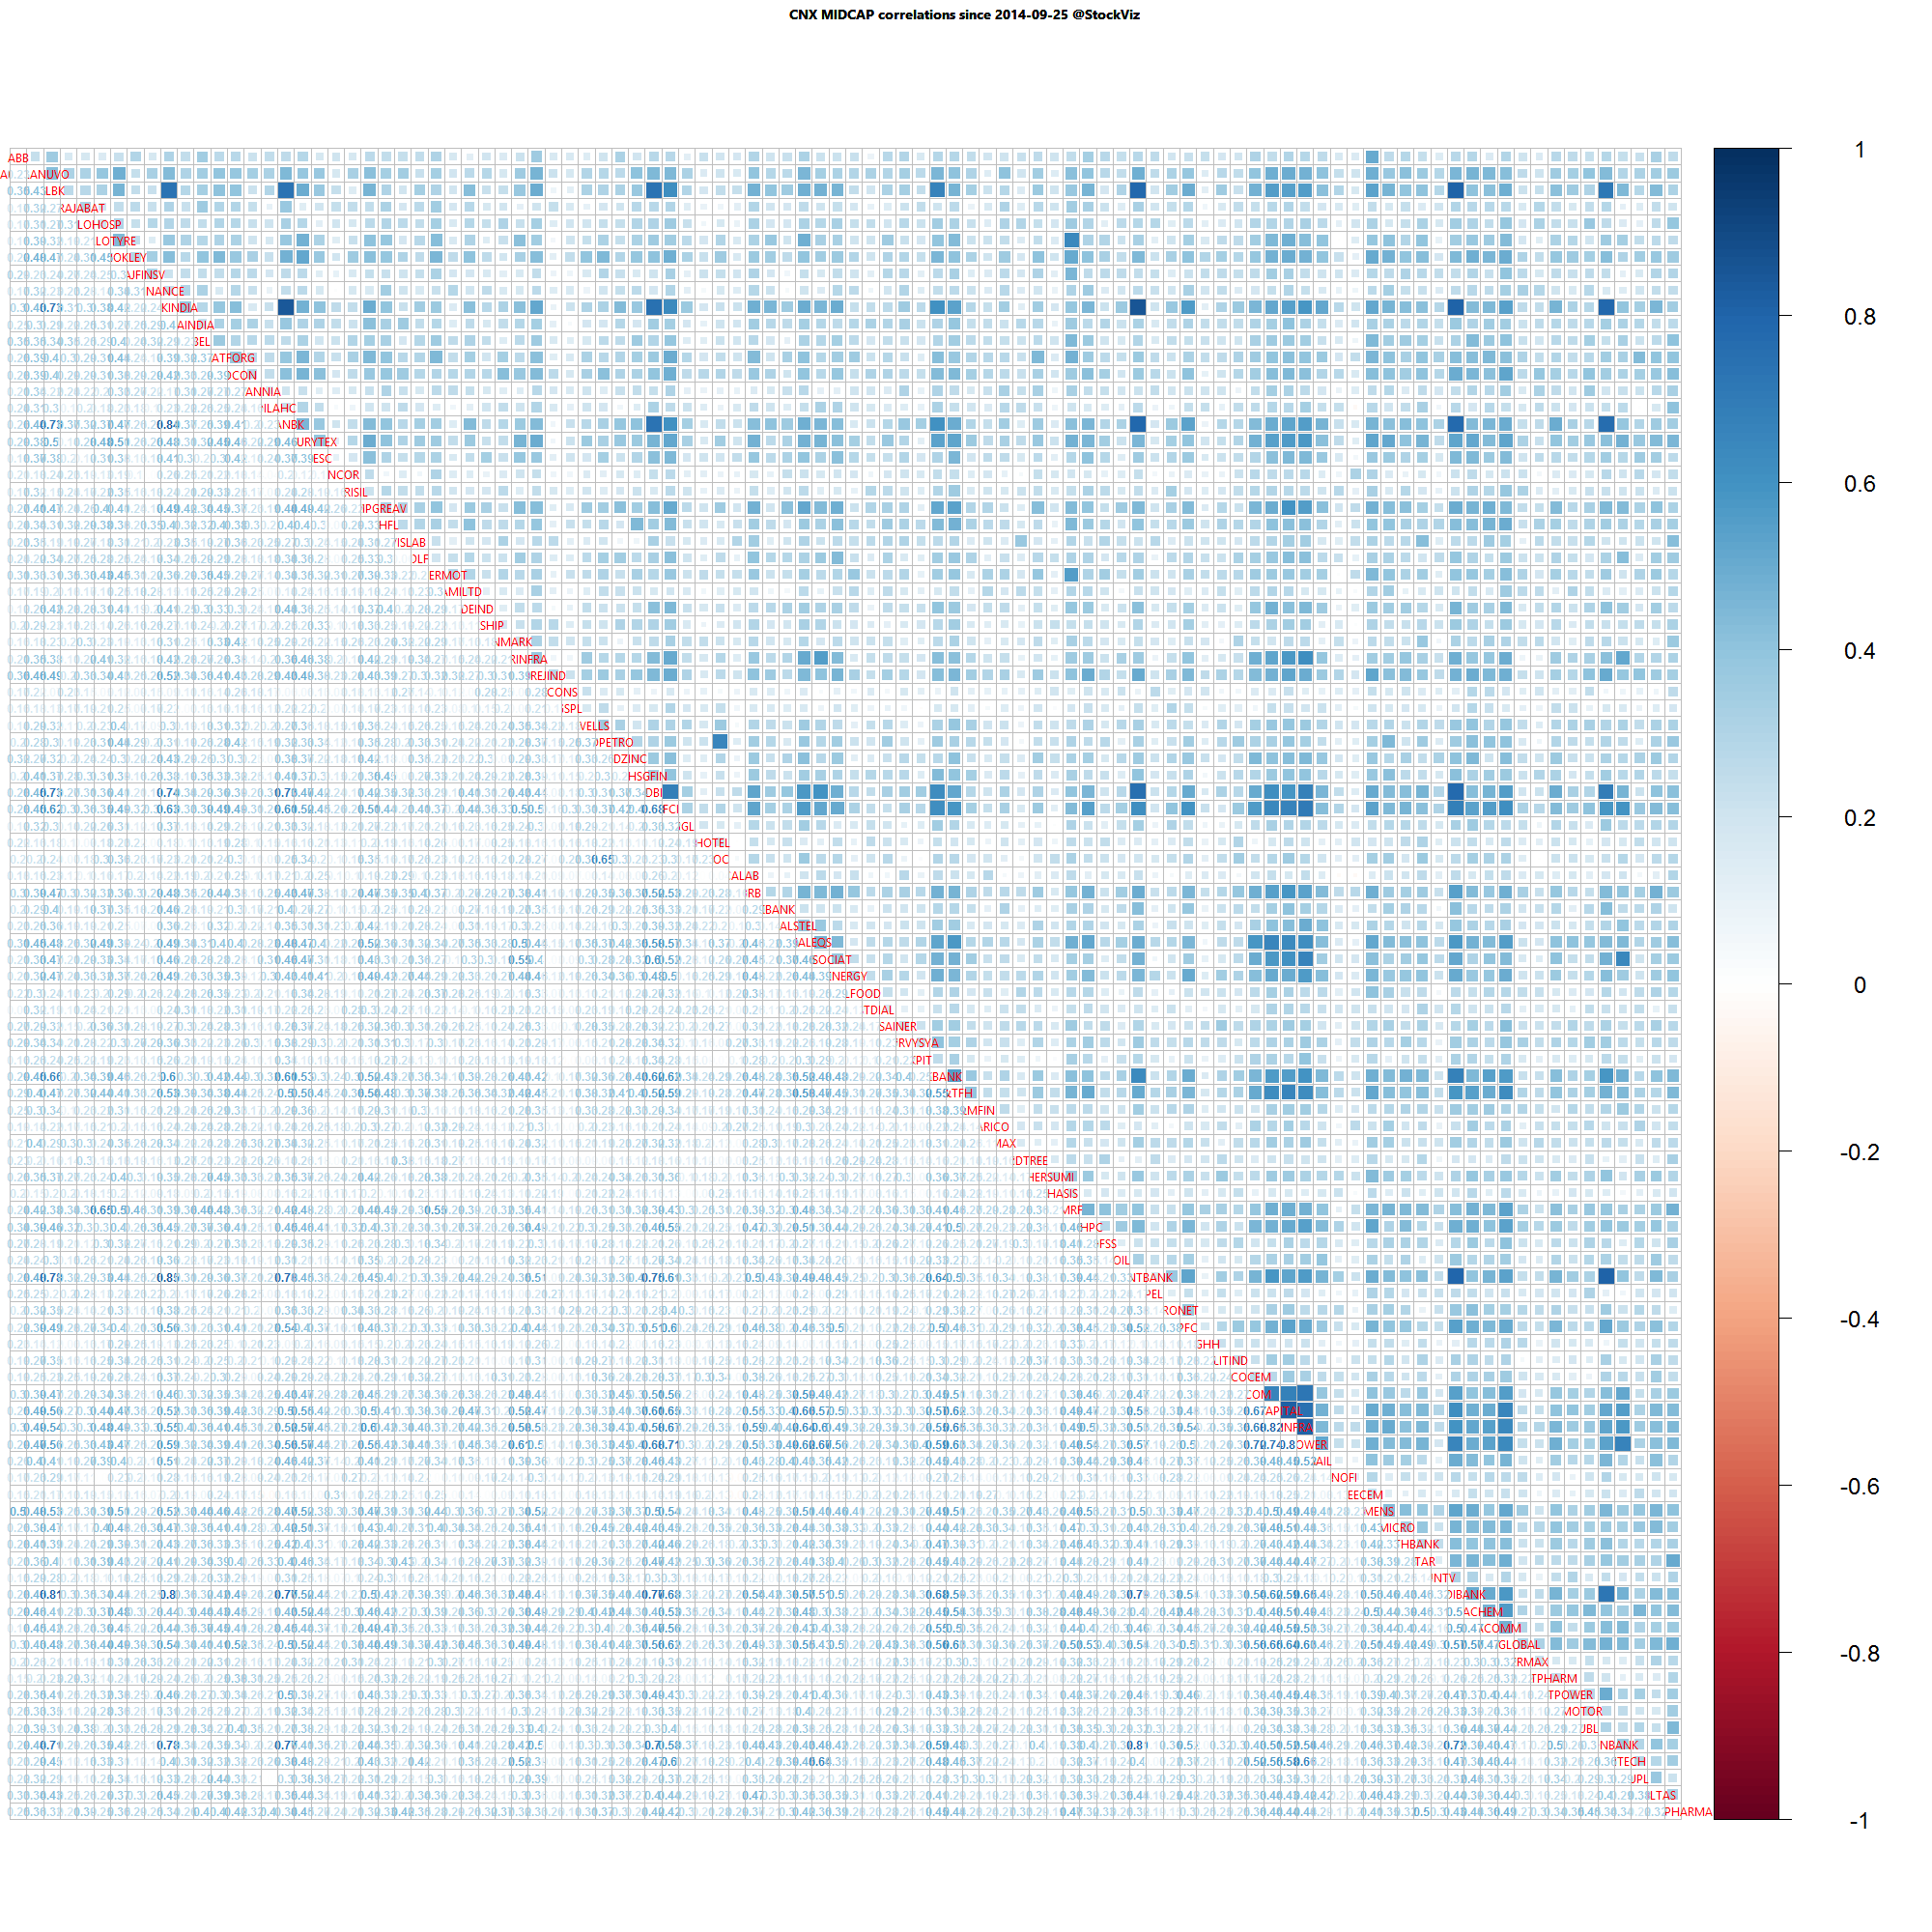
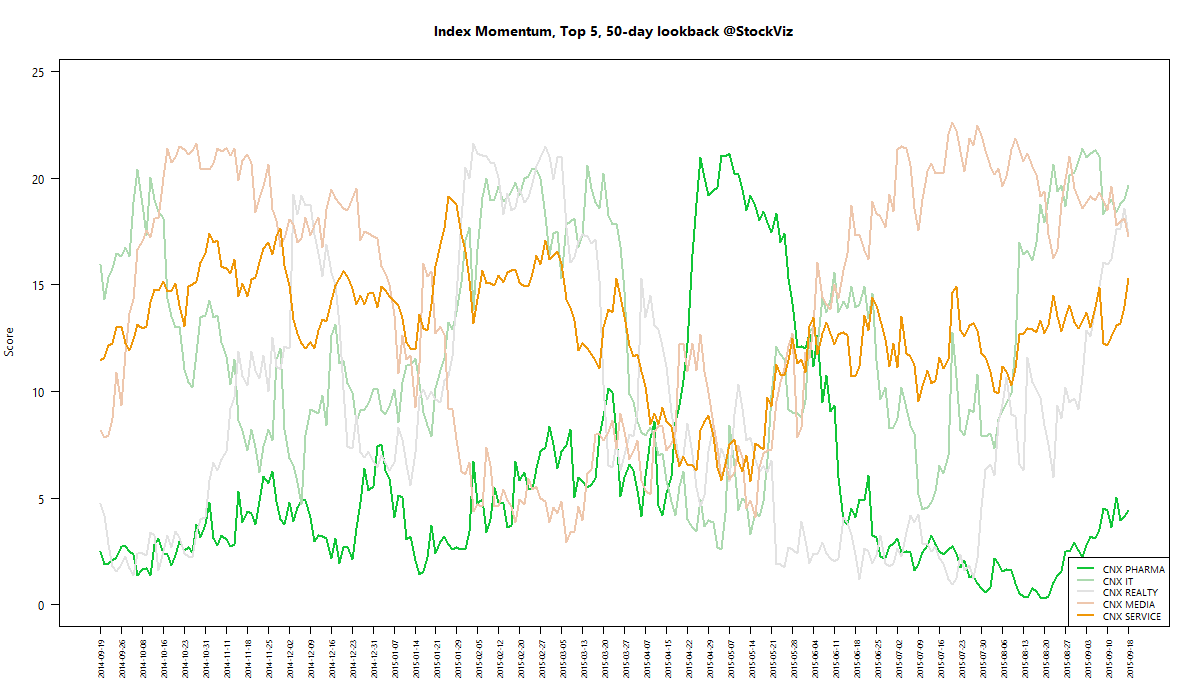
Momentum caught a break as midcaps rallied…
Equity Mutual Funds
Bond Mutual Funds
Thought for the weekend
The golden age of the Western corporation was the product of two benign developments: the globalisation of markets and, as a result, the reduction of costs. Now a more difficult era is beginning. More than twice as many multinationals are operating today as in 1990, making for more competition. Margins are being squeezed and the volatility of profits is growing. Many companies in labour- and capital-intensive industries have been slaughtered by foreign competitors. What next?
Source: Death and transfiguration