Tag: theme

Long-Short Trend Following

Prior Work

We had discussed the SMA On/Off Switch and its ability to escape the worst days. Based on this finding, we setup a Tactical Theme that would go long NIFTYBEES and JUNIORBEES if the CNX 100 index is trading above its 50-day SMA and move into LIQUIDBEES otherwise.

What if, we could go long and short?

Naive Long-Short

Here’s how going long above 50-DMA and short below 50-DMA on the CNX 100 since 2001 compares:
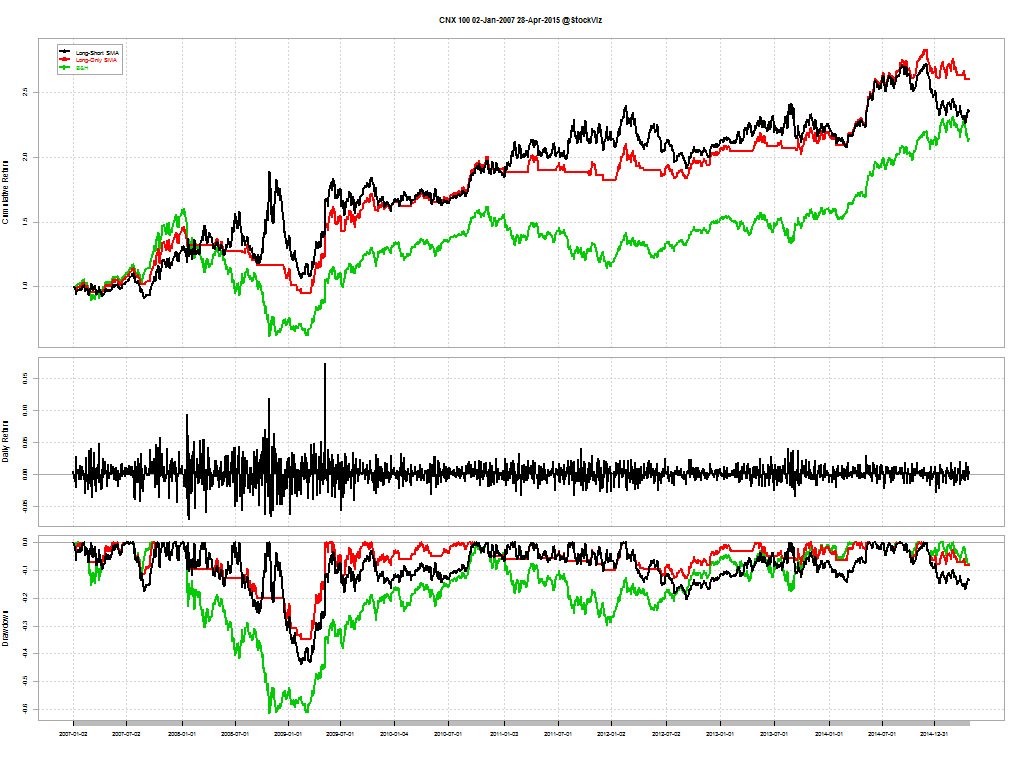
CNX 100.02-Jan-2007.28-Apr-2015.long.short
Long-Short SMA (black), Long-Only SMA (red) and Buy & Hold (green)

It looks like going both long and short is not significantly better than a long-only tactical strategy.

Long-Short with Volatility

But what if, we add a volatility metric into the mix? The logic here is that corrections are preceded by a bout of volatility. So if you go short if either or the volatility signal or the 50-DMA indicates a negative bias and long otherwise:
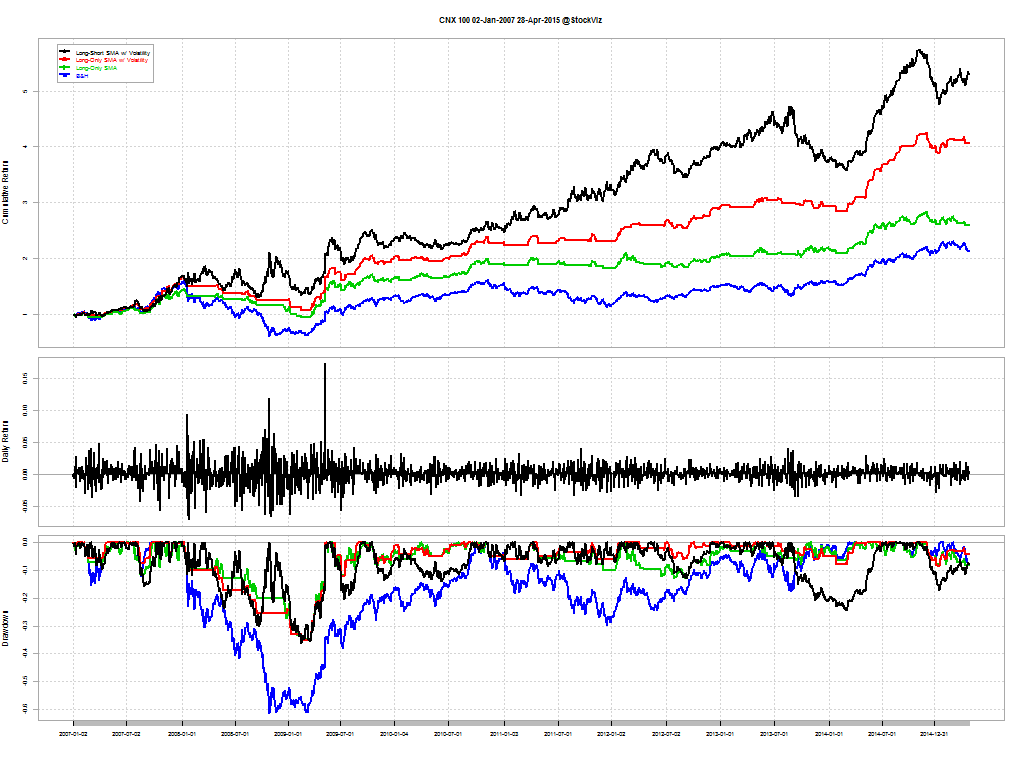
CNX 100.02-Jan-2007.28-Apr-2015.long.short.volatility
Long-Short SMA w/ Volatility (black), Long-Only SMA w/ Volatility (red), Long-Only SMA (green) and Buy & Hold (blue)

It looks like there is significant alpha in the combination approach.

Long-Short NIFTY and BANKNIFTY

NIFTY returns since 2001:
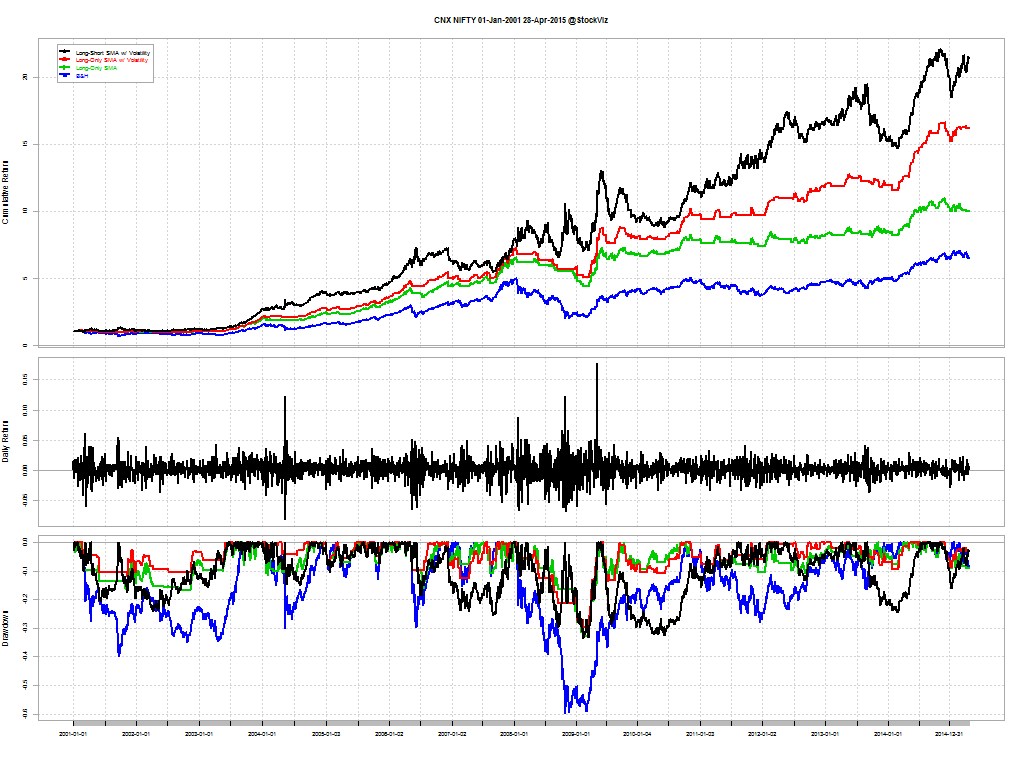
CNX NIFTY.01-Jan-2001.28-Apr-2015.long.short.volatility

And the same for the BANK NIFTY since 2006:
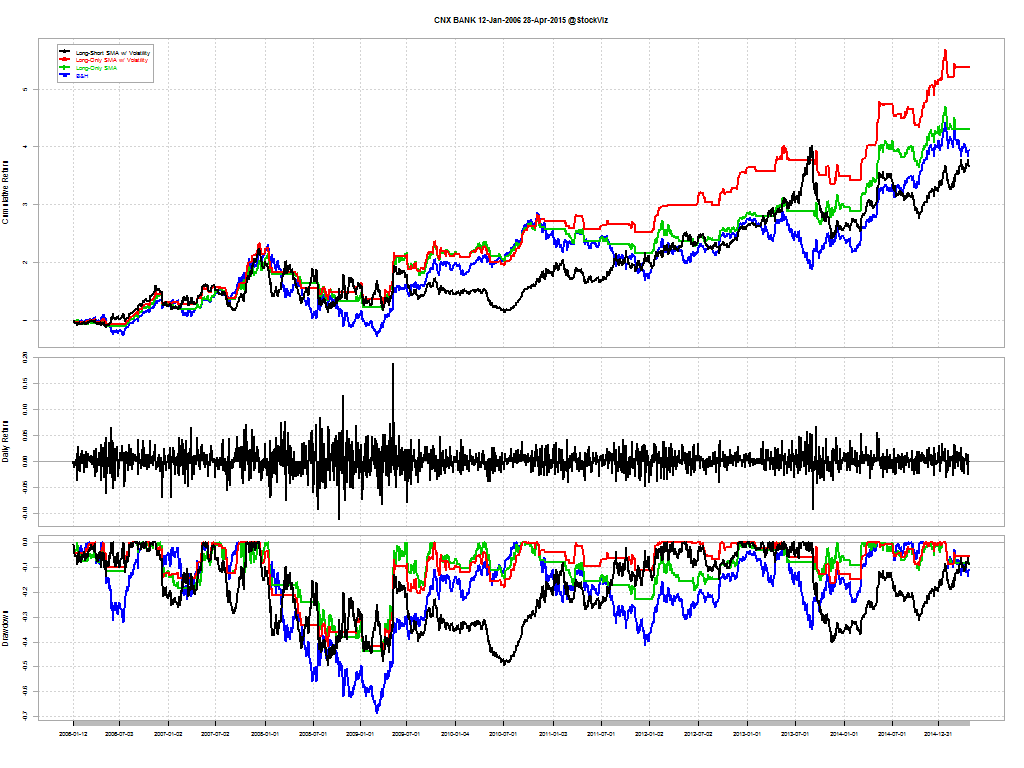
CNX BANK.12-Jan-2006.28-Apr-2015.long.short.volatility

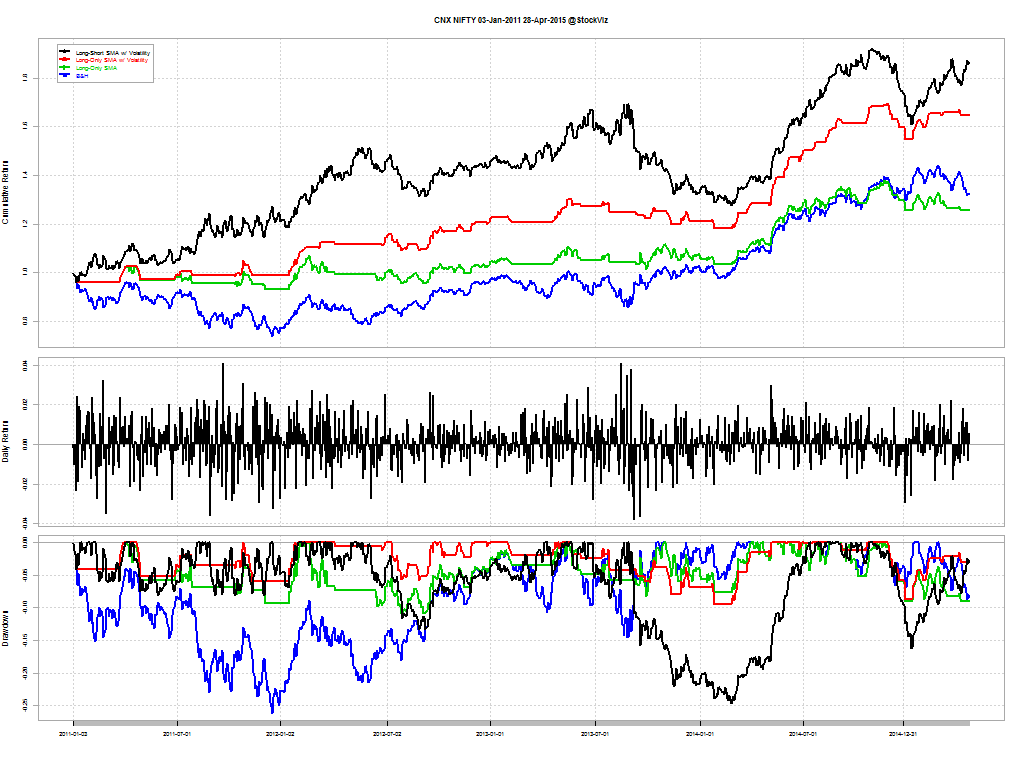
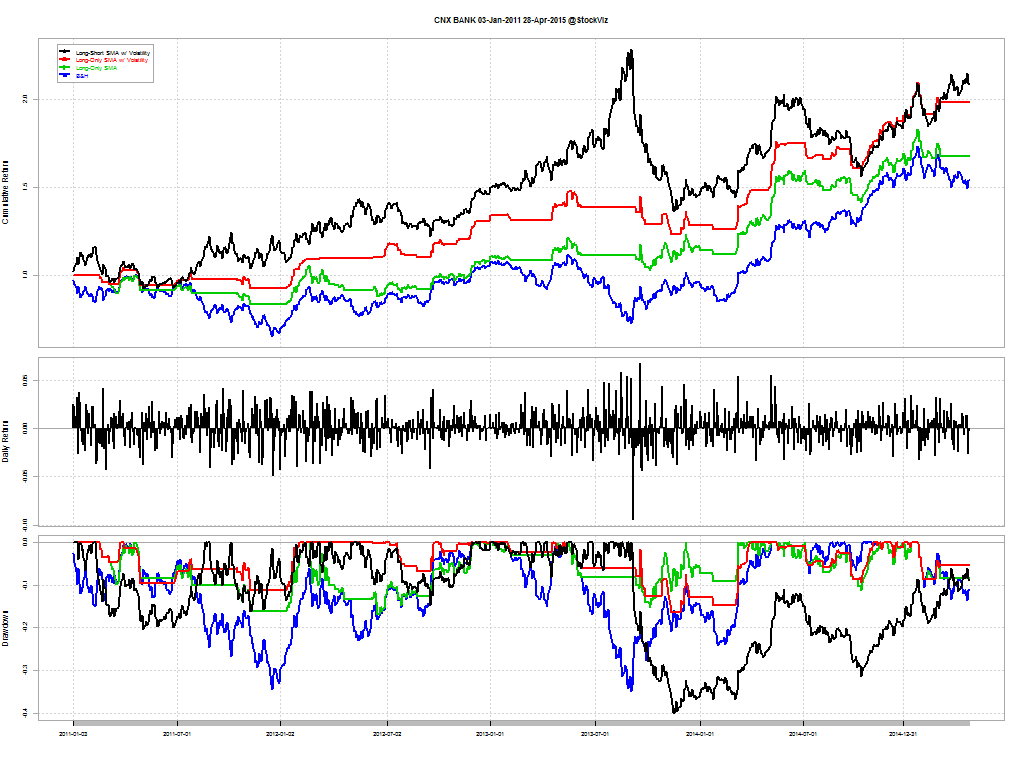
NIFTY and BANKNIFTY since 2011:

CNX NIFTY.03-Jan-2011.28-Apr-2015.long.short.volatility

CNX BANK.03-Jan-2011.28-Apr-2015.long.short.volatility

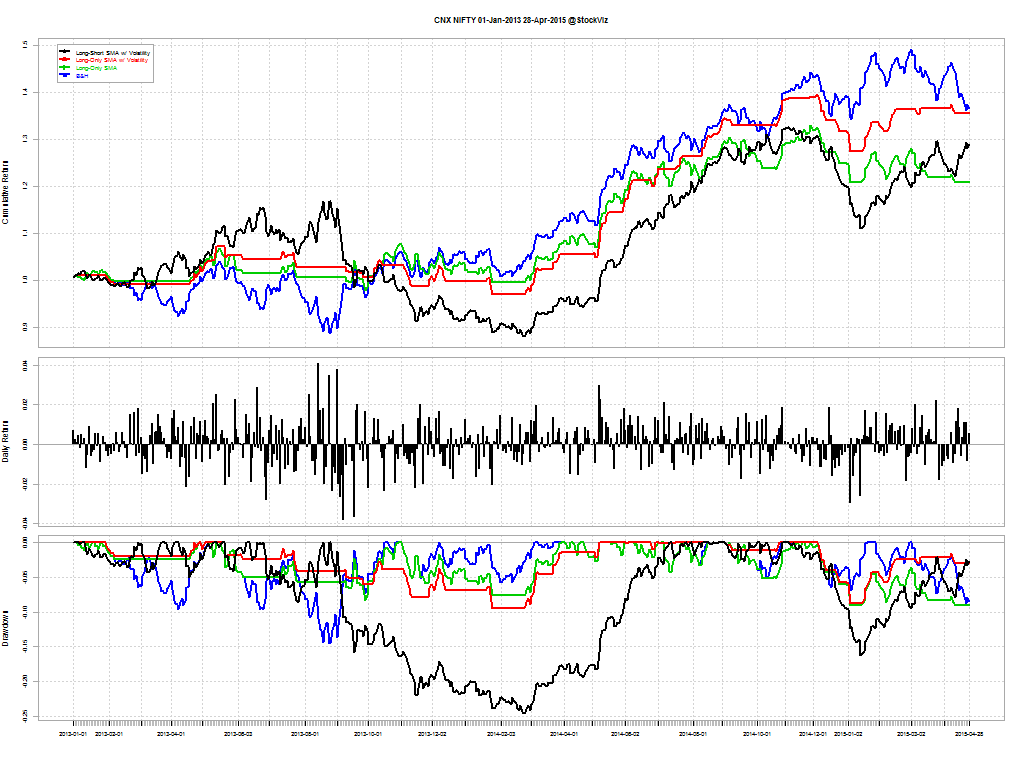
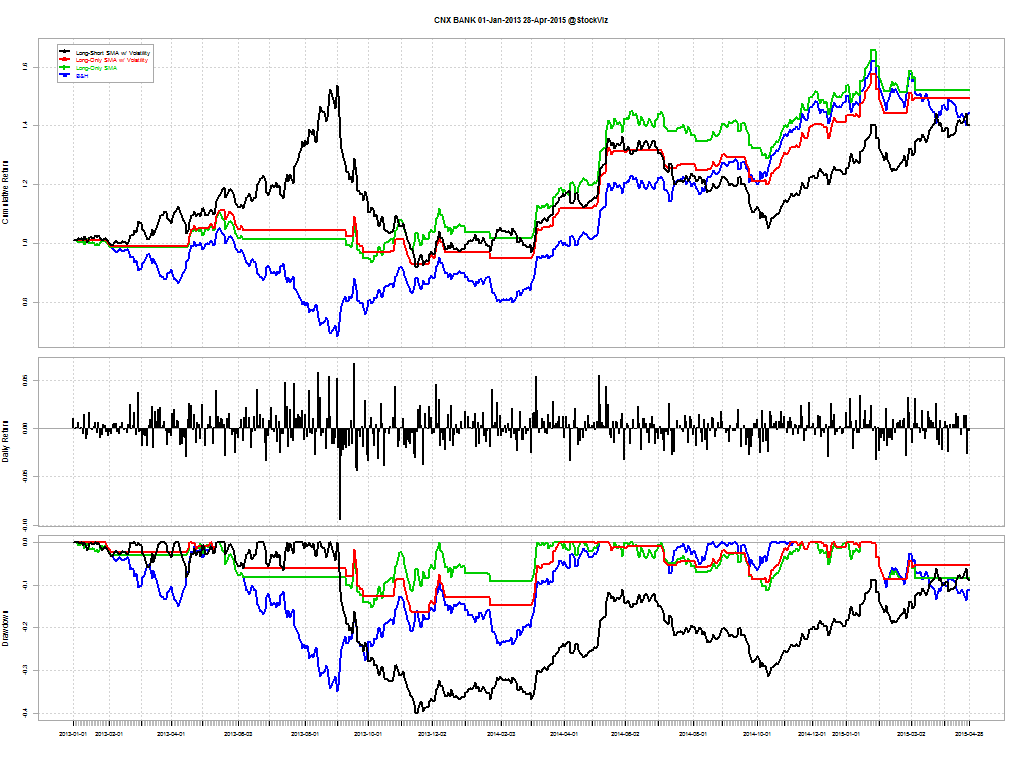
NIFTY and BANKNIFTY since 2013:

CNX NIFTY.01-Jan-2013.28-Apr-2015.long.short.volatility

CNX BANK.01-Jan-2013.28-Apr-2015.long.short.volatility
Long-Short Combo (black), Long-Only Combo (red), Long-Only Tactical (green) and Buy & Hold (blue)

Conclusion

It appears that there is long-term alpha in using a combination of volatility and 50-DMA to implement a long-short strategy. To put this to test using real-time data, we have created a theme to make it easy for you to follow along: Trend Long-Short.
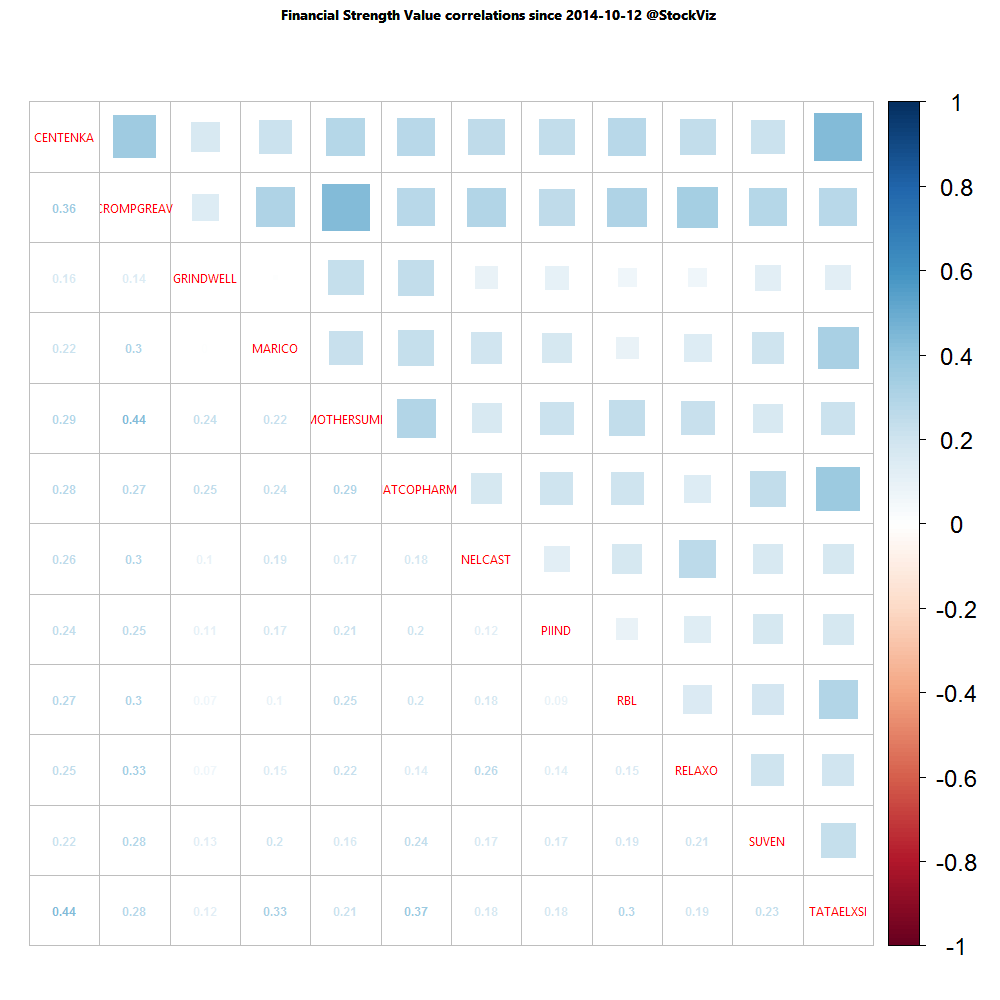
Correlation between Theme components

If you concentrate your portfolio, your mistakes will kill you;
If you diversify, the payoff from your successes will be diminished.
-Howard Marks

Investors can now look at the correlation (over one-year and one-month horizons) between stocks that make up an investment ‘Theme’ strategy. For example, here’s how the one-year correlation of the Financial Strength Value Theme looks like:

one year correlation

A lot of thick blue squares mean that positive correlations are high. Red squares mean negative correlations are high. Whites are the doldrums.

Happy Sankranti and Pongal!

Strategies that rocked in 2014

WHAT IS A “THEME”?

A StockViz Investment Theme is a portfolio of stocks that follows a particular strategy. It is a convenient way for you to:

  1. stick to a strategy
  2. follow a preset rebalancing schedule
  3. think in terms of your portfolio strategy rather than individual stocks
  4. avoid common behavioral pitfalls
  5. systematically track your P&L and strategy performance

WHAT IS AN INVESTMENT STRATEGY?

An investment strategy is a specific way of going about the process of investing. It identifies specific variables that define a stock. Variables can be anything: risk, style, sector, balance-sheet items, etc..

By mapping specific Themes to your account, you ensure that you stay pure to your strategy allocation. And that there is no “flying by the seat of your pants” investing.

HOW HAVE YOUR THEMES PERFORMED?

We started 2014 with eight investment strategies. Here is how they performed:

It was one of those rare years when both momentum and value performed at the same time. The Modi-rally coincided nicely with the bottoming of the cycle.

Passive buy-and-hold

Implementing a strategy involves churn. For die-hard fans of the passive buy-and-hold clan, here’s how 2014 looked like:

PSUBNKBEES +71.37%
BANKBEES +64.94%
JUNIORBEES +43.70%
NIFTYBEES +31.57%
INFRABEES +25.83%
GOLDBEES -9.32%
Gold was a money loser and public-sector banks, in spite of all the bad loans and scams, out-performed the rest of the market by a mile.

WHAT SHOULD I DO NEXT?

You should open a demat account with StockViz and invest through our Themes.

Choices: Large-cap Investing

While looking at investing in large-cap stocks, investors have quite a few options available to them.

Mutual Funds

Previously, we discussed ‘Top 100’ funds — funds that invest in the largest market-cap stocks. This is one way to go about adding large-cap exposure to your portfolio. However, the expense ratios of more than 2% will eat into your returns. Remember, returns are not predictable, but fees are forever.

Passive ETFs

You can buy an equal proportion of the NIFTYBEES and the JUNIORBEES ETFs. Since these are exchange traded, you don’t have to go through the hassle of “surrendering” your mutual fund “units” and keeping track of exit-loads etc. Besides, NIFTYBEES’ expense ratio is 0.5% and JUNIORBEES’ 1%. Overall, you pay 0.75% to Goldman Sachs to manage the ETFs.

Not a bad deal, considering that you end up tracking the CNX 100 index which represents the top 100 stocks by market cap.

Active ETFs

We have a Theme that takes a tactical route when it comes to tracking the CNX 100 index. Its called the CNX 100 50-Day Tactical Theme. The basic idea is to switch between (NIFTYBEES + JUNIORBEES) and LIQUIDBEES depending on whether the CNX 100 index is trading above or below its 50-day moving average. Details of the strategy can be found here.

The drawback is that in flat markets, you end up getting whipsawed a lot. But if you have the discipline to stick with it for over 5-years, it has the ability to deliver superior risk-adjusted returns.

Conclusion

Each of the approaches described above have their advantages and disadvantages. With mutual funds, you have a brand-name manager who is working for you. With the passive route, you save on fees. The tactical route will probably lessen drawdowns during a market crash and preserve capital.

What you end up investing in finally boils down to whatever sails your boat.

Re-factored Indices and Momentum

We have created a whole bunch of Themes based on indices published by the NSE. We call them Re-factored Indices because they use a weighting that is different from NSE’s. We currently have free-float cap weighted and equal weighted themes. Investors can now invest in standard indices directly, without having to go through an index fund.

These Themes are automatically re-balanced once a month. There is no discretion on what goes into them, the portfolio is decided by the NSE/IISL. Investors can use these to “set it and forget it.”

Long-term out performance

Some indices show persistent long-term out-performance. For example, MNCs have beaten PSEs (StockViz) and have shown to have lower draw-downs. Investors can map the MNC Theme and let NSE/IISL figure out what stocks should be part of that index.

Momentum

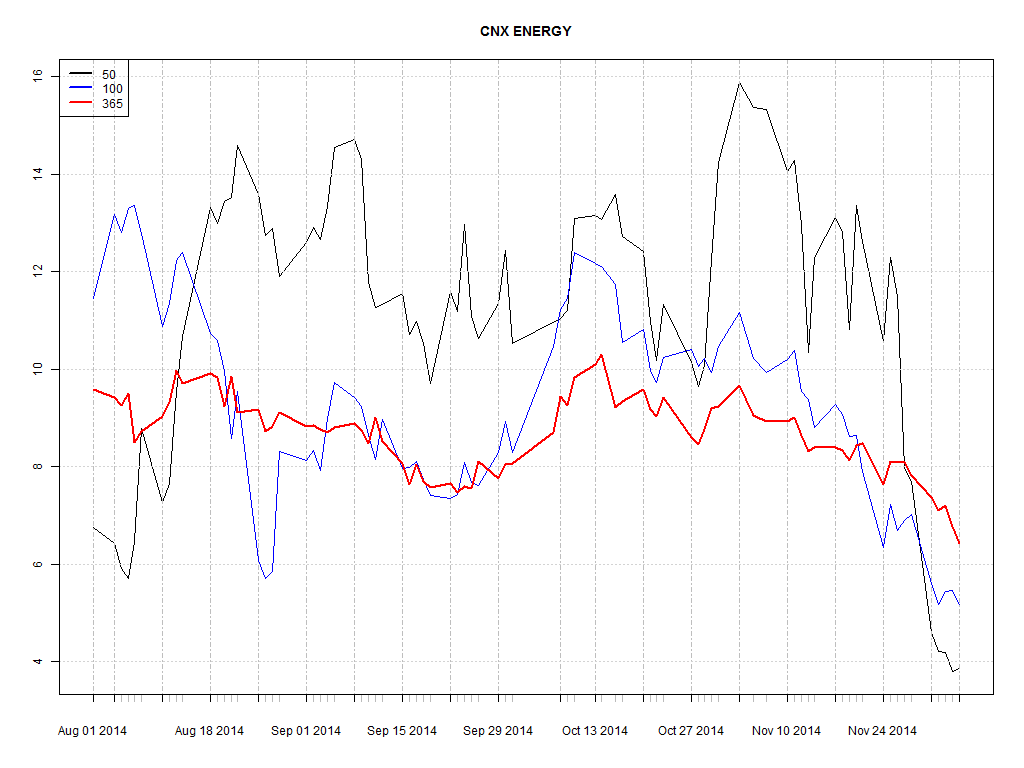
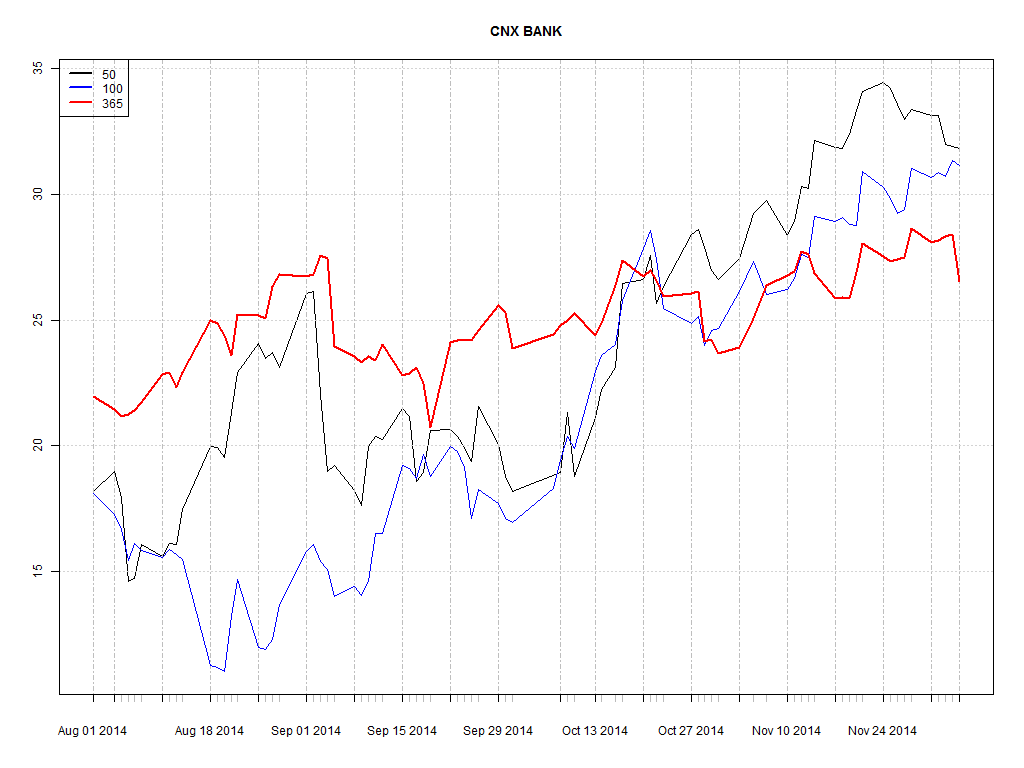
Short-term investors can use momentum effects to their advantage and implement a switching strategy. For example, CNX BANK shows greater momentum than CNX ENERGY:

CNX BANK

CNX ENERGY

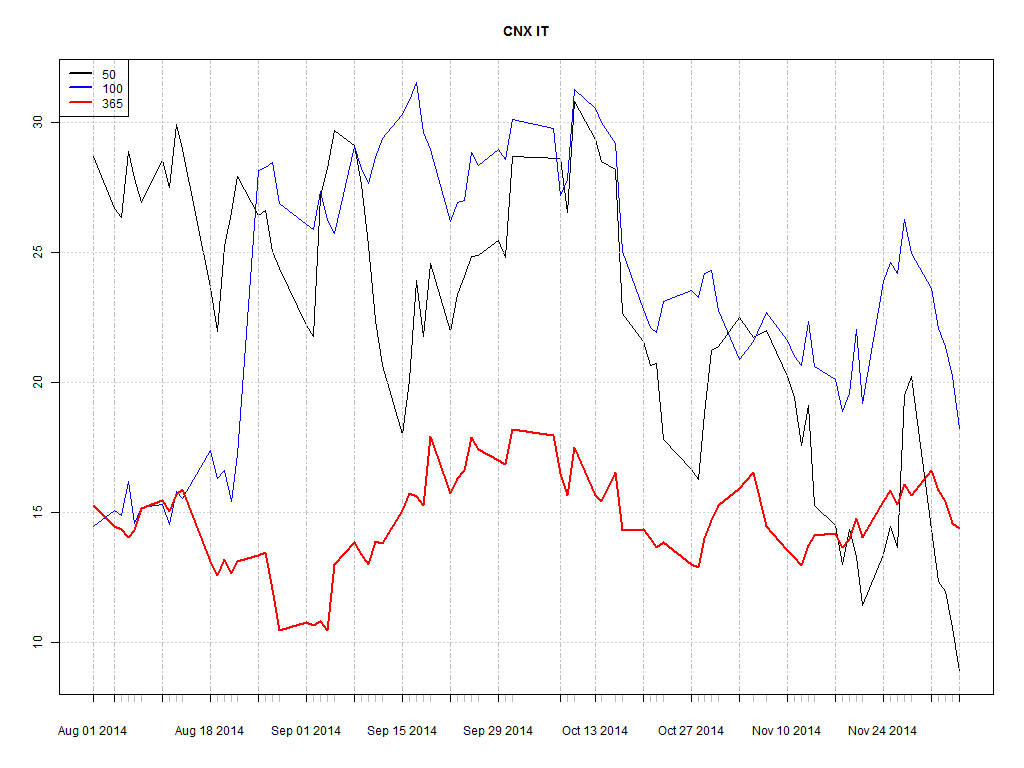
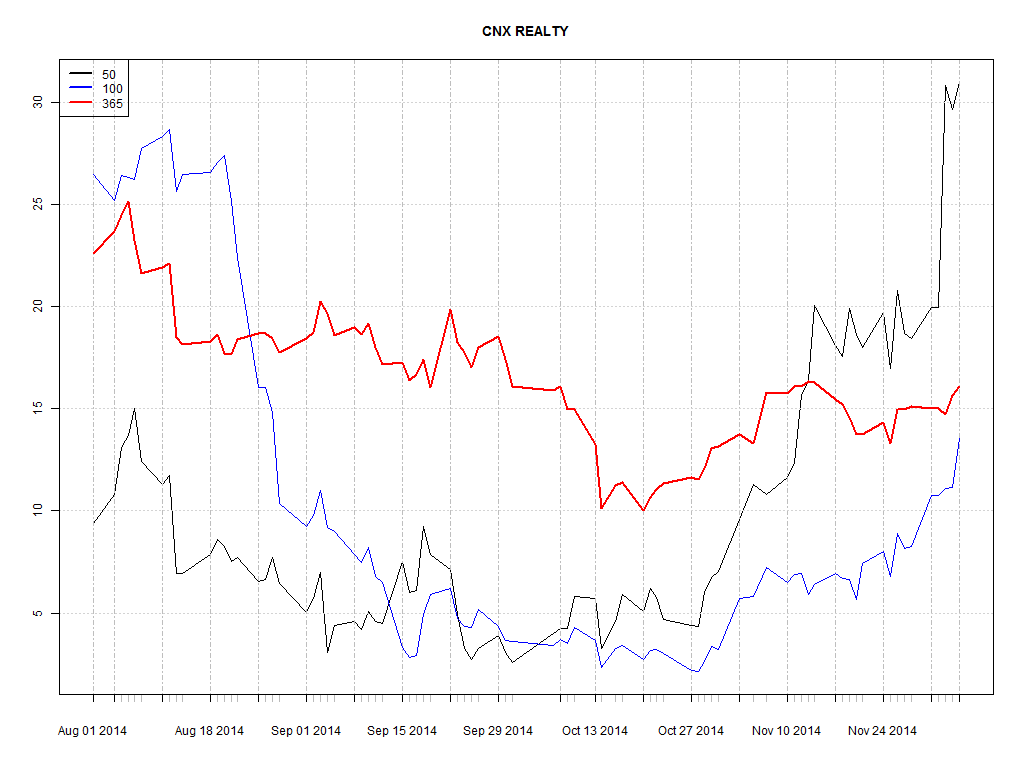
And over the last week, momentum in CNX REALTY has improved drastically whereas CNX IT has decreased:

CNX IT

CNX REALTY

Conclusion

Re-factored Indices can act as ETF-proxies for long-term, passive investors and opens up interesting momentum strategies for short-term investors.