
This is a review of the fourth chapter of John J. Murphy’s Technical Analysis of the Financial Markets.
What is a trend?
A trend is simply the direction of the market. Markets don’t move in straight lines, they zigzags through different levels forming peaks and troughs. The direction of these peaks and troughs constitutes a market trend.
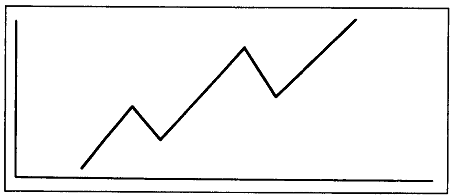 An uptrend is a series of successively higher peaks and troughs.
A downtrend is a series of successively lower peaks and troughs.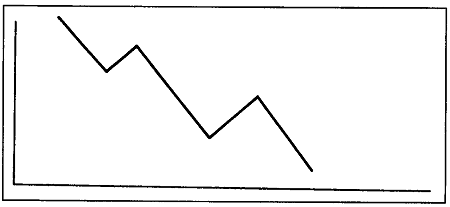
A trendless/horizontal trend is a series of horizontal peaks and troughs.
Based on the trend, the trader could go long an uptrend, go short a downtrend and most importantly, do nothing in a trendless market.
Support and Resistance
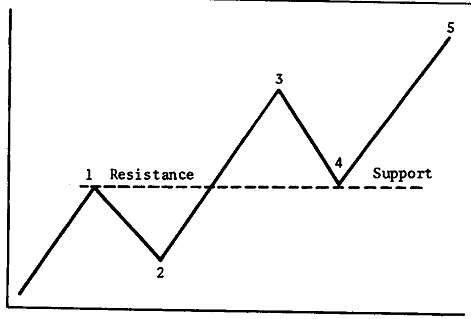
The troughs are called supports. It is a level under the  market where buying interest is sufficiently strong to overcome selling pressure. It is in this area that the decline is halted and and prices turn back up.
Resistance is the opposite of support; it is a level over the market where selling pressure overcomes buying pressure and prices decline.
In an uptrend, resistance levels represent pauses in price appreciation and are usually penetrated at some point. In a downtrend, support levels check the decline temporarily. For an uptrend to continue, each successive low (support) must be higher than the last one. Each rally high (resistance) should be higher than the previous one. If the corrective dip in an uptrend comes all the way down to the previous low (support), then a trend reversal might be in the offing.
 The longer the time (and higher the volume) that prices trade in a support or resistance area, the more significant the area becomes.
Whenever the support or resistance level is penetrated by a significant amount (3%), they reverse their roles and become opposites.
Up Next: Trendlines!
