Market timing is a very divisive topic in investing. For traders, it has been the search for the holy grail. For passive investors, a source of derision.
Far more money has been lost by investors preparing for corrections, or trying to anticipate corrections, than has been lost in corrections themselves. – Peter Lynch
Does it mean investors should just remain long all the time? Hardly, according to the latest research by Meb Faber (ssrn).
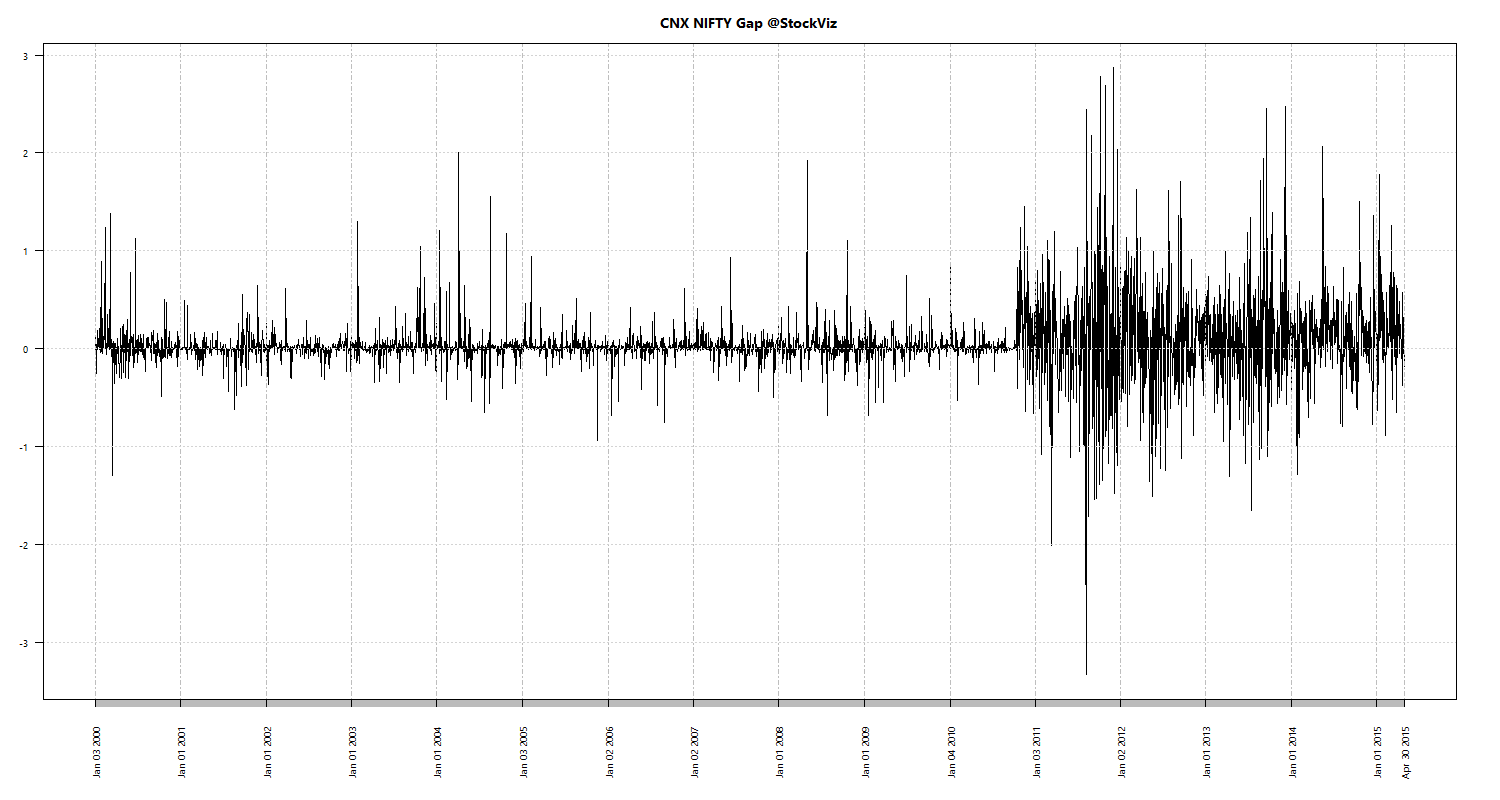
Data for international markets show that volatility increases in declining markets. Any strategy that keeps you out of those periods, will improve your portfolio returns. The outline of his strategy is simple: go long the market if it is trading more than its 200-day SMA and stay out of the market otherwise.
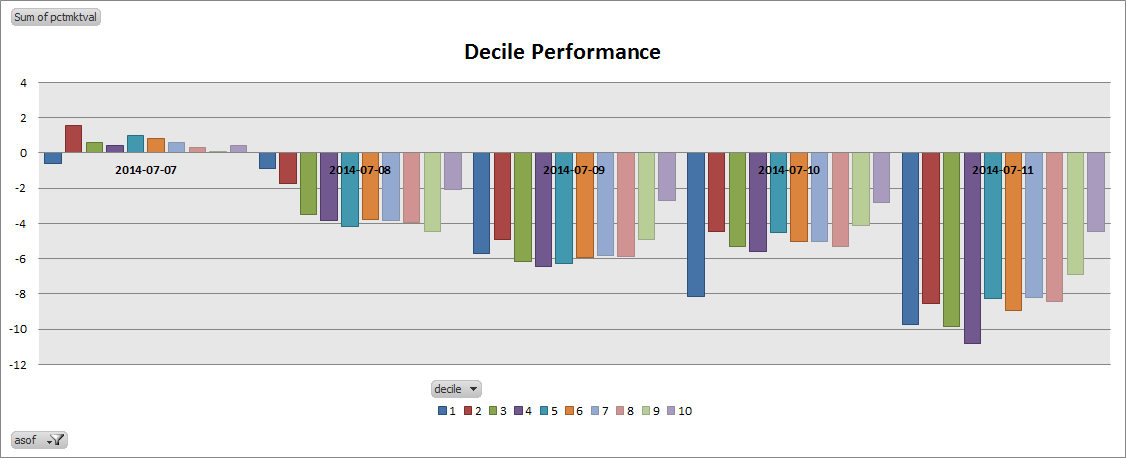
A small amount of outliers have a massive impact on performance and the best and worst outliers tend to cluster when the market is already declining. However, if you miss the best and worst days in every case your compound return is higher than buy and hold.
It works across most international markets:
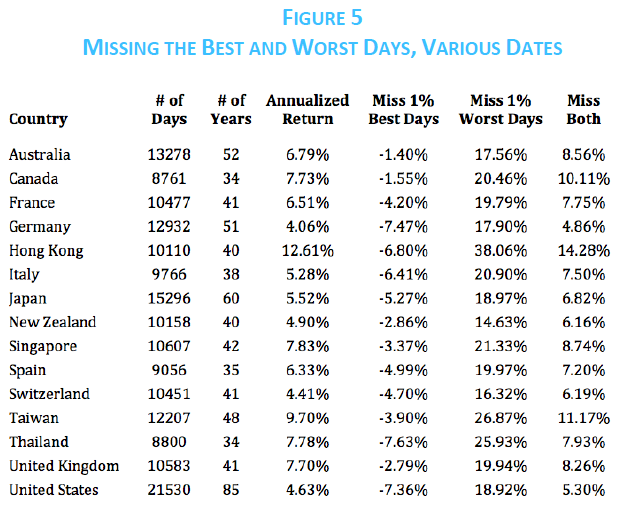
Unfortunately, the paper doesn’t discuss the Indian markets, so lets try and fix that.
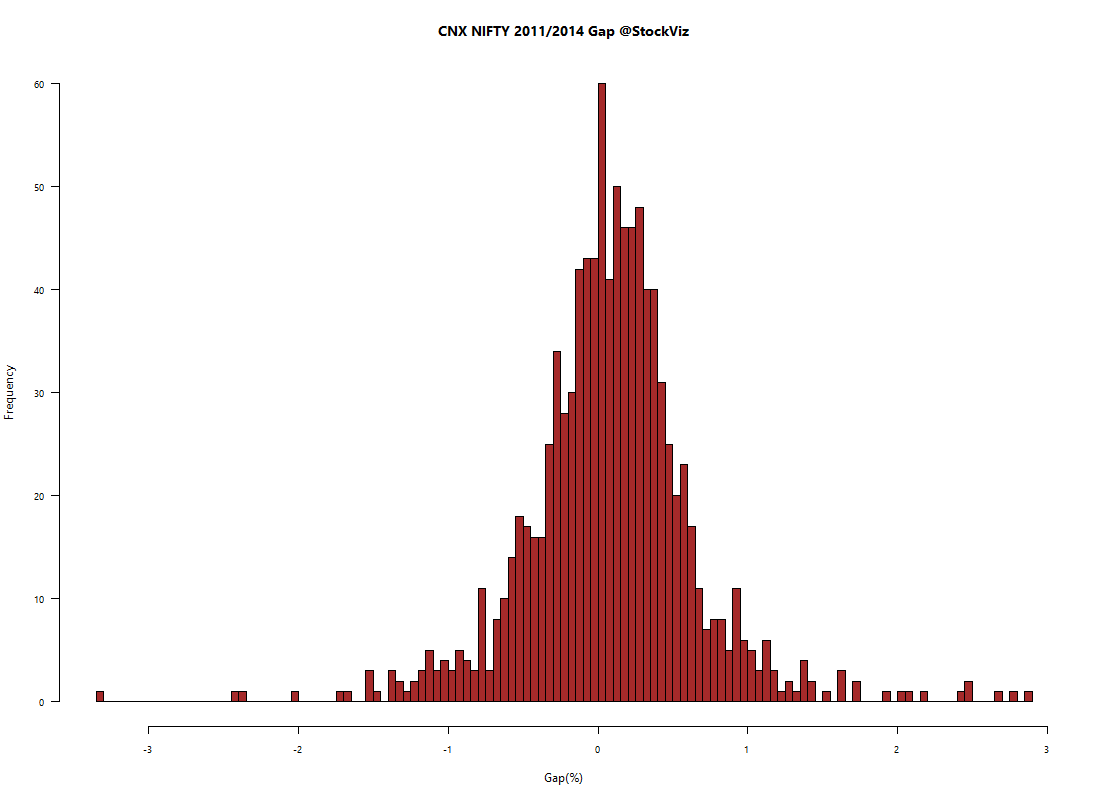
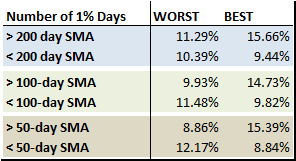
Best and worst days
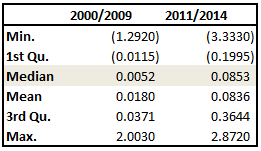
The table below shows that in a rising market, +1% days (BEST) outnumber -1% days (WORST) and the reverse is true of declining markets. Also, as you decrease the look-back period, the WORST to BEST ratio increases in a declining market.
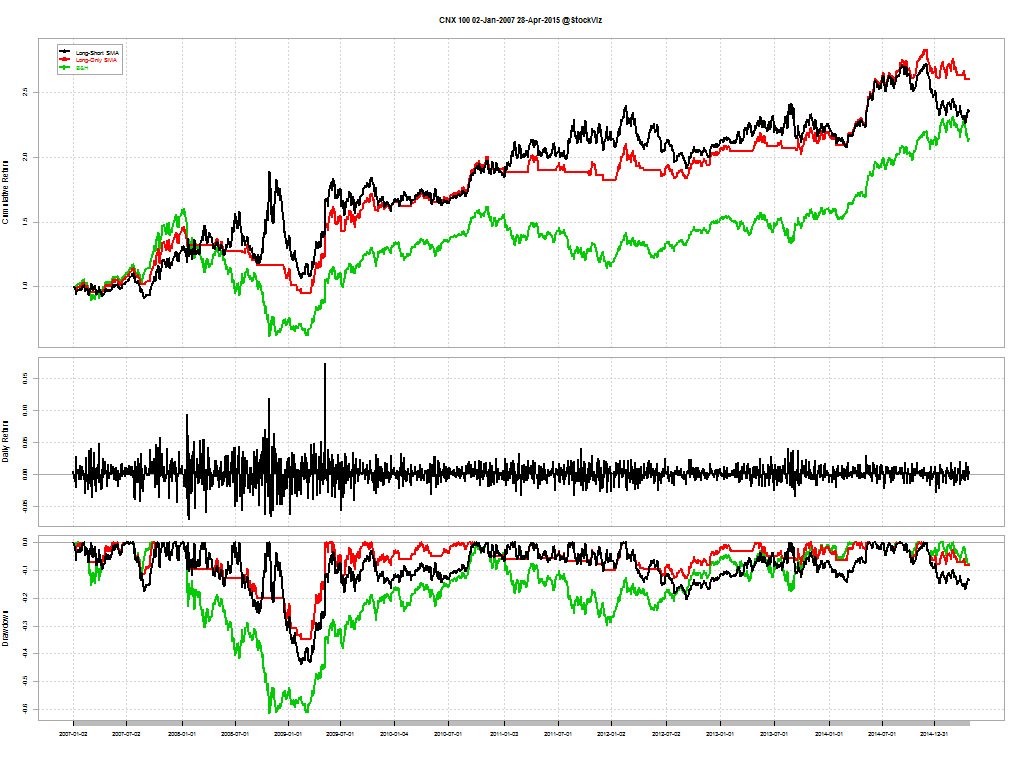
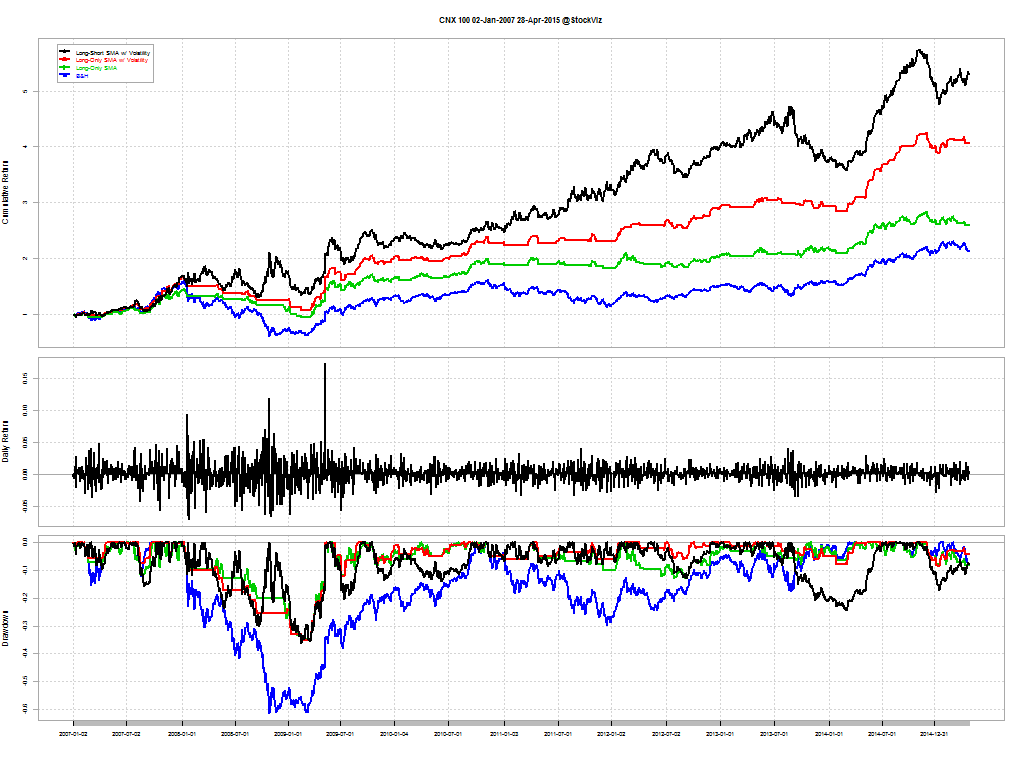
Cumulative Returns
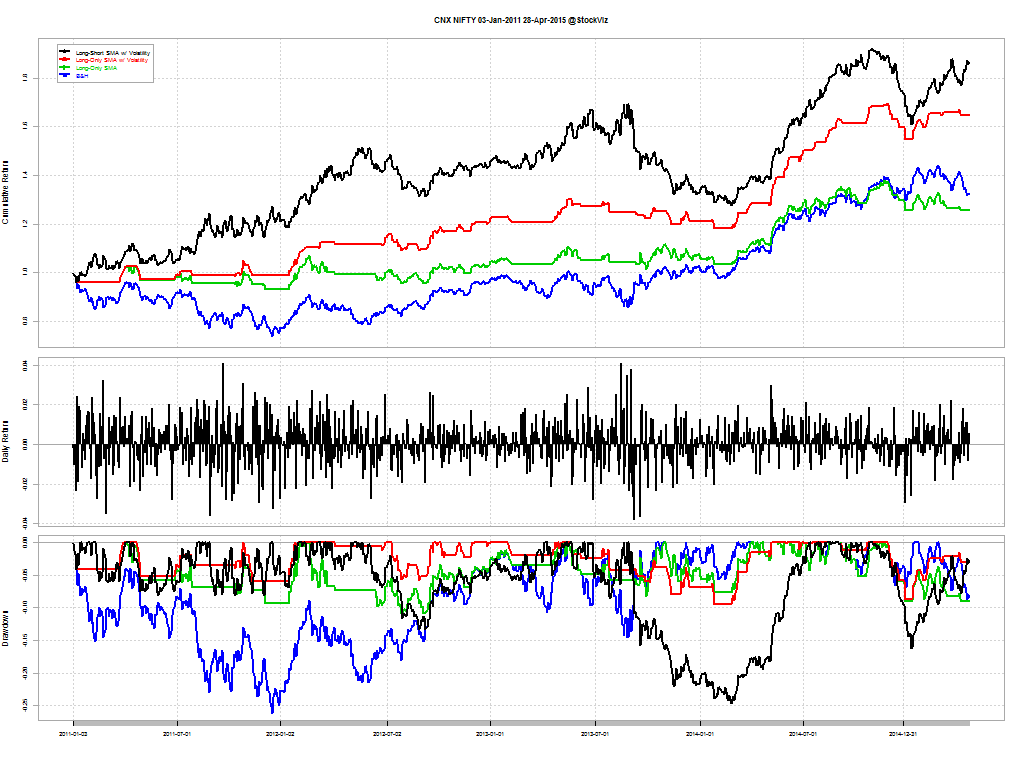
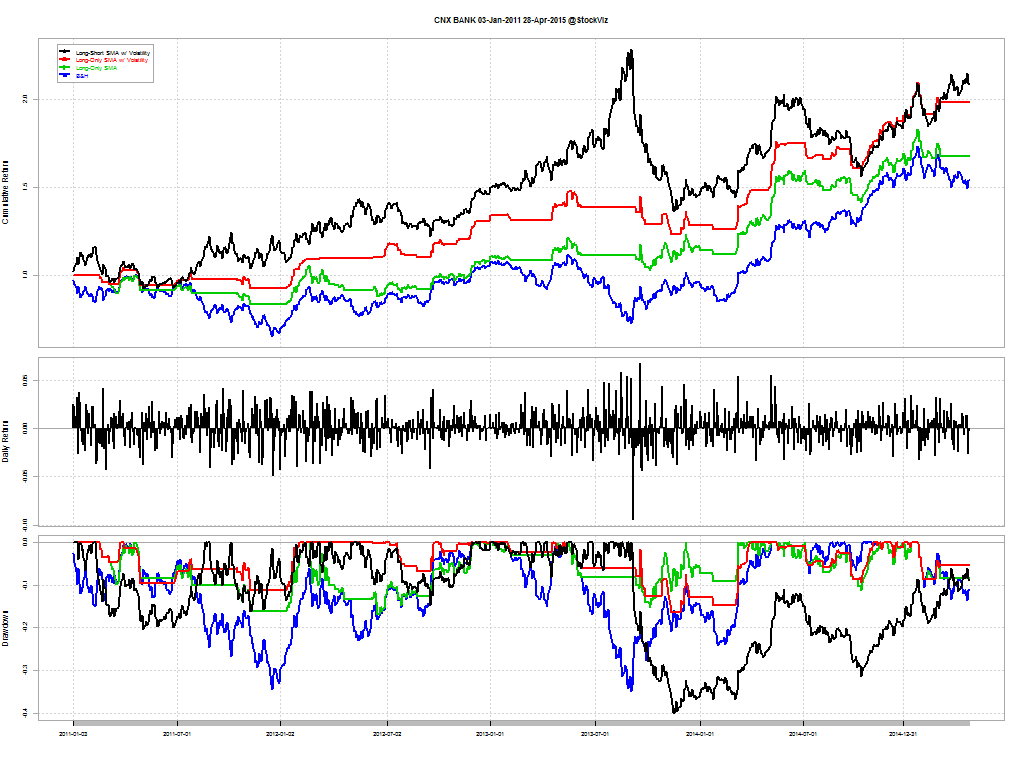
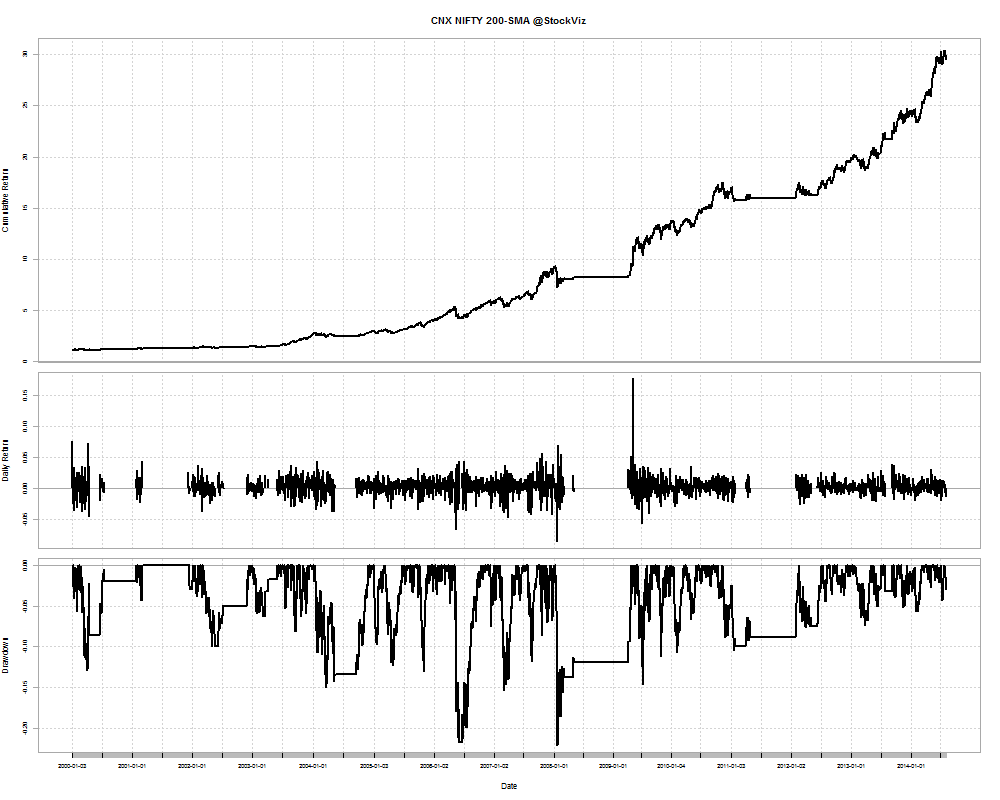
If you apply the SMA switch to the Nifty index, here’s how the cumulative returns look like:
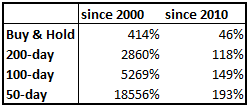
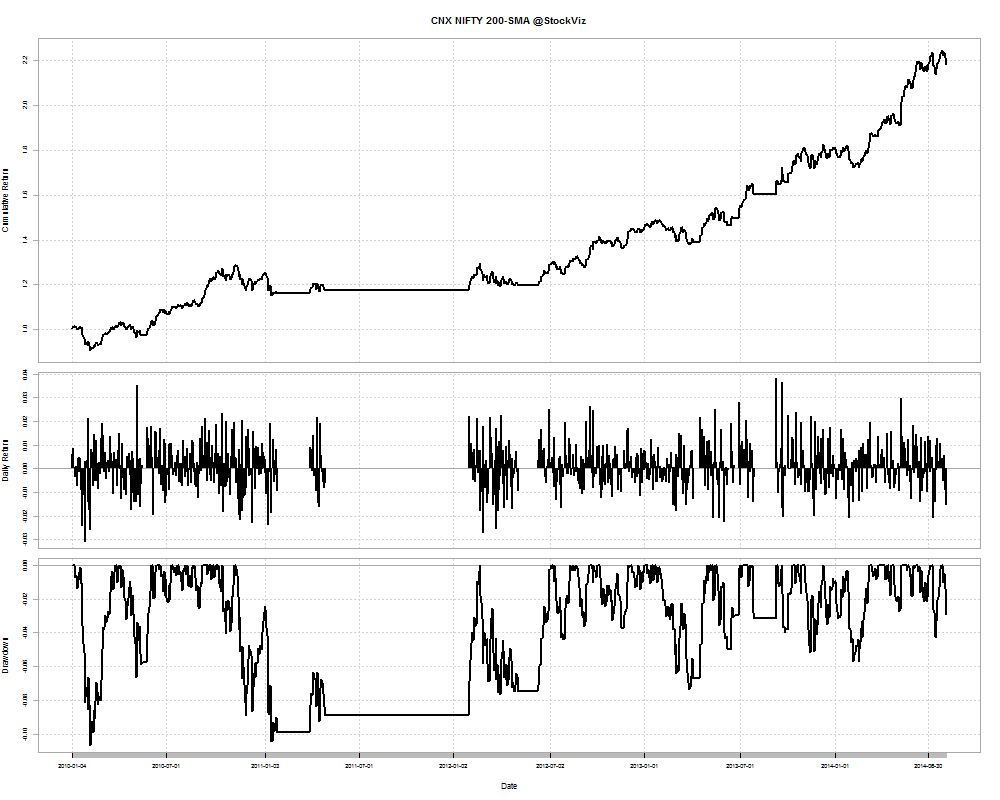
200-day SMA Cumulative Return Chart
Since: 2000
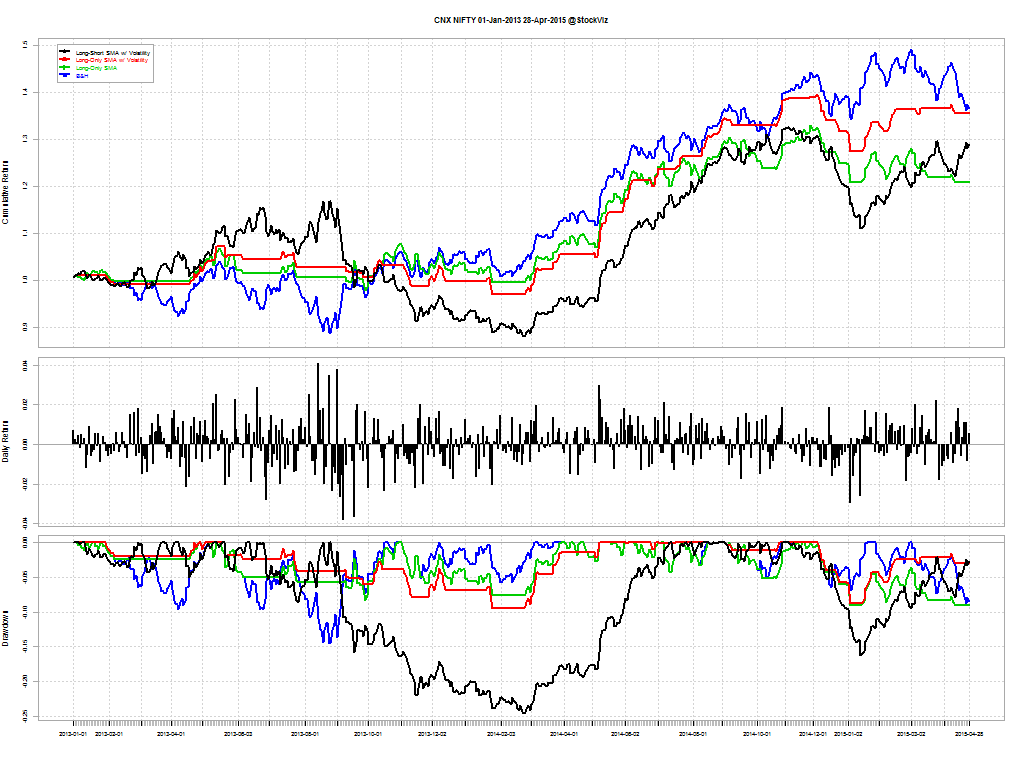
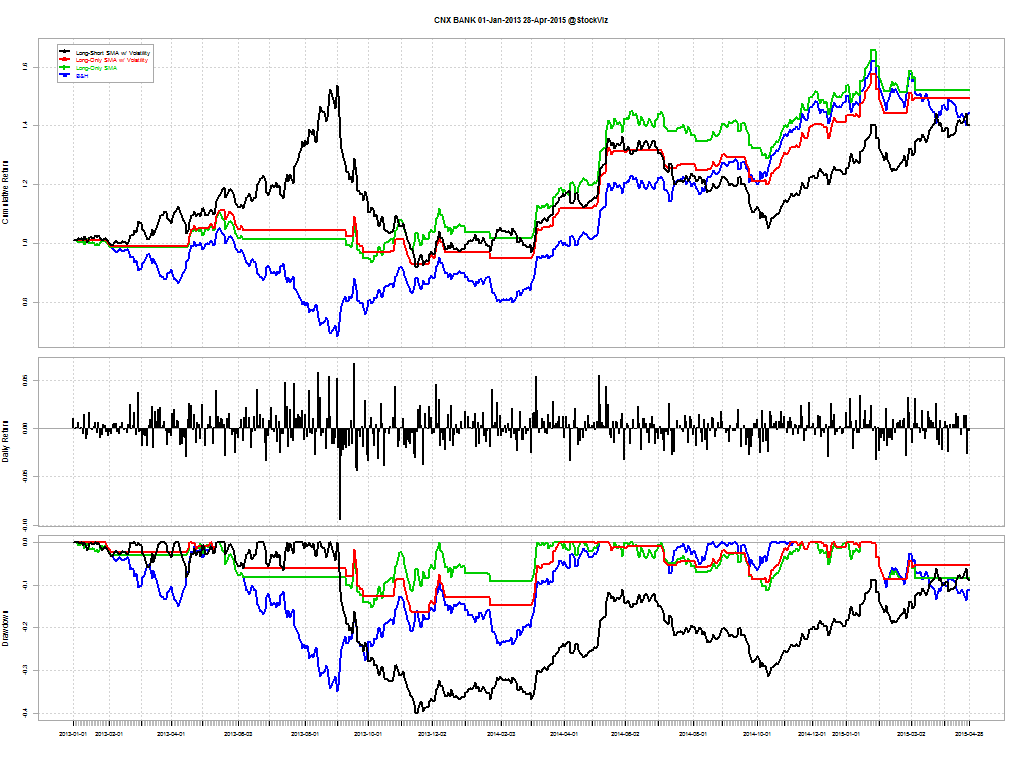
Since: 2010
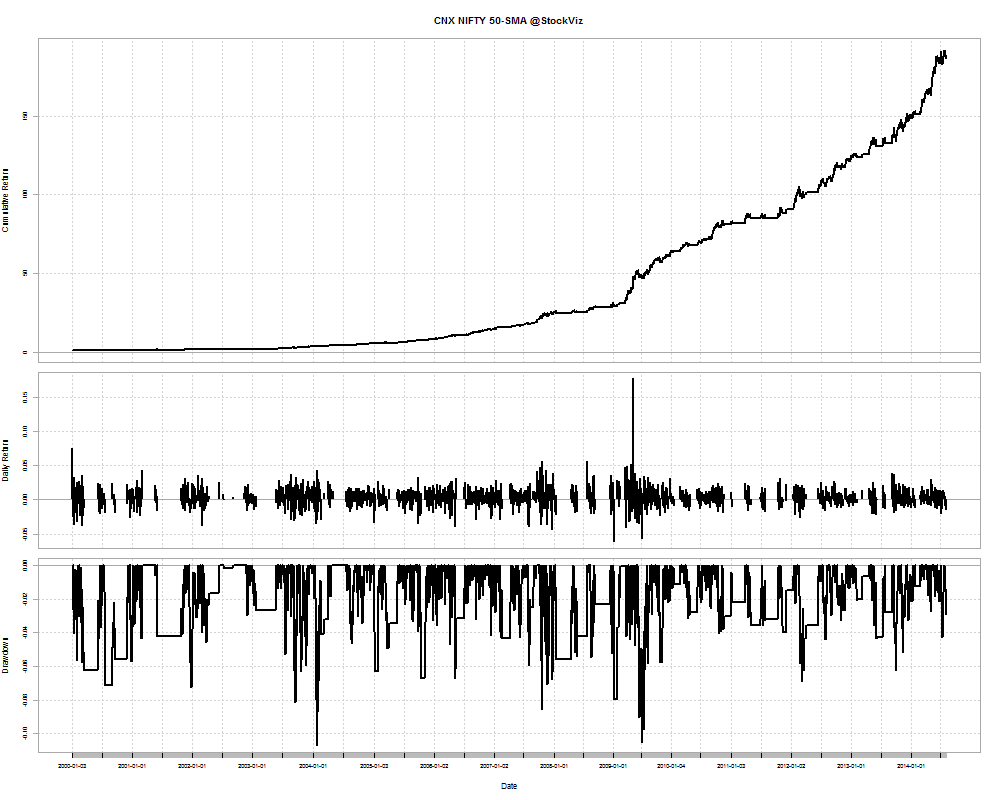
50-day SMA Cumulative Return Chart
Since: 2000
Since: 2010
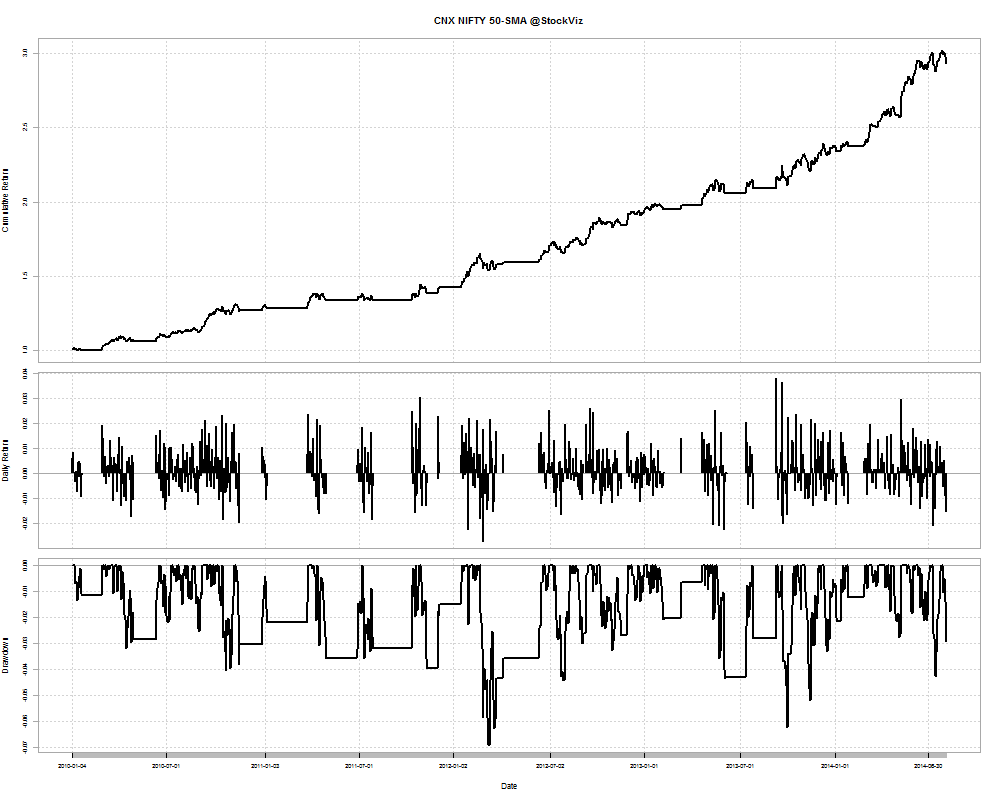
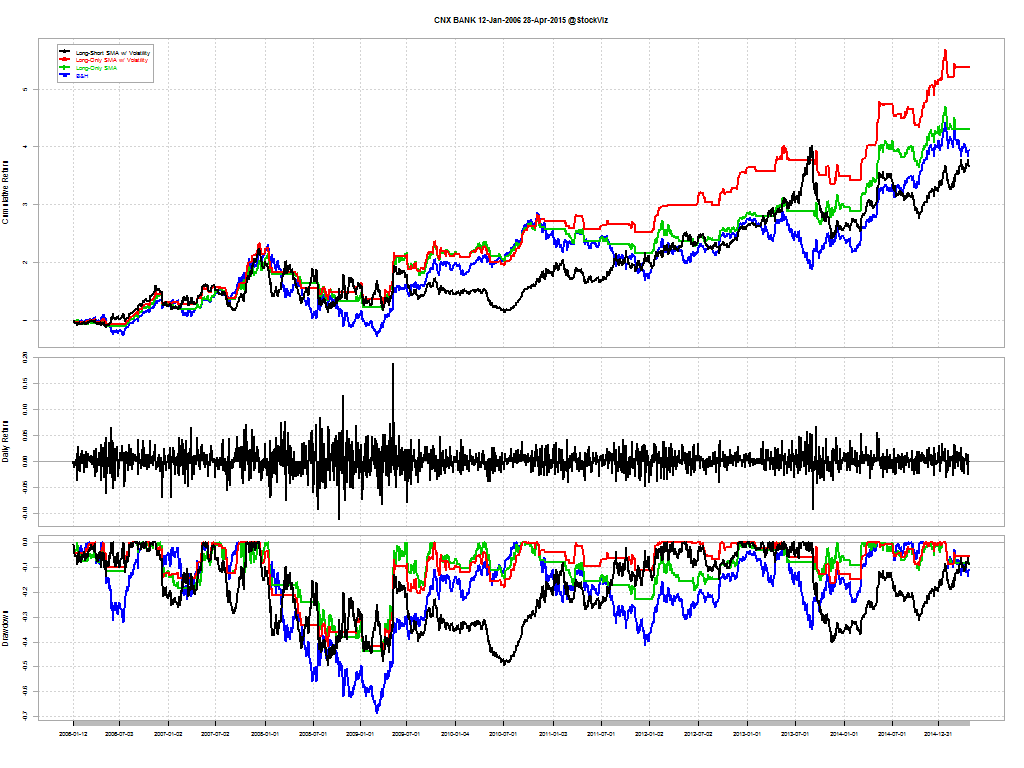
Drawdowns
If the SMA rule really helped investors stay out of negative fat tails, then it should manifest itself in the drawdowns.
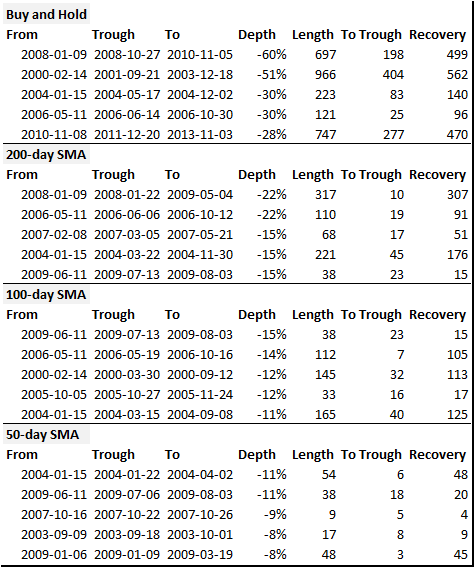
Conclusion
Using a simple SMA rule helps investors avoid drawdowns and boost returns as compared to a naive buy and hold strategy. The smaller the look-back period, the better the returns and lower the drawdowns.