Part I, Part II of the series.
111% vs. 11%
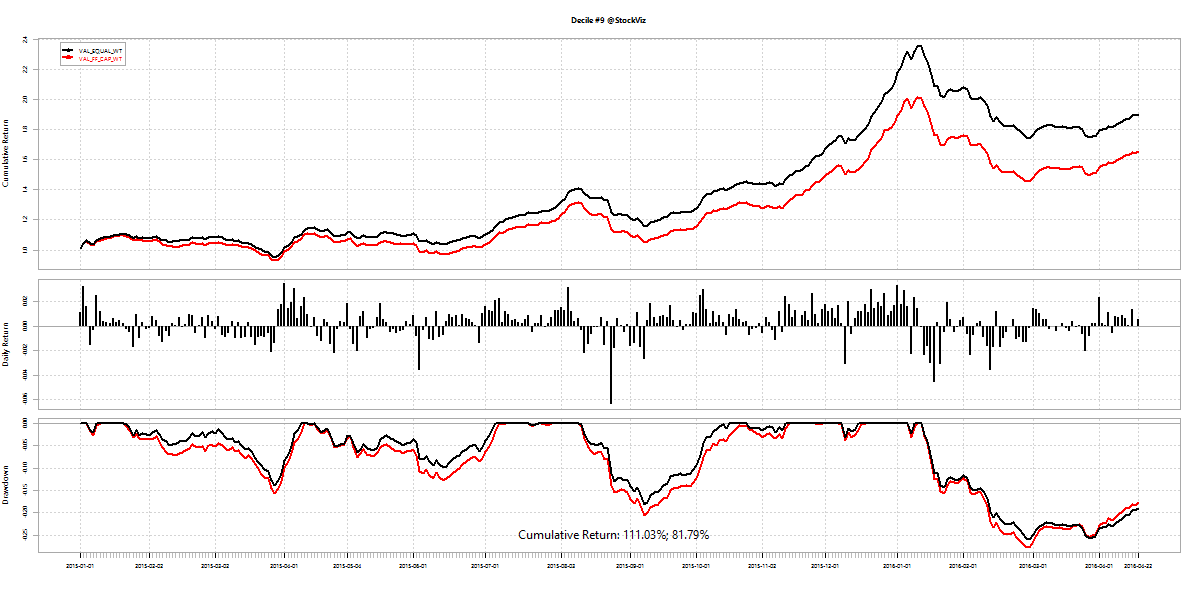
A portfolio of ~150, equal-weight, small-cap stocks, rebalanced monthly, gave a return of 111% from 2015 through now.
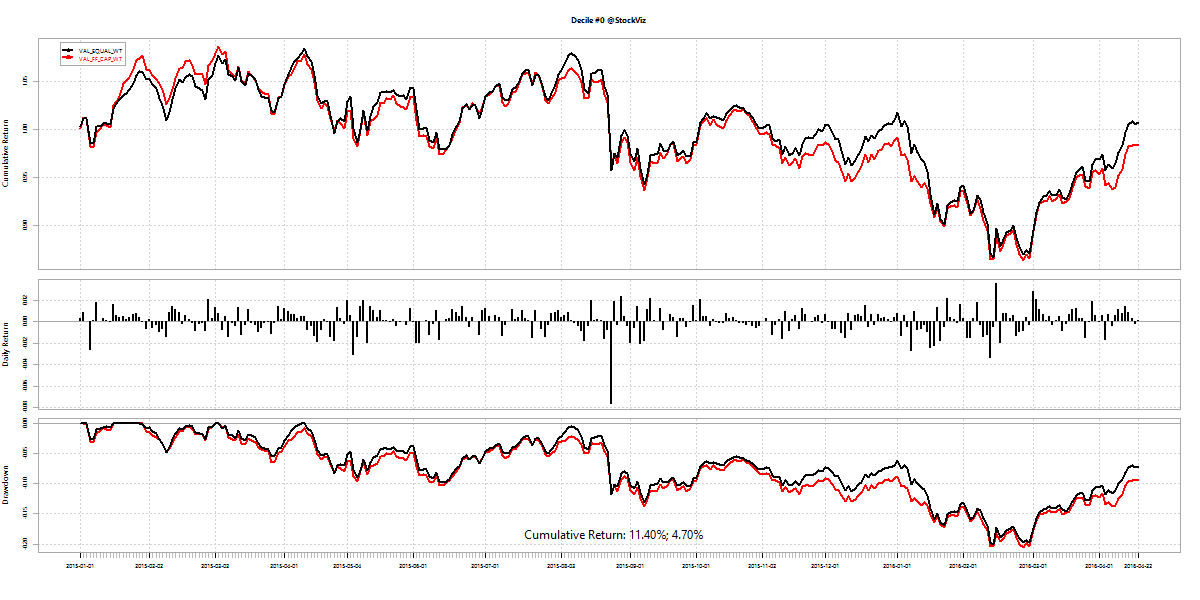
While a similar portfolio of mega-cap stocks gave a return of 11% during the same time frame.
Variance
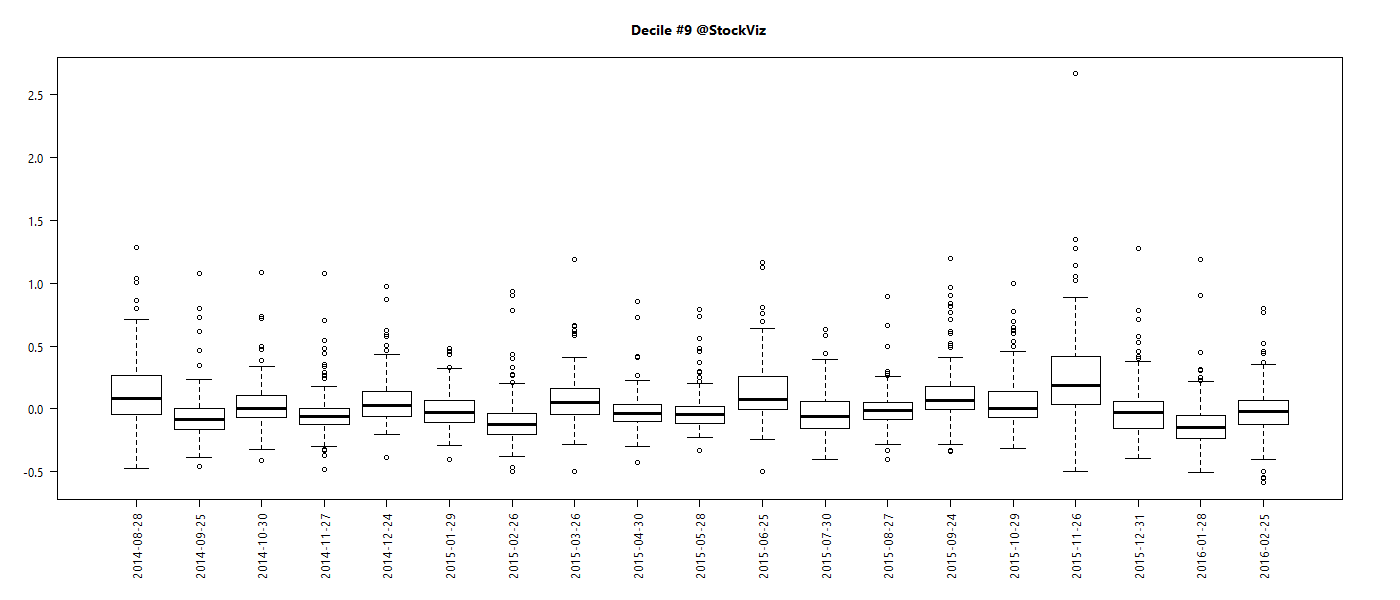
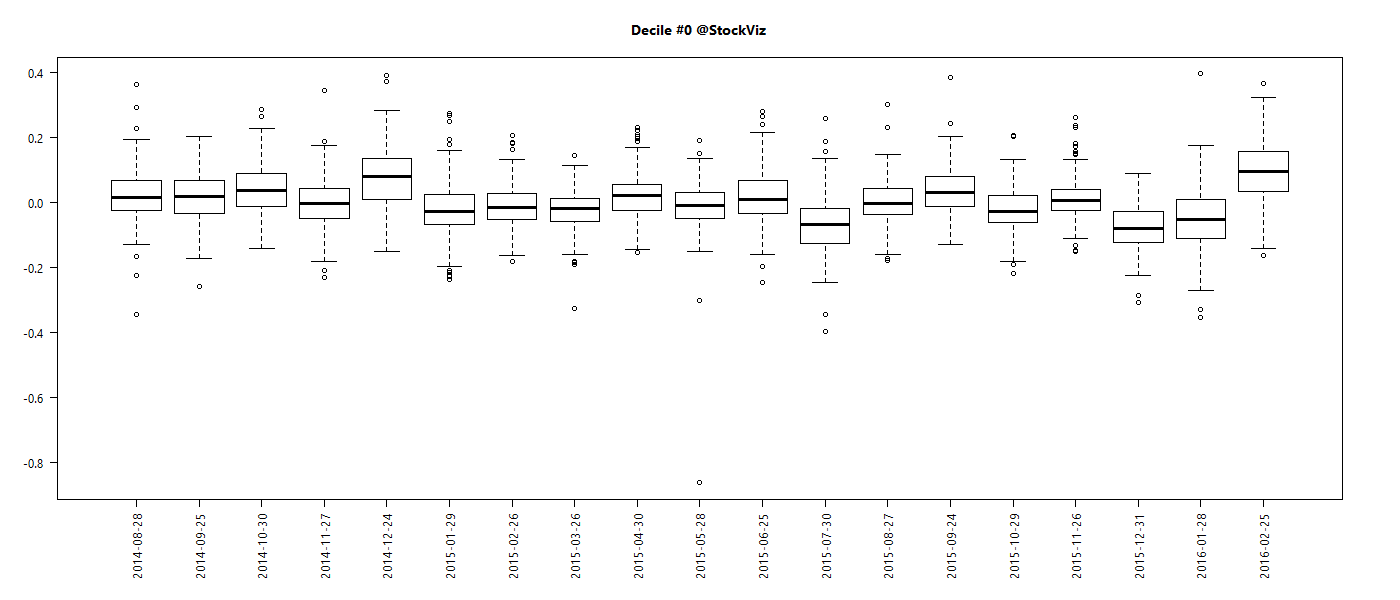
Returns from the small-cap portfolio are accompanied by larger volatility.
Accessibility
Is the alpha accessible? Given the meager volumes in the small-cap space, narrow circuit breakers and intra-day volatility of prices, small-cap alpha is hard to access. The impact cost of trading 150 small-cap stocks every month would be pretty high for large positions.
However, a portfolio with an exposure of Rs. 10,000 – Rs. 50,000 per stock is doable. So, theoretically, you can size the portfolio between Rs. 15,00,000 – Rs. 75,00,000 to access this alpha.
Appendix
Cumulative wealth charts for each decile (both cap- and equal-weighted): (a)
Box plots of cumulative returns of stocks in each decile: (b)