Tag: quant

Basis Trades using Futures

Introduction

When we discussed cash-futures basis, it was pointed out that the fair value of a futures contract is a function of the underlying price, interest rates, dividends and time to expiration. The same logic applies to the fair value of contracts across expiration dates. For example, as of close on April 30, 2015, NIFTY futures contracts had the following values: 8177.35 (April), 8244.05 (May), 8275.30 (June).

Some of our clients wanted us to check if this basis can be traded. Is it possible to profit from going long the near contract and short the far contract on a consistent basis? Before we look at profitability, lets chart the basis.

The basis

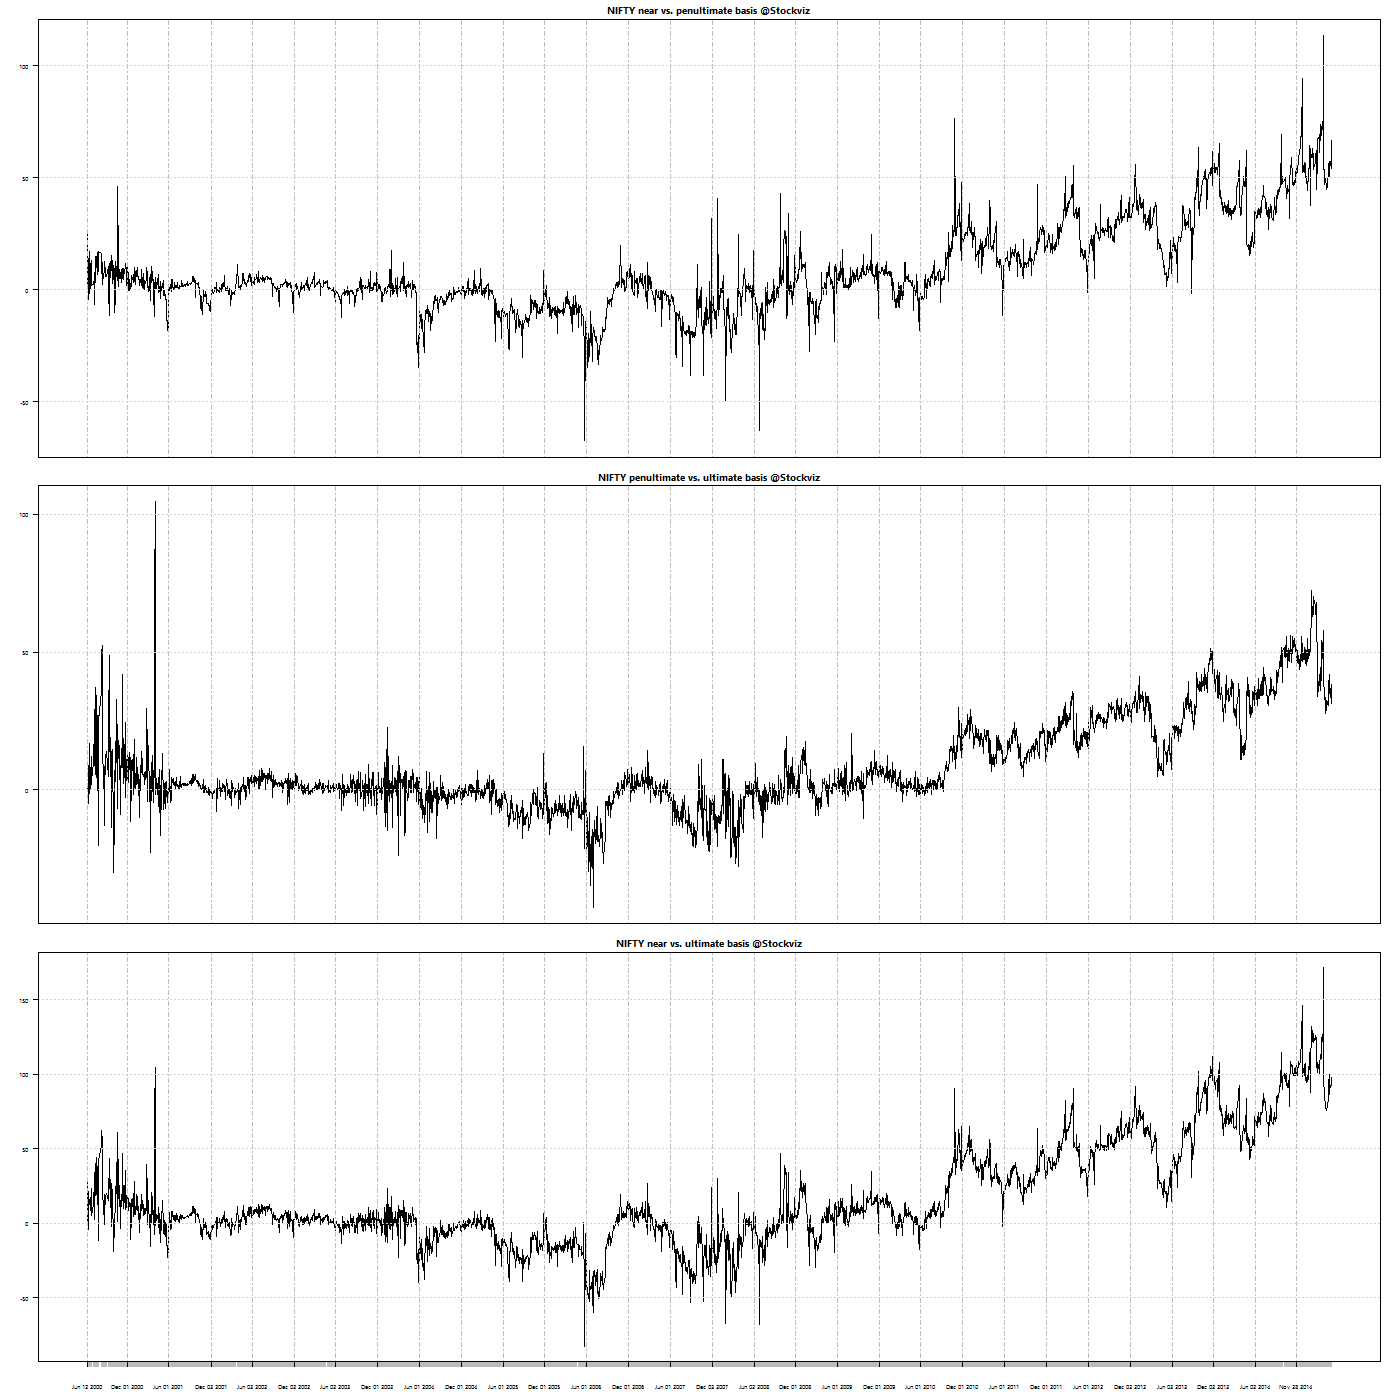
Here is how the basis between different contracts look (2000 through now):

NIFTY.futures.basis

Here is the summary statistic of the basis:

summary statistics

Here is the same data with futures expiry dates removed:

summary statistics

With the extreme values removed, we can now check if we can trade the nearest expiry contract with the farthest.

50-day Average Basis Trade Back-Test

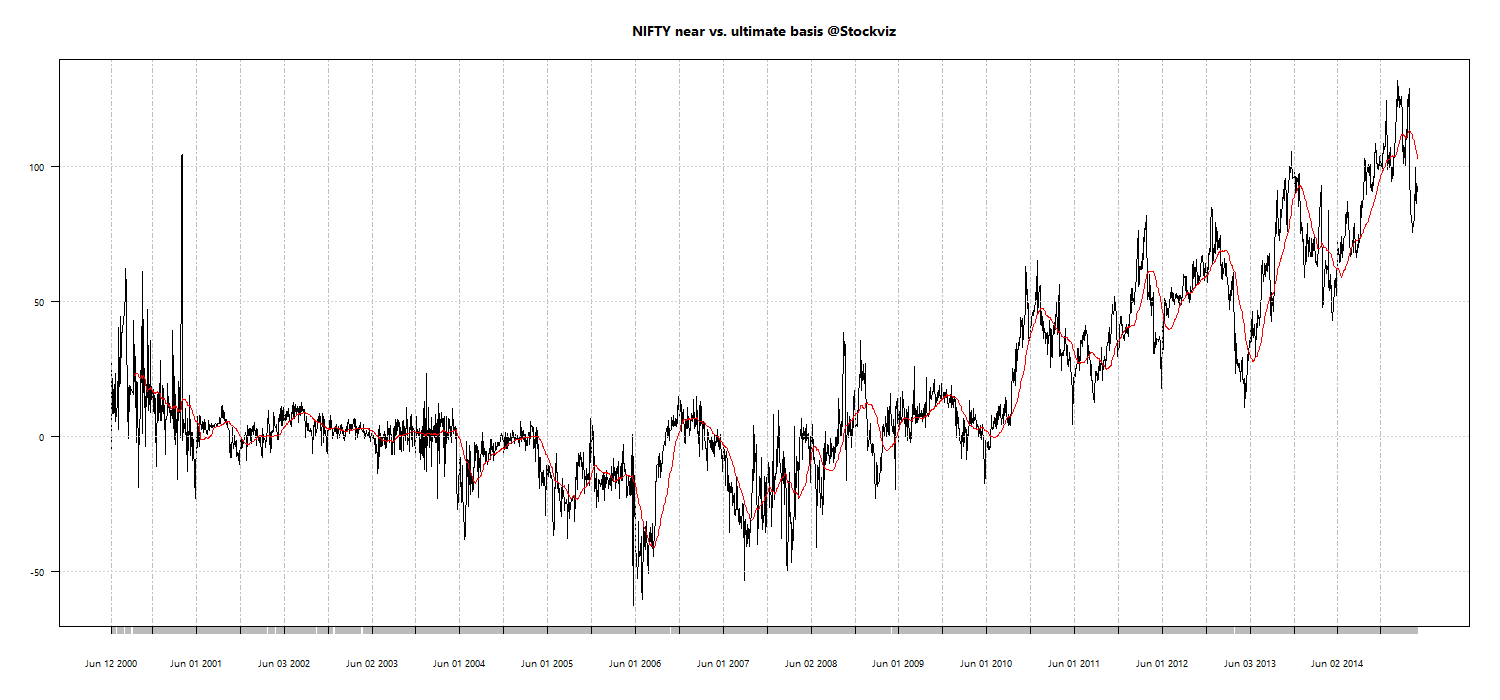
Lets take a look at the Near vs. Farthest basis and draw a 50-dma through it:

NIFTY.futures.basis.50dma

The basis is not stable and what’s worse, it appears to be trending. Lets try our simple trading rule: go long the basis if it is above 50-dma and short if otherwise.

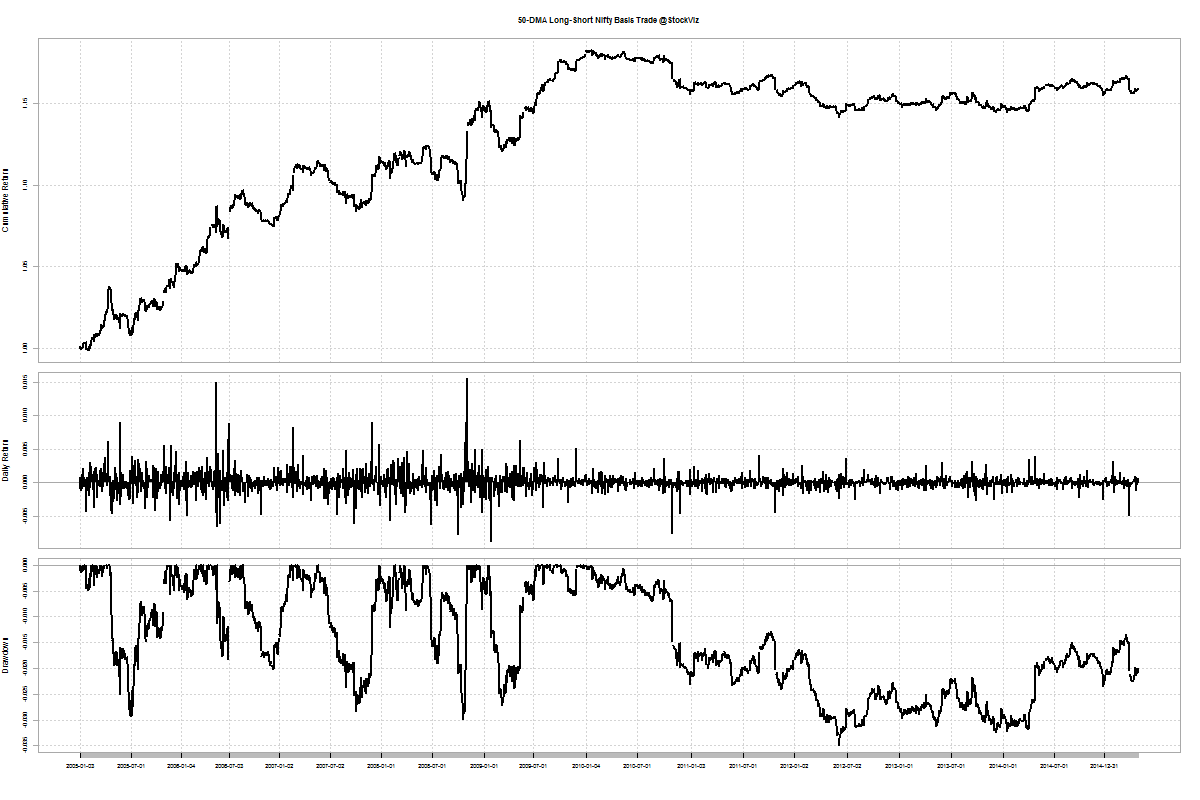
Here’s how the back-test works out (2005 through now):

NIFTY.futures.basis.50dma.trade.2005

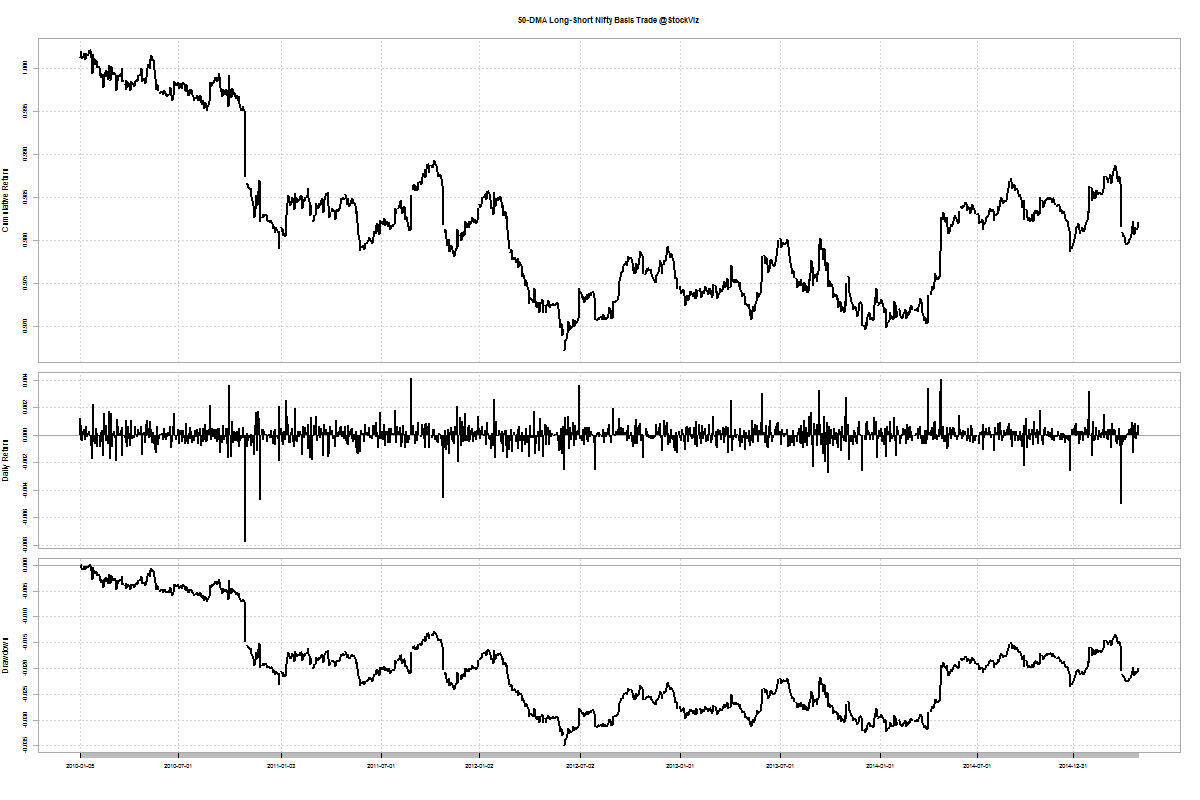
Lets check the back-test on a smaller subset (2010 through now):

NIFTY.futures.basis.50dma.trade.2010

A ~20% profit in a 10 year time-frame is barely enough to cover transaction costs. Besides, it looks like the strategy hit a wall in 2010.

Conclusion

It appears that the basis trade described above is not profitable enough after considering transaction costs and taxes. Also, whatever meager profits were there seem to have been arbitraged away lately.

Is there a correlation between USDINR and Tech stocks?

tl;dr

No.

The Myth

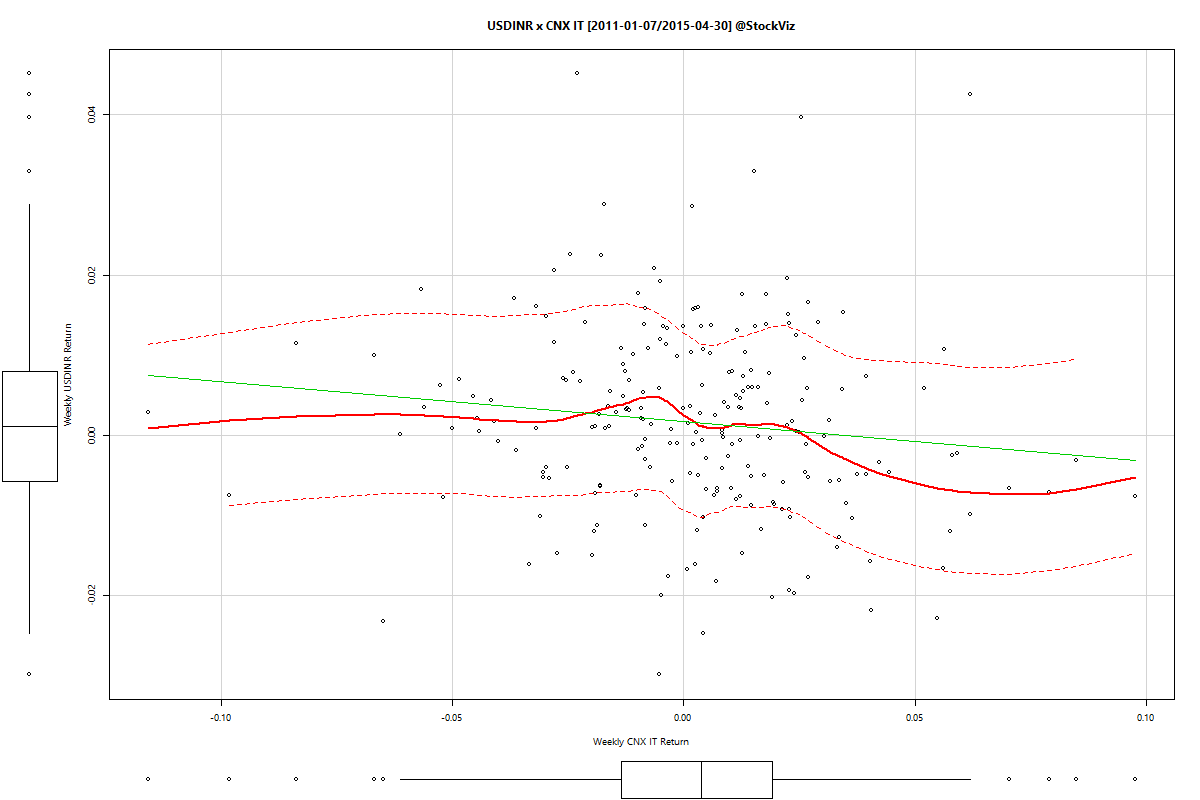
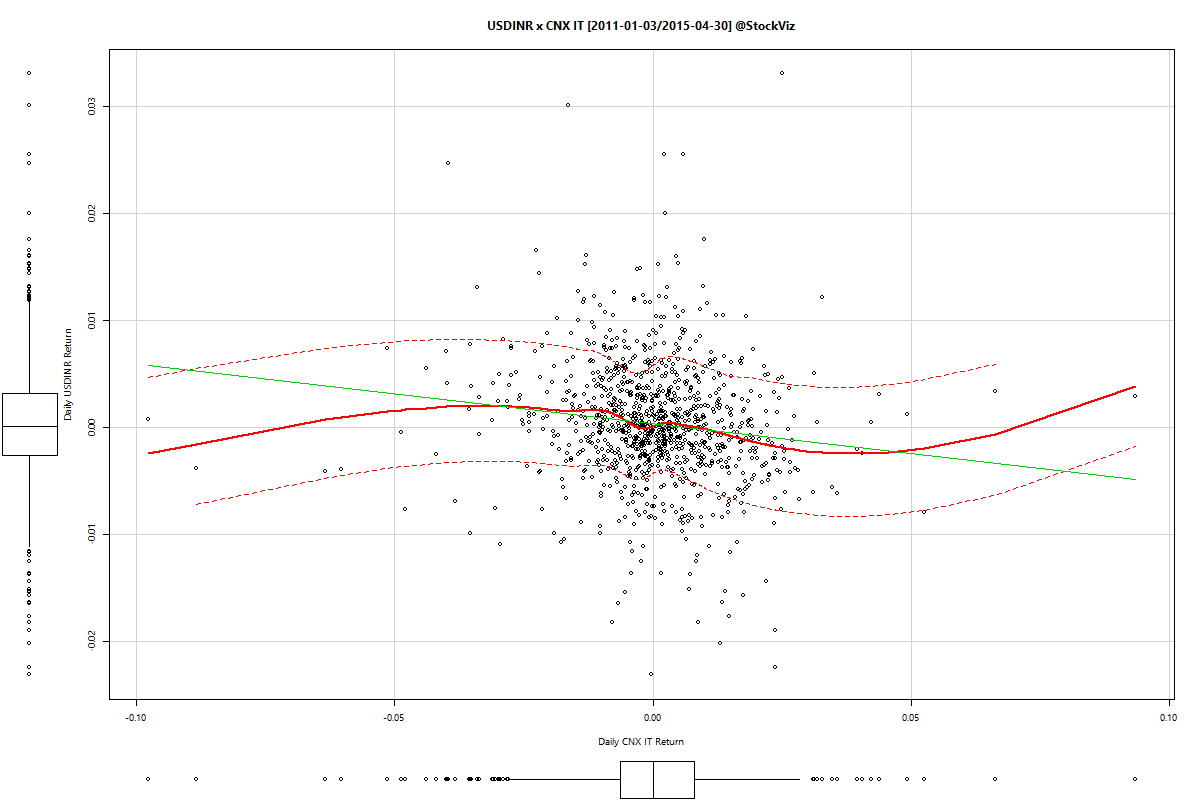
Regular viewers of CNBC might have heard the refrain that “IT stocks went up because the rupee went down.” But it turns out that it is the classic case of the journalist/reporter/anchor going in search of a reason to explain a random market event. If there is such a correlation, then a scatter plot of USDINR returns vs. CNX IT index returns should unearth it.

Scatter Plots of Returns

Weekly:
CNX IT.USDINR.scatter.weekly

Daily:
CNX IT.USDINR.scatter.daily

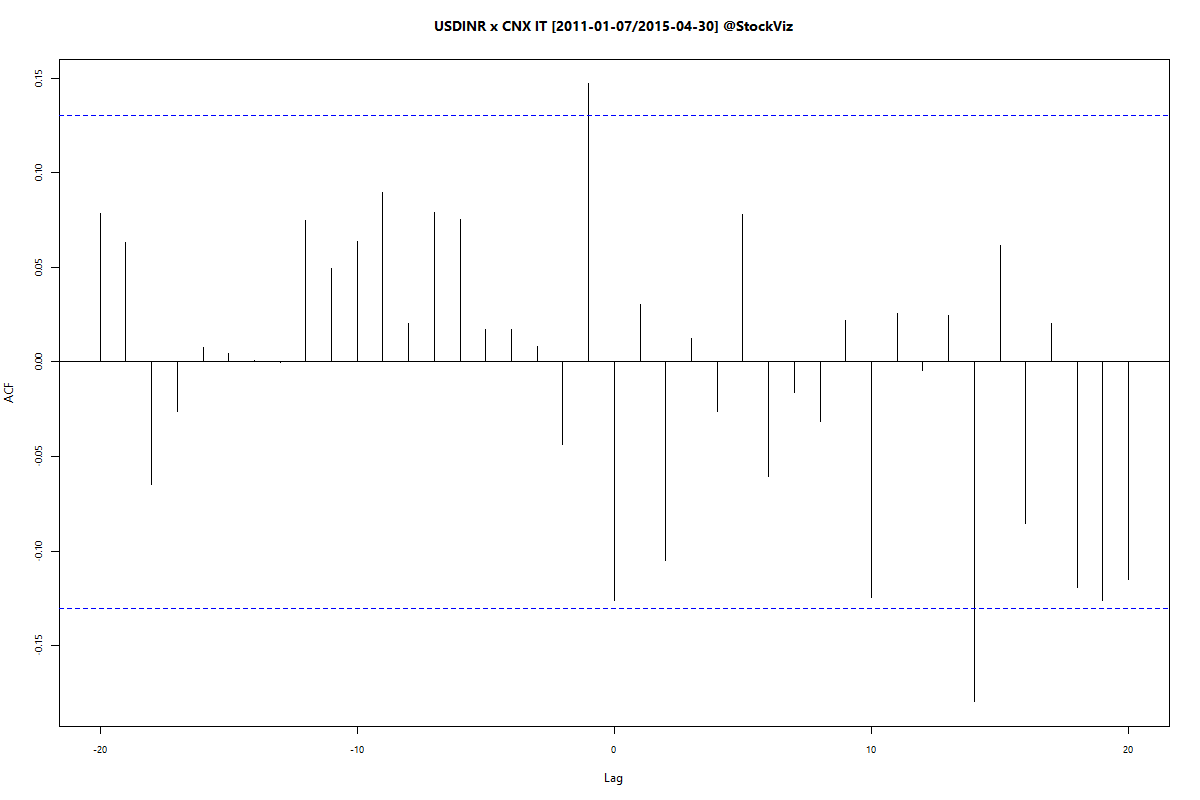
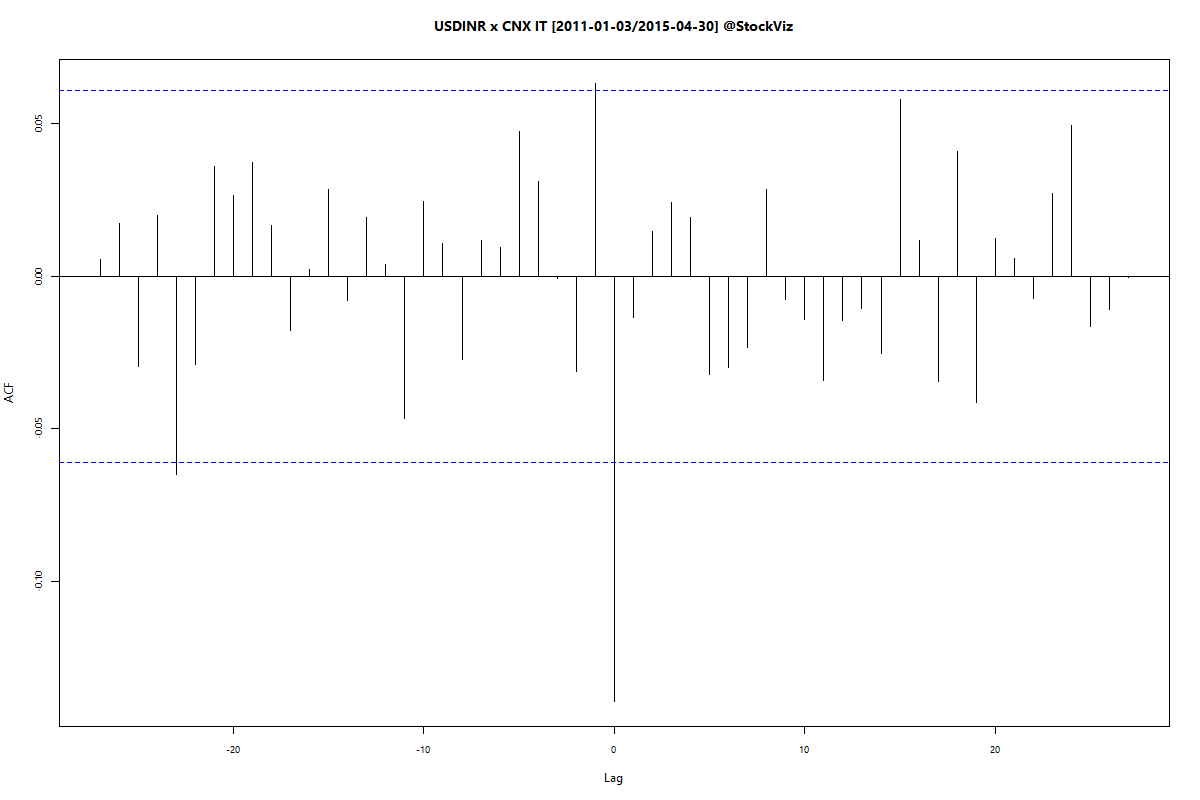
As you can see, there is no obvious link between USDINR and technology stocks. But what if the effect manifests after a lag?

Cross-Correlation Plots of Returns with Lag

Weekly:
CNX IT.USDINR.ccf.weekly

Daily:
CNX IT.USDINR.ccf.daily

Conclusion

Currency moves alone cannot be your go-to explanation for fluctuations in tech stocks.

Gaps and the Pre-Open Call Auction

tl;dr

You should not treat opening prices before and after October 18, 2010 the same.

Call Auction in the pre-open session

If you don’t know how the pre-open session works, here’s a good explainer from BSE:

When you run back-tests that use the opening price, this change will most likely trip you up.

Before and after

Nifty opening gaps since 2000:

CNX NIFTY.gap

Notice the shift in the median before and after the auction was introduced (all figures in %):
gap summary

Before:
CNX NIFTY.hist.2

CNX NIFTY.hist.3

After:

CNX NIFTY.hist.4

Conclusion

One way to make the opening prices comparable is to take tick-level data and compute a synthetic opening price yourself, just like how the closing price in computed. And you can use this synthetic open across your entire data set.

Otherwise, you will have to take you back-test results with a healthy dose of skepticism and make sure that there is enough room in your analysis to account for this.

Long-Short Trend Following

Prior Work

We had discussed the SMA On/Off Switch and its ability to escape the worst days. Based on this finding, we setup a Tactical Theme that would go long NIFTYBEES and JUNIORBEES if the CNX 100 index is trading above its 50-day SMA and move into LIQUIDBEES otherwise.

What if, we could go long and short?

Naive Long-Short

Here’s how going long above 50-DMA and short below 50-DMA on the CNX 100 since 2001 compares:

CNX 100.02-Jan-2007.28-Apr-2015.long.short
Long-Short SMA (black), Long-Only SMA (red) and Buy & Hold (green)

It looks like going both long and short is not significantly better than a long-only tactical strategy.

Long-Short with Volatility

But what if, we add a volatility metric into the mix? The logic here is that corrections are preceded by a bout of volatility. So if you go short if either or the volatility signal or the 50-DMA indicates a negative bias and long otherwise:

CNX 100.02-Jan-2007.28-Apr-2015.long.short.volatility
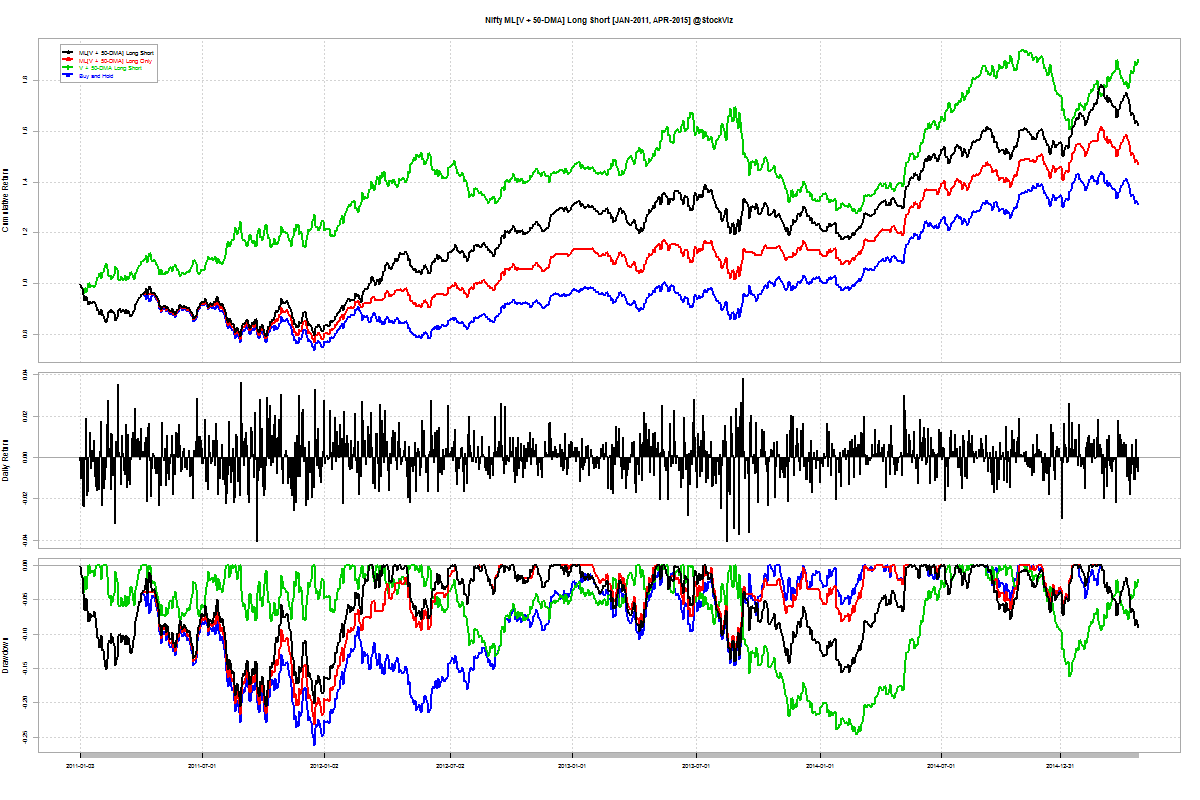
Long-Short SMA w/ Volatility (black), Long-Only SMA w/ Volatility (red), Long-Only SMA (green) and Buy & Hold (blue)

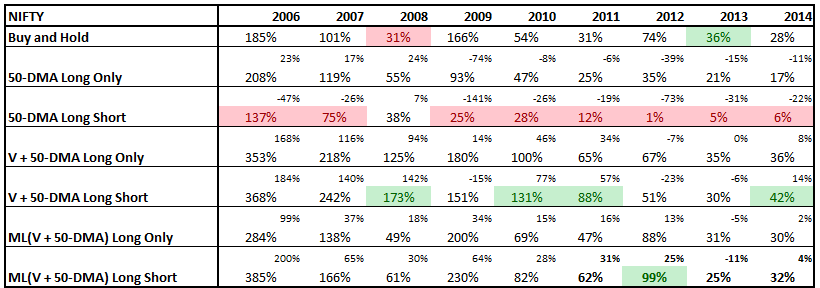
It looks like there is significant alpha in the combination approach.

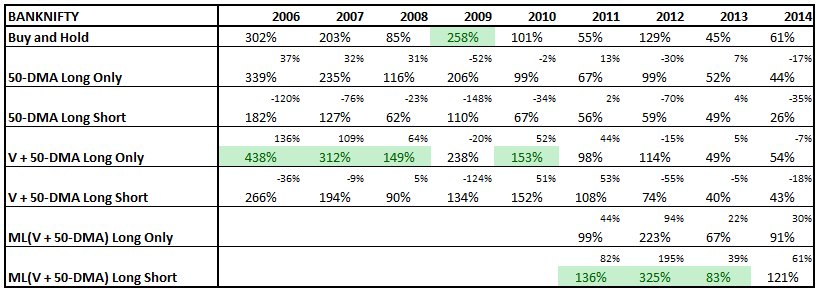
Long-Short NIFTY and BANKNIFTY

NIFTY returns since 2001:
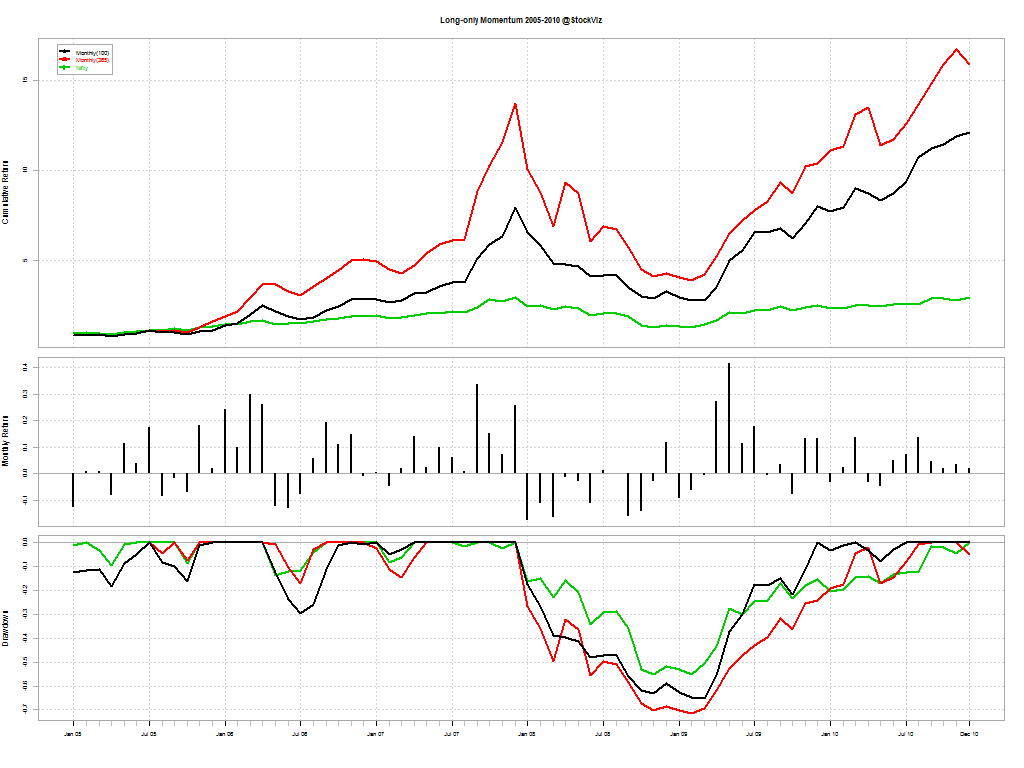
CNX NIFTY.01-Jan-2001.28-Apr-2015.long.short.volatility

And the same for the BANK NIFTY since 2006:

CNX BANK.12-Jan-2006.28-Apr-2015.long.short.volatility

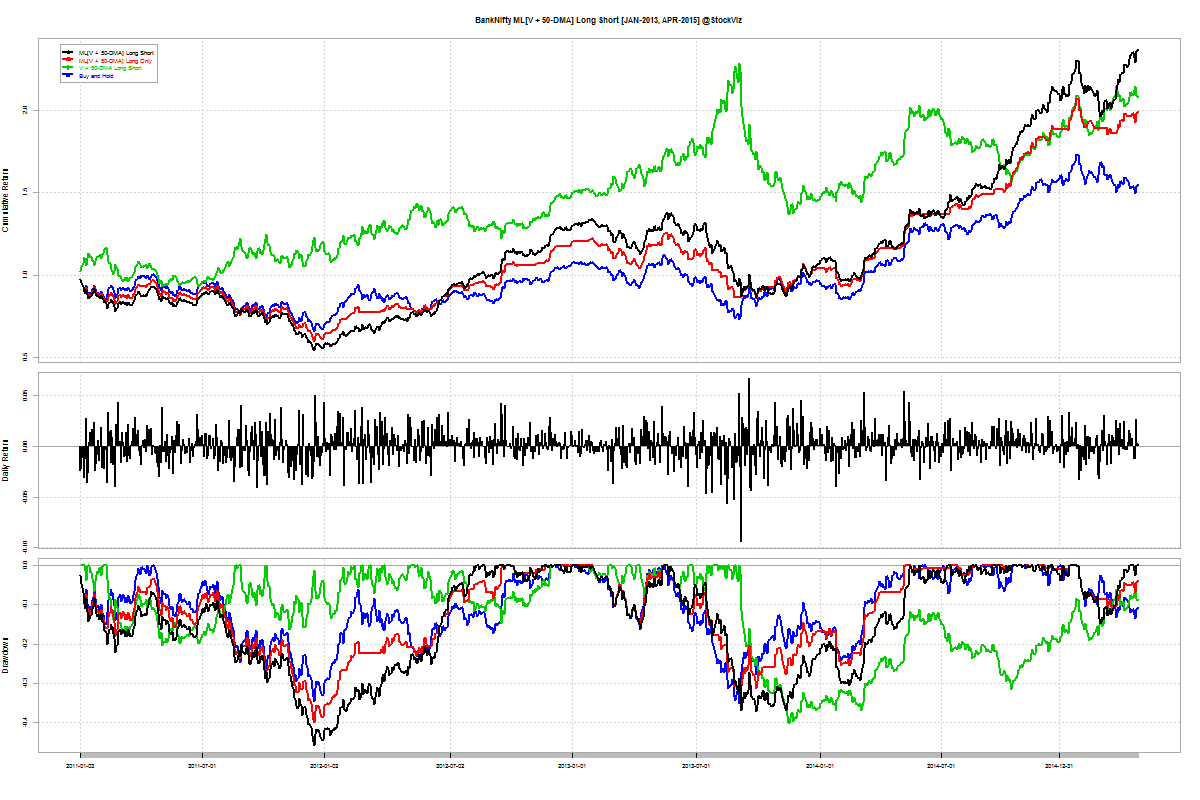
NIFTY and BANKNIFTY since 2011:

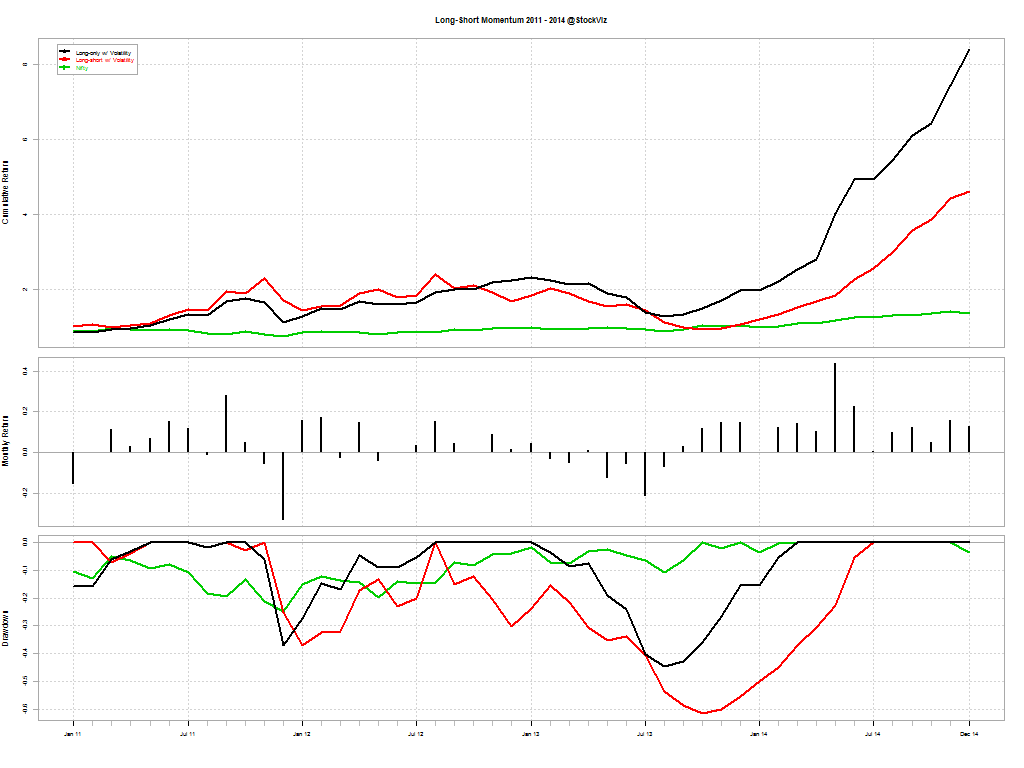
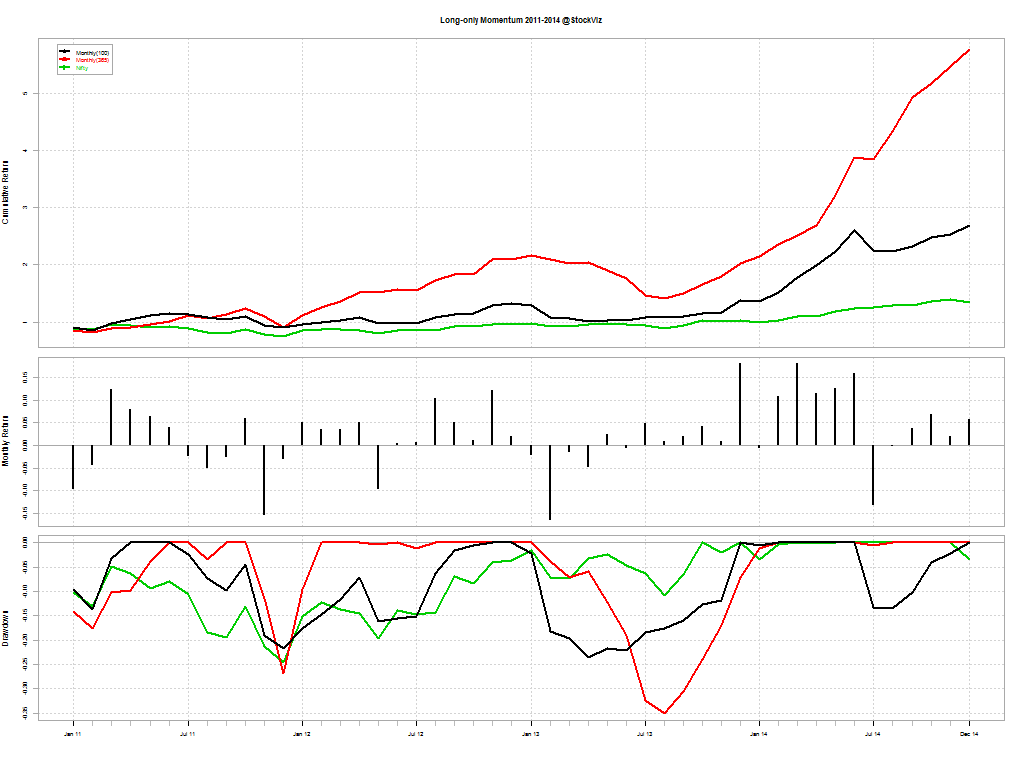
CNX NIFTY.03-Jan-2011.28-Apr-2015.long.short.volatility

CNX BANK.03-Jan-2011.28-Apr-2015.long.short.volatility

NIFTY and BANKNIFTY since 2013:

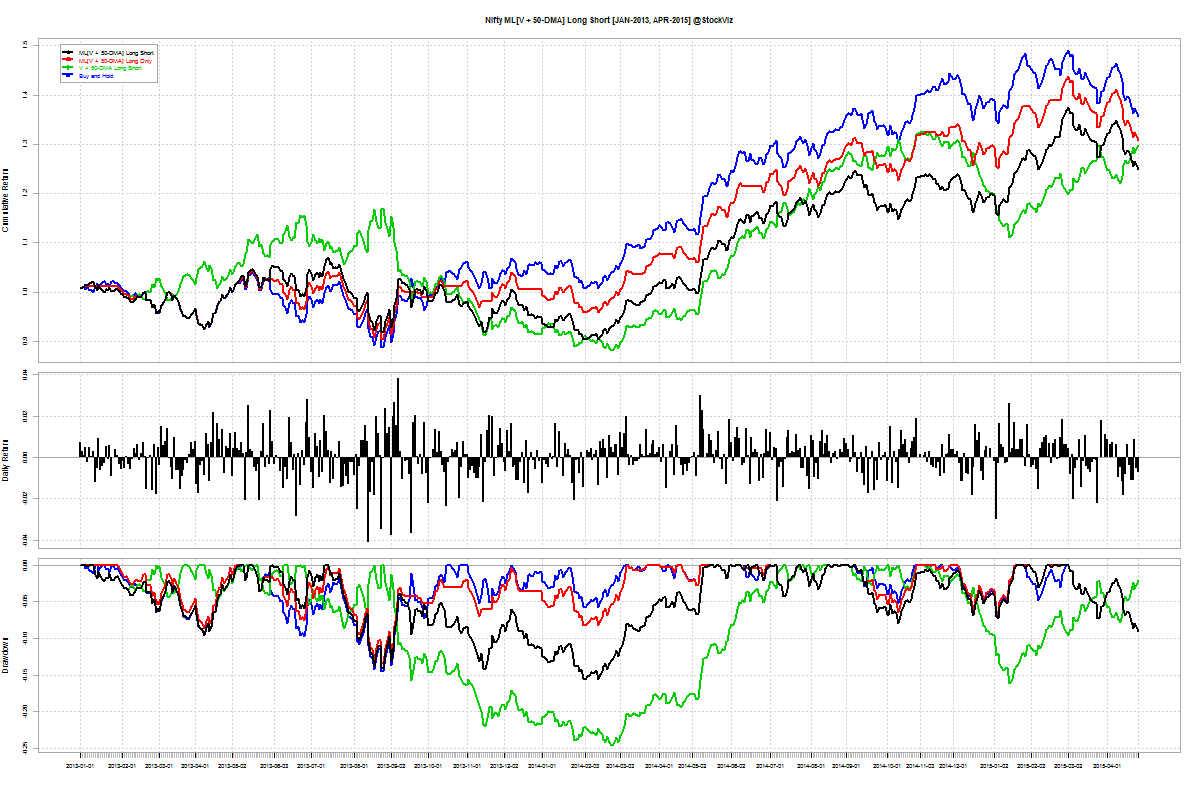
CNX NIFTY.01-Jan-2013.28-Apr-2015.long.short.volatility

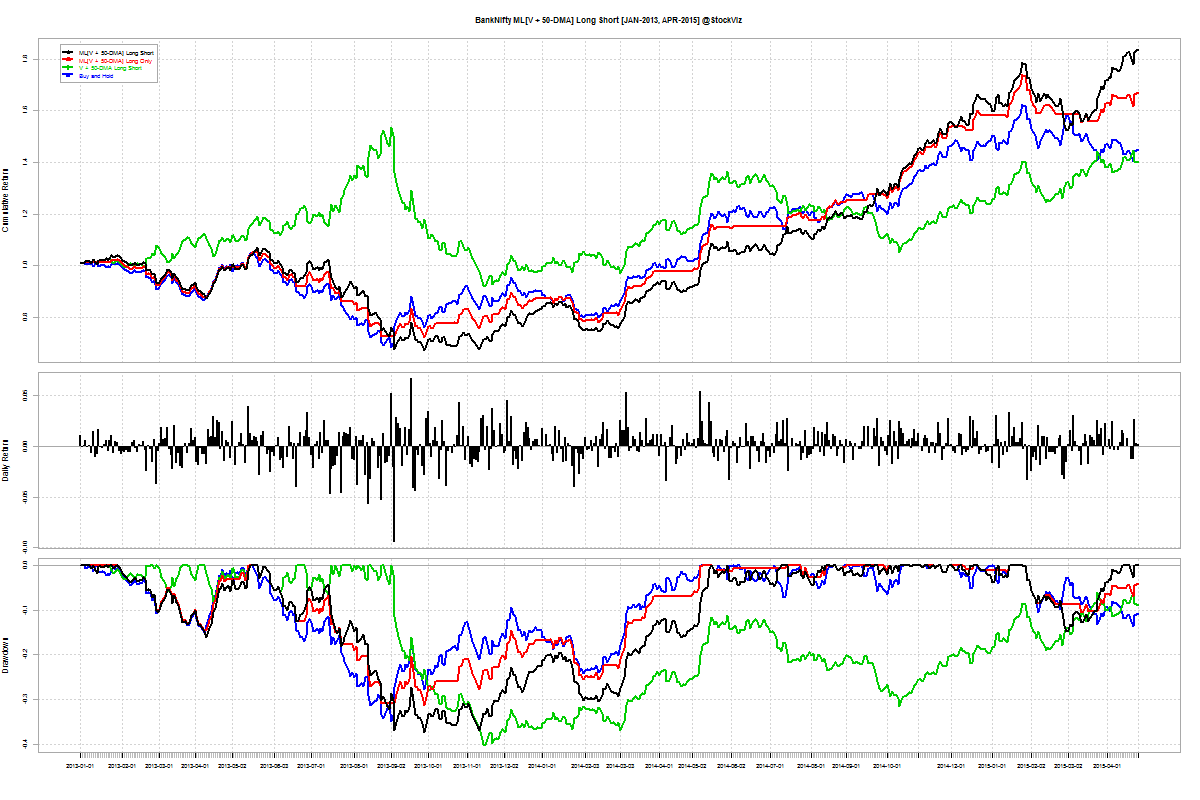
CNX BANK.01-Jan-2013.28-Apr-2015.long.short.volatility
Long-Short Combo (black), Long-Only Combo (red), Long-Only Tactical (green) and Buy & Hold (blue)

Conclusion

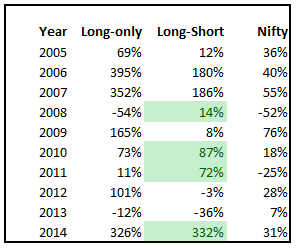
It appears that there is long-term alpha in using a combination of volatility and 50-DMA to implement a long-short strategy. To put this to test using real-time data, we have created a theme to make it easy for you to follow along: Trend Long-Short.

The SMA Risk On/Off Switch

Market timing is a very divisive topic in investing. For traders, it has been the search for the holy grail. For passive investors, a source of derision.

Far more money has been lost by investors preparing for corrections, or trying to anticipate corrections, than has been lost in corrections themselves. – Peter Lynch

Does it mean investors should just remain long all the time? Hardly, according to the latest research by Meb Faber (ssrn).

Data for international markets show that volatility increases in declining markets. Any strategy that keeps you out of those periods, will improve your portfolio returns. The outline of his strategy is simple: go long the market if it is trading more than its 200-day SMA and stay out of the market otherwise.

A small amount of outliers have a massive impact on performance and the best and worst outliers tend to cluster when the market is already declining. However, if you miss the best and worst days in every case your compound return is higher than buy and hold.

It works across most international markets:

miss best and worst days

Unfortunately, the paper doesn’t discuss the Indian markets, so lets try and fix that.

Best and worst days

The table below shows that in a rising market, +1% days (BEST) outnumber -1% days (WORST) and the reverse is true of declining markets. Also, as you decrease the look-back period, the WORST to BEST ratio increases in a declining market.

nifty best worst

Cumulative Returns

If you apply the SMA switch to the Nifty index, here’s how the cumulative returns look like:

nifty cumulative returns

200-day SMA Cumulative Return Chart

Since: 2000
CNX NIFTY-200-day-sma-returns-2000

Since: 2010
CNX NIFTY-200-day-sma-returns-2010

50-day SMA Cumulative Return Chart

Since: 2000
CNX NIFTY-50-day-sma-returns-2000

Since: 2010
CNX NIFTY-50-day-sma-returns-2010

Drawdowns

If the SMA rule really helped investors stay out of negative fat tails, then it should manifest itself in the drawdowns.

drawdowns

Conclusion

Using a simple SMA rule helps investors avoid drawdowns and boost returns as compared to a naive buy and hold strategy. The smaller the look-back period, the better the returns and lower the drawdowns.