What happened
SEBI, in its infinite wisdom, concluded that retail investors are speculating too much with derivatives because exposures are too low. So they decided to increase the minimum exposure to Rs. 5 lakh per contract. You can read their press release in the appendix below.
Who is affected?
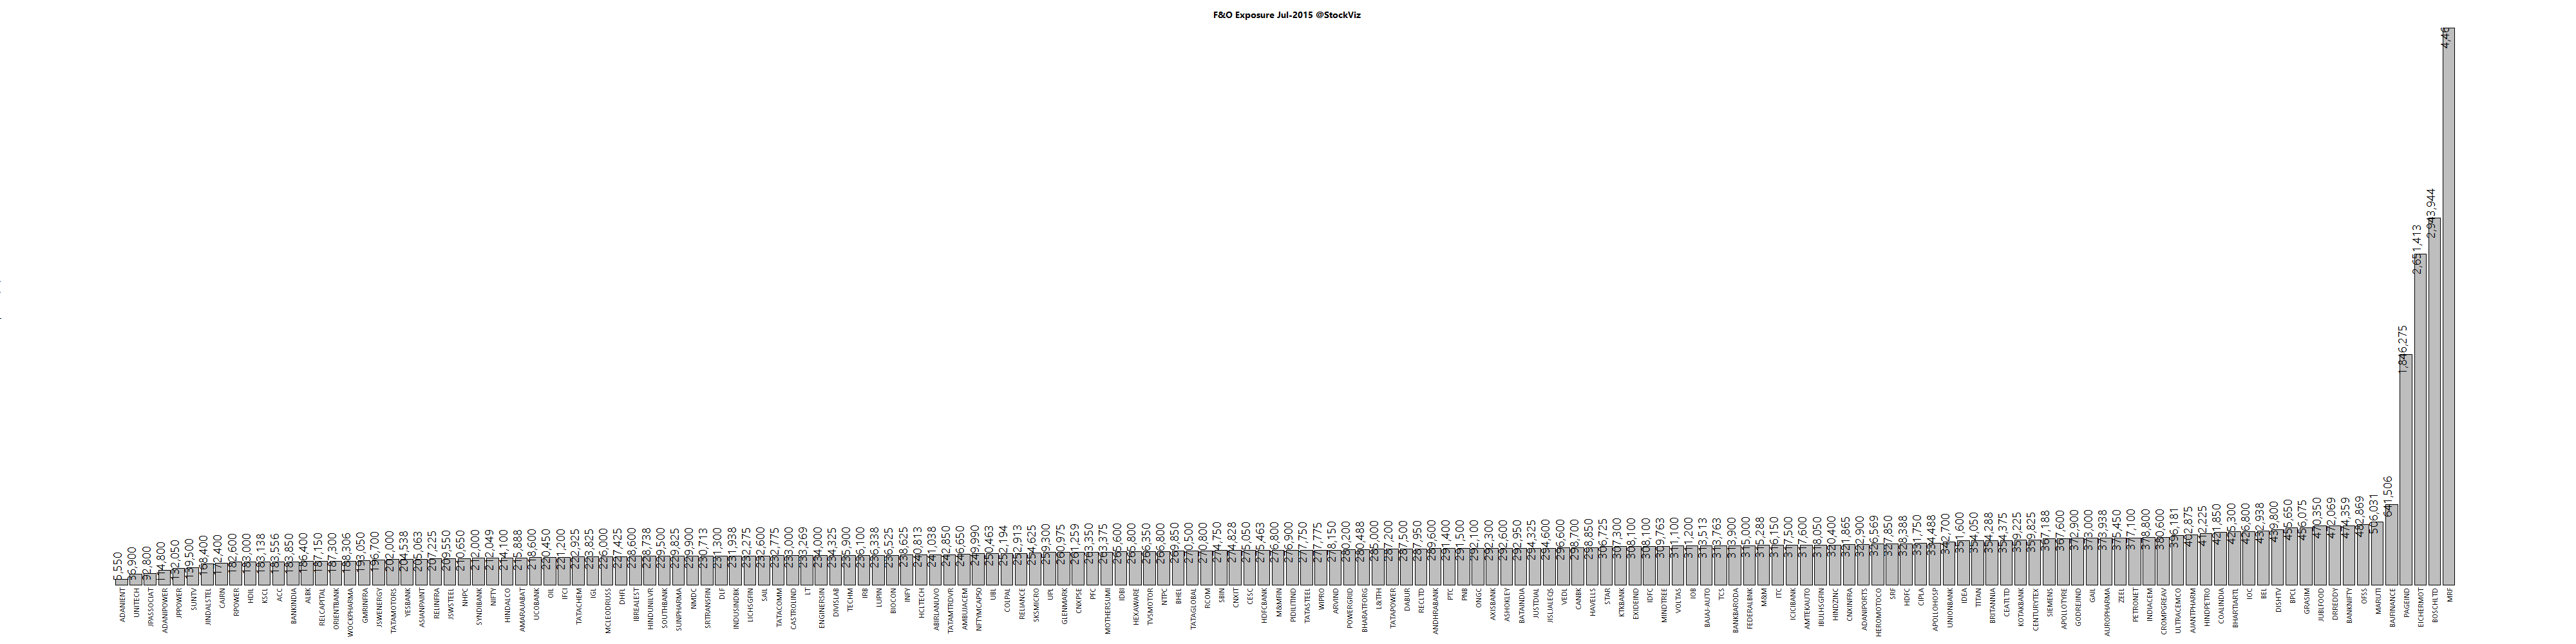
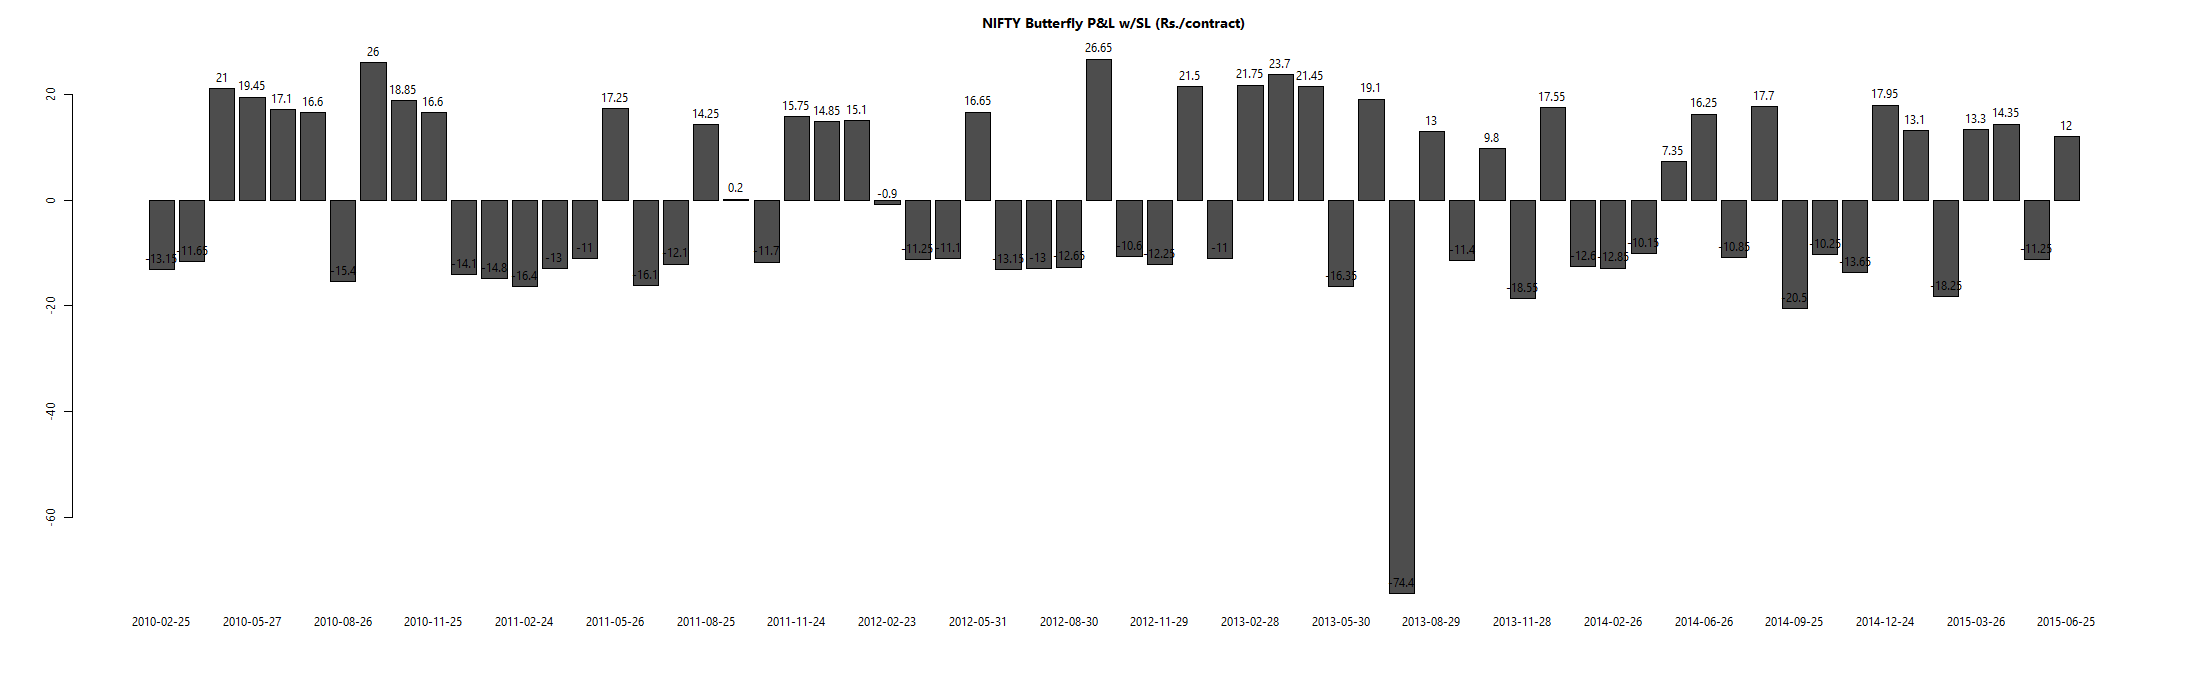
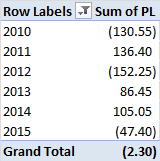
Anybody who trades naked derivatives will see their margin requirements go up. As you can see from the chart above, most of the exposures are below the new Rs. 5 lakh threshold. Lot-sizes of MRF, BOSCHLTD, EICHERMOT and PAGEIND will come down, but that is of little comfort.
What next?
For exposure margin, you can always buy a bond fund and pledge it with your broker. This way, your margin cash will earn something while it is with your broker.
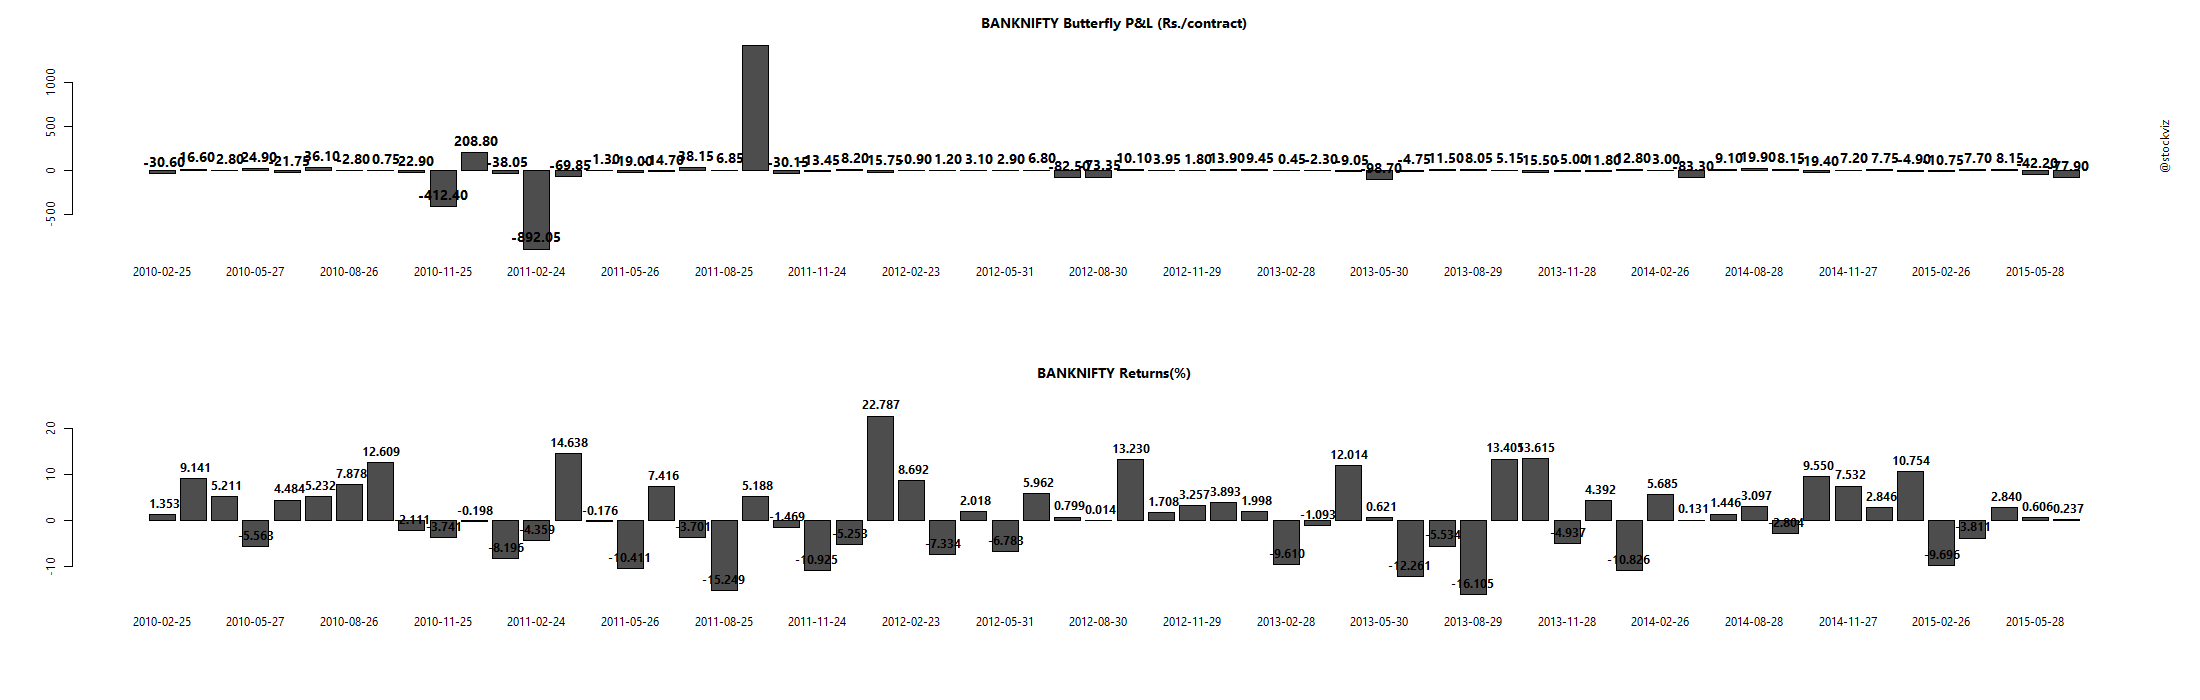
Second, you can always use option strategies to execute the same view. For example, the total margin requirement to enter a trade in NIFTY futures is around Rs. 17,000/- right now. But when the new regulations kick in, it could go up 3x to 51,000/- Suppose you want to express a bullish view on the NIFTY, instead of buying a naked call or futures contract, you can enter a bull spread to lower the margin requirements.
Here are the numbers from the Zerodha SPAN calculator.
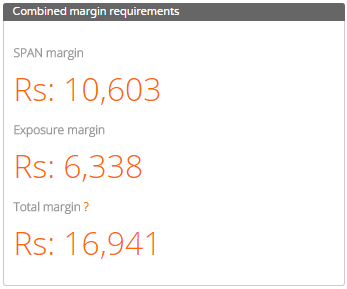
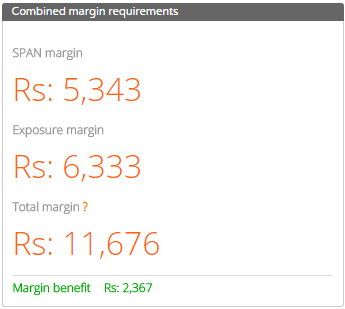
The bull spread has lower up-front margin requirements than the naked futures contract, with the added benefit of bounded profit and loss – resulting in lower mark-to-market margin requirements. Traders can use the pledge + spread strategy to bring down their net margin requirements.
Net effect
The net effect of the new regulation could be that naked positions in the futures markets may be replaced by strategies in the options market. The total risk in the system remains constant – like a water balloon, if you squeeze it in one place, it will pop out in another.
We expect retail futures trading volumes to drop and options volumes to pick up once these changes go into effect.