What is it?
An option butterfly strategy can be used to bet on underlying volatility. A long call butterfly can entered when you think that the underlying will not rise or fall much by expiration. Using calls, the long butterfly can be constructed by buying one lower striking ITM call, writing two ATM calls and buying another higher striking OTM call.
For example, with the NIFTY at ~8330, the strikes would be 8300, 8400 and 8500. If the NIFTY bends between 8310 and 8490, you make a profit of ~Rs. 90 per contract (x lot-size) and your downside (max loss) is limited to the premium you paid (~Rs. 10 per butterfly contract x lot-size.)
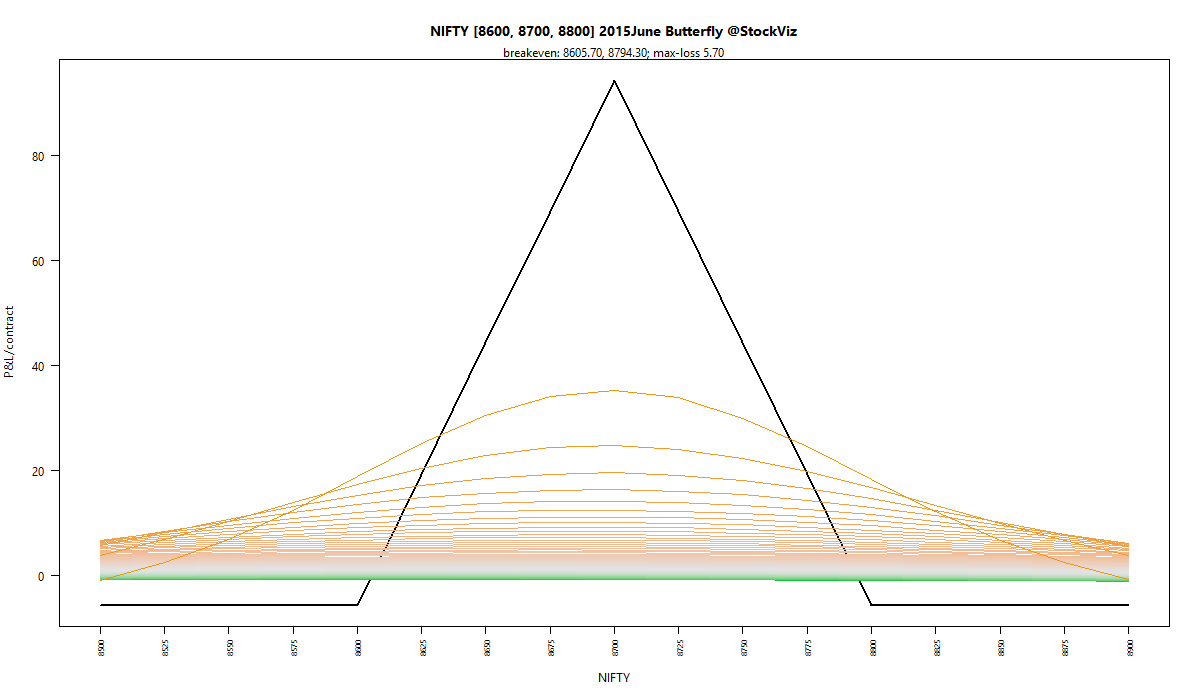
To get a sense for how your P&L will look, you can project the option premiums using the Black-Scholes model.
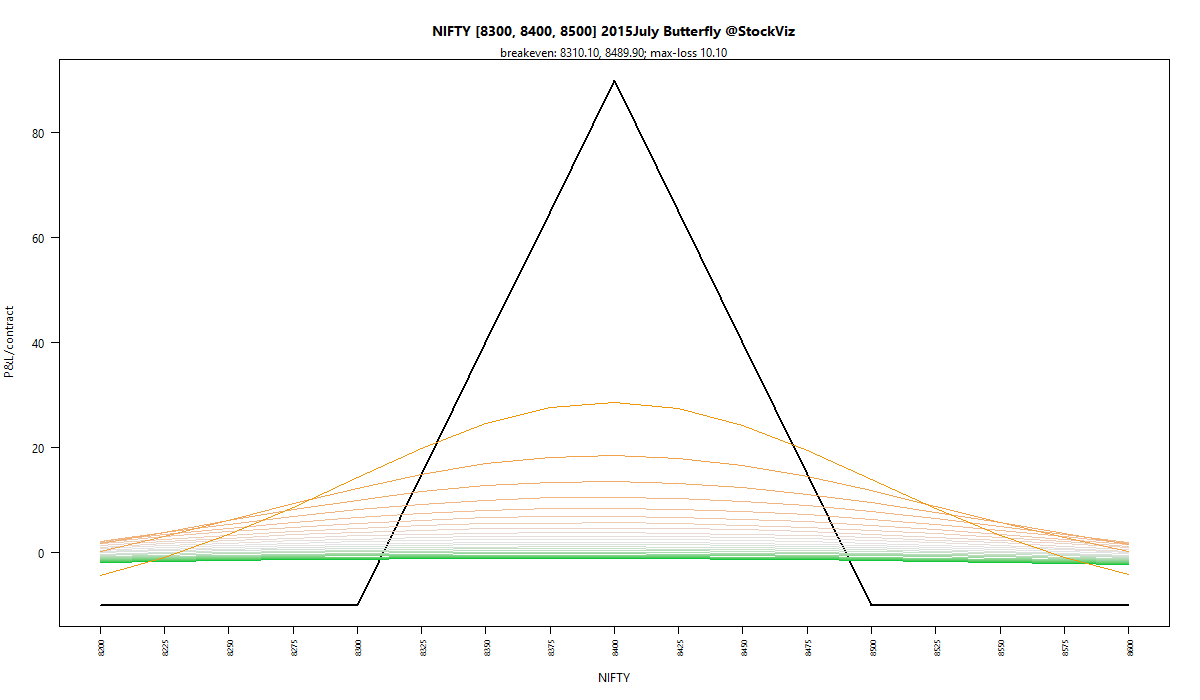
The solid black line is the P&L scenario at expiry. As you can see, intermediate P&L bears very little resemblance to expiry. It is almost as if most of the P&L is “pulled” as you get nearer to expiry.
Projection vs. Reality
Back in early April this year, the NIFTY was trading around 8600. So you would enter into an 8600, 8700, 8800 butterfly. If you sold the June butterfly, you are essentially betting that the NIFTY would expire outside of 8605 and 8795. If it did, you would get to keep the premium you received (~Rs. 5.70 per butterfly.)
Here is how the butterfly actually behaved:
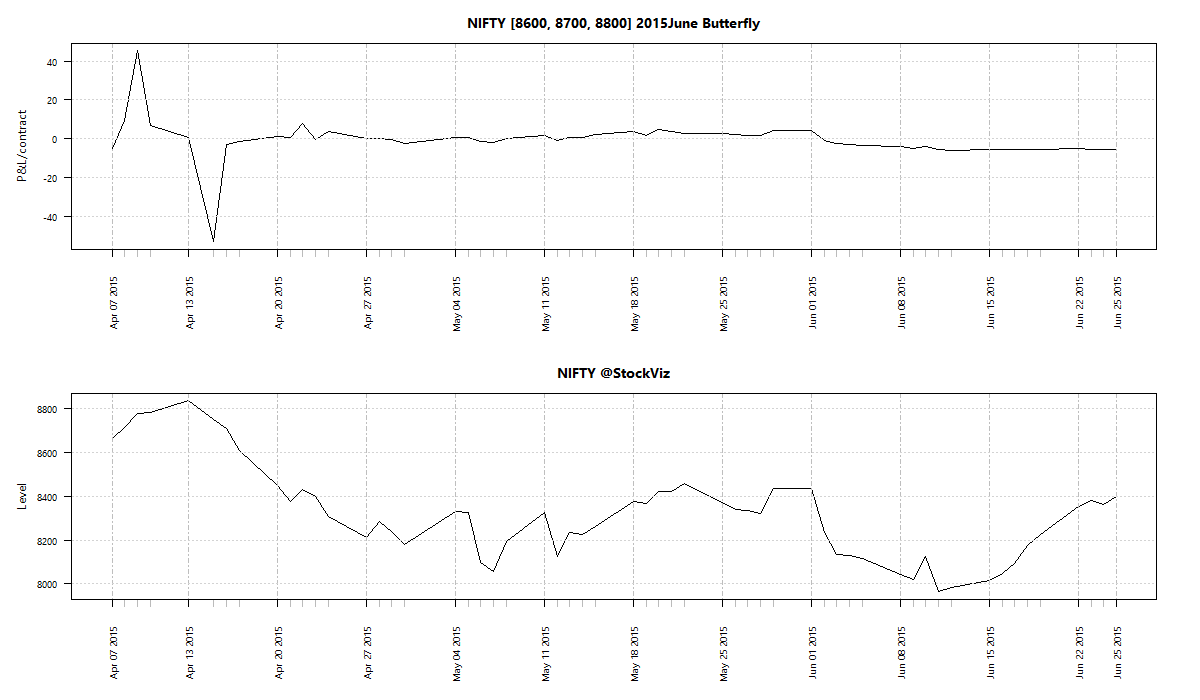
As a seller, your P&L is actually the inverse of what is shown above. So you would have lost a lot of money when NIFTY shot to 8800s and then swung the other way as NIFTY headed back down. Finally, as you neared expiry, your P&L approached the premium you received.
As you can see, actual behavior bears very little resemblance to modeled behavior.
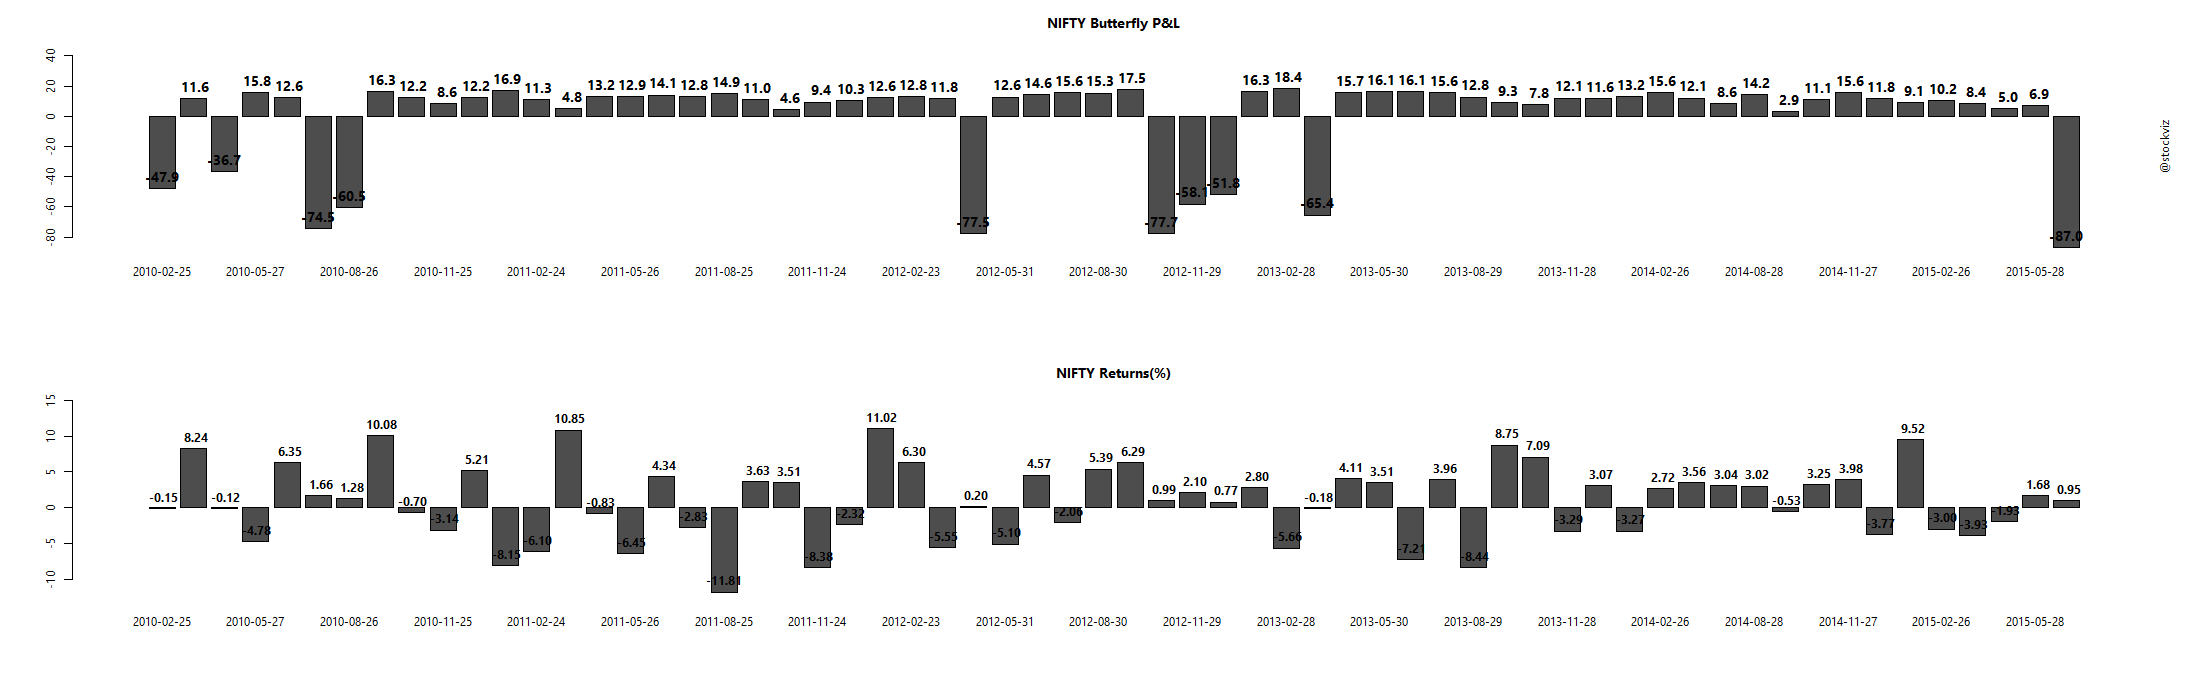
Butterfly profitability
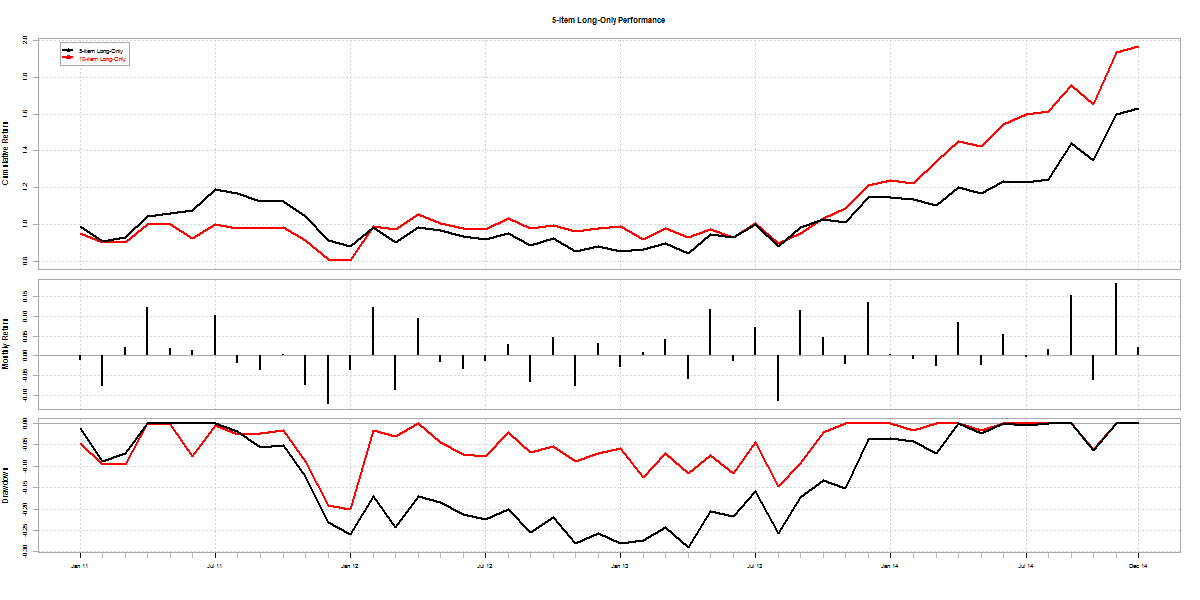
Selling butterflies has been a profitable trade this year. As long as there is volatility, a short call butterfly should make money. Here is the long P&L (selling butterflies would invert this P&L):
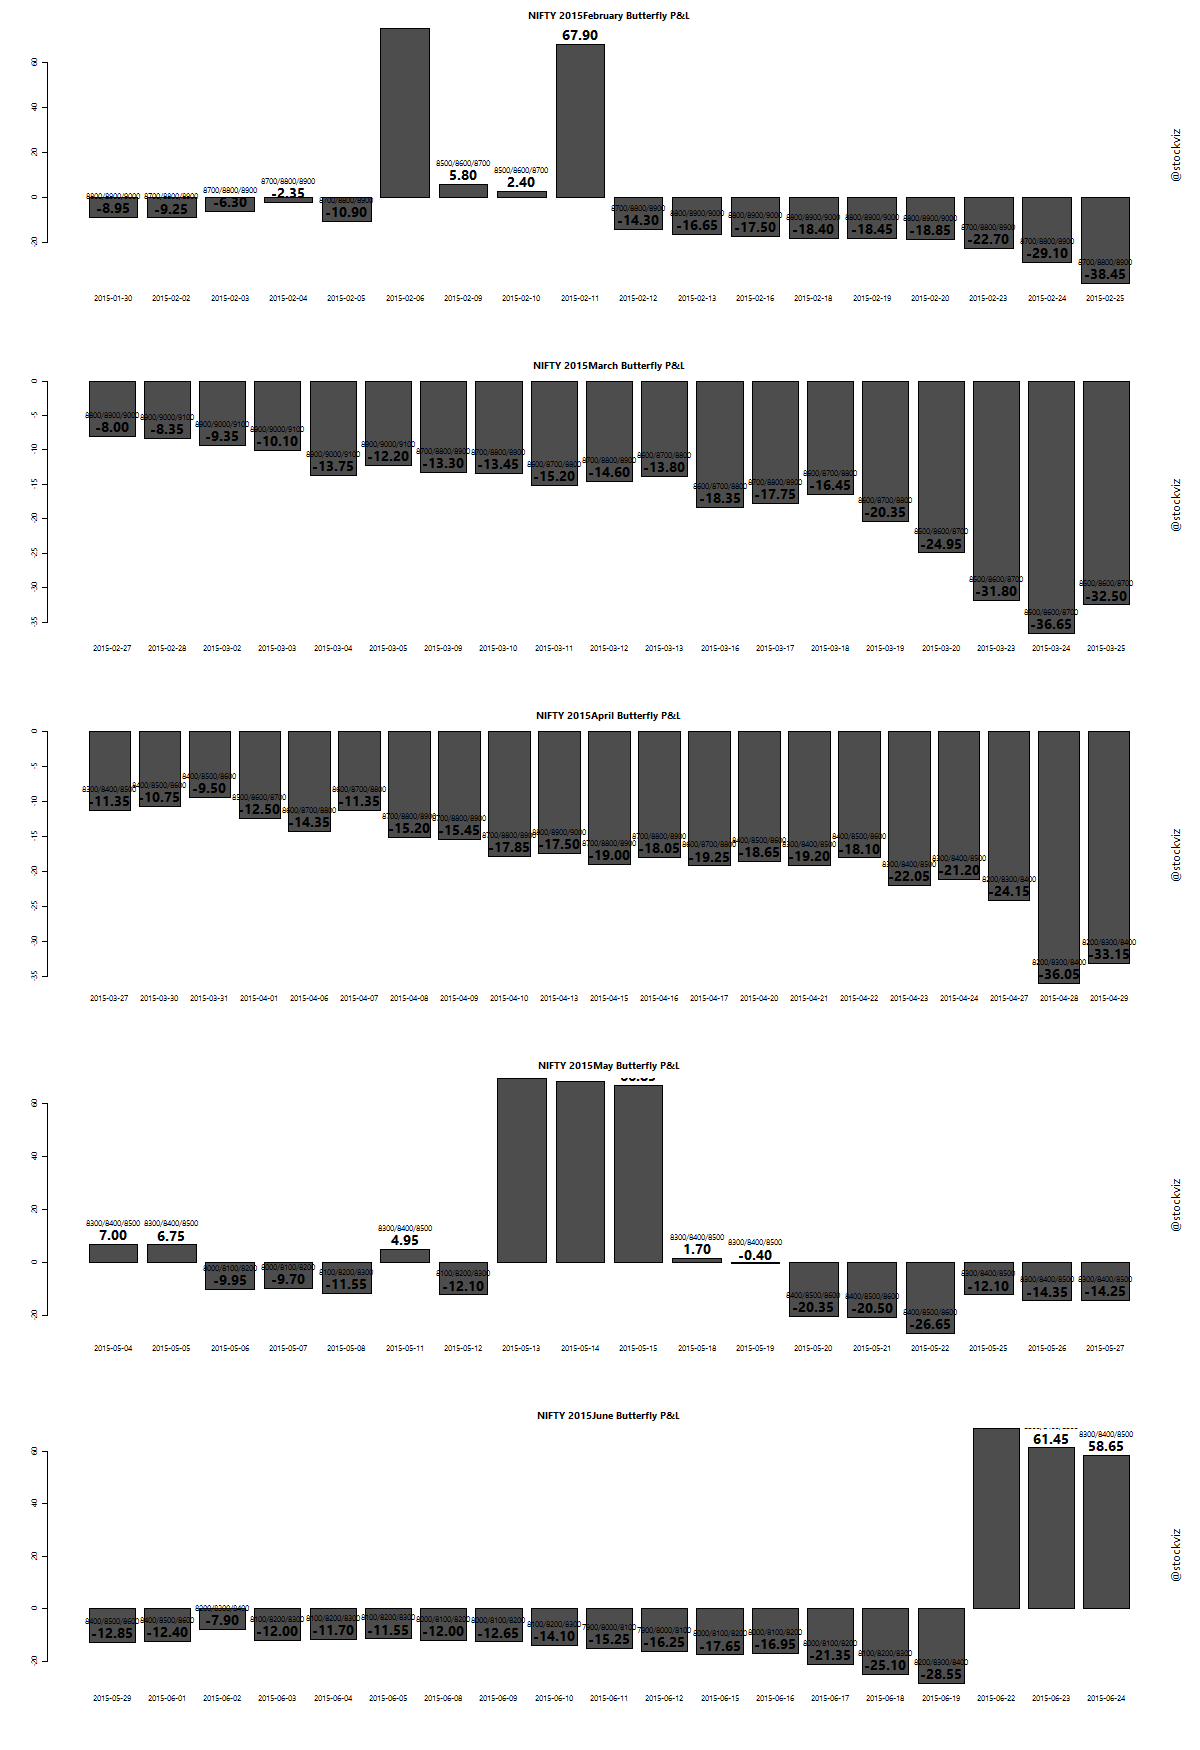
However, it is a bet on the NIFTY not expiring within the break-even range of the trade. Getting this right could prove tricky. Losses tend to be large and if risk is not managed properly, it can wipe out all the profits made over a period of time. The proverbial “picking up pennies in front of a bulldozer.”
Summary
To point out the obvious, liquidity is a huge problem while executing on this trade. However, selling butterflies can be used to systematically earn carry, as long as risks are managed.