Tag: NIFTY

Total Returns

Price vs. Total Return indices

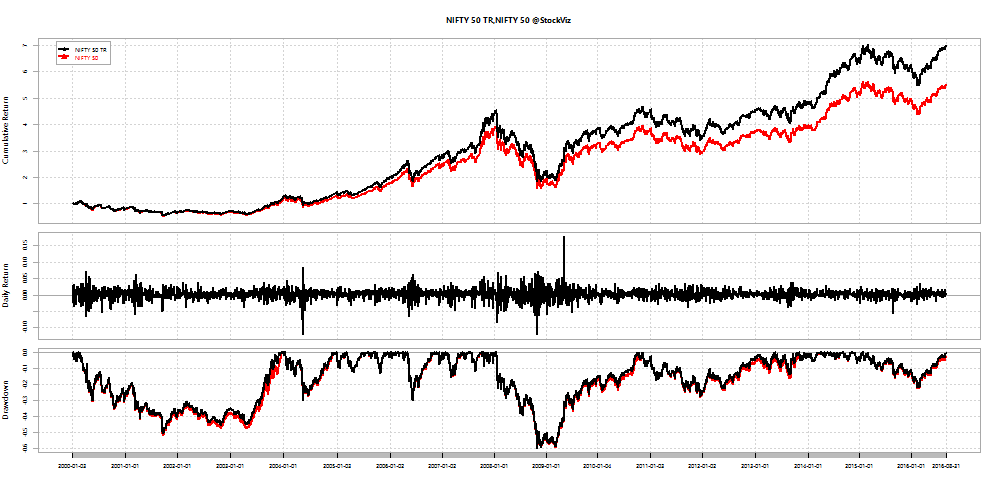
Investors often use the NIFTY 50 index as a benchmark while comparing investments. It is probably fair if you are making price comparisons. However, investment vehicles like mutual funds reinvest the dividends that they get on their holdings. So a more appropriate benchmark there is the NIFTY Total Return (NIFTY 50 TR) index.

The NIFTY 50 TR index is an index with the same constituents as the NIFTY 50 but with dividends reinvested back into the index.

total returns index equation

The Dividend Impact on Returns

To give you an idea of how dividends impact long-term returns, here’s a cumulative wealth chart of the NIFTY 50 TR Index vs. the Nifty 50 (Price) Index:

nifty-tr-returns

From the beginning of the year 2000 through to the end of August-2016, the Total Return was roughly 6x while the Price return was 4.5x. Here is how dividend reinvestment has boosted returns through the years:

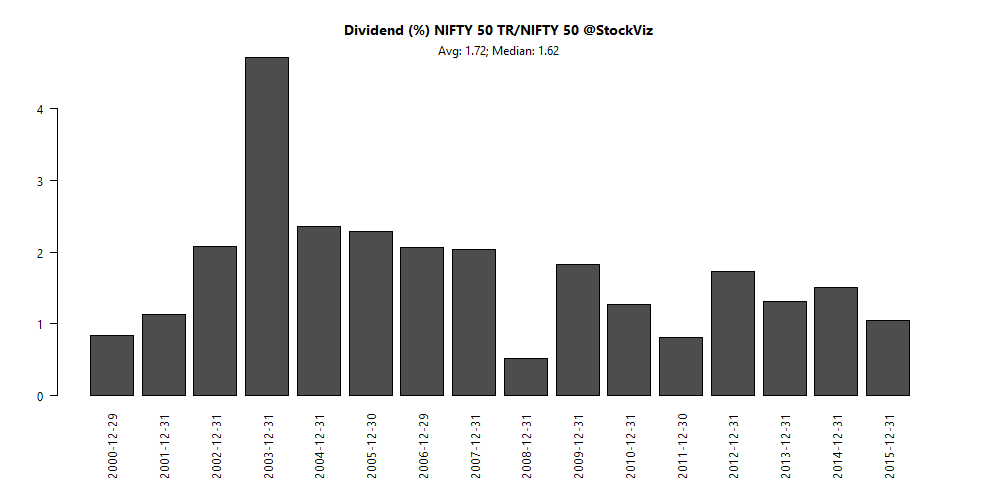
nifty-dividend-returns

A 1.6% dividend boost sounds trivial until you look at the cumulative effect of it over the years.

Should benchmarks be handicapped?

When you see mutual fund returns compared with “price” indices (all NIFTY indices are price indices unless they are explicitly mentioned to be total return,) you should handicap those returns by ~1.5-2% every year to get an idea of whether the fund actually outperformed the index.

It is tragic that the NSE has maintained a total return index only for the NIFTY 50. With the rising popularity of other asset classes and strategies, it makes sense to provide a Total Return index for every Price index that they publish. We briefly touched upon this while we looked at the MNC asset class. The NIFTY MNC Index, being a price index, missed a lot of performance information. We had to compare an MNC Fund to another Midcap Fund to get a better idea of relative performance. (Read the whole thing here: The MNC Fund Gravy Train, Part II)

Code for the above charts are on Github
Trading Day of Month Returns

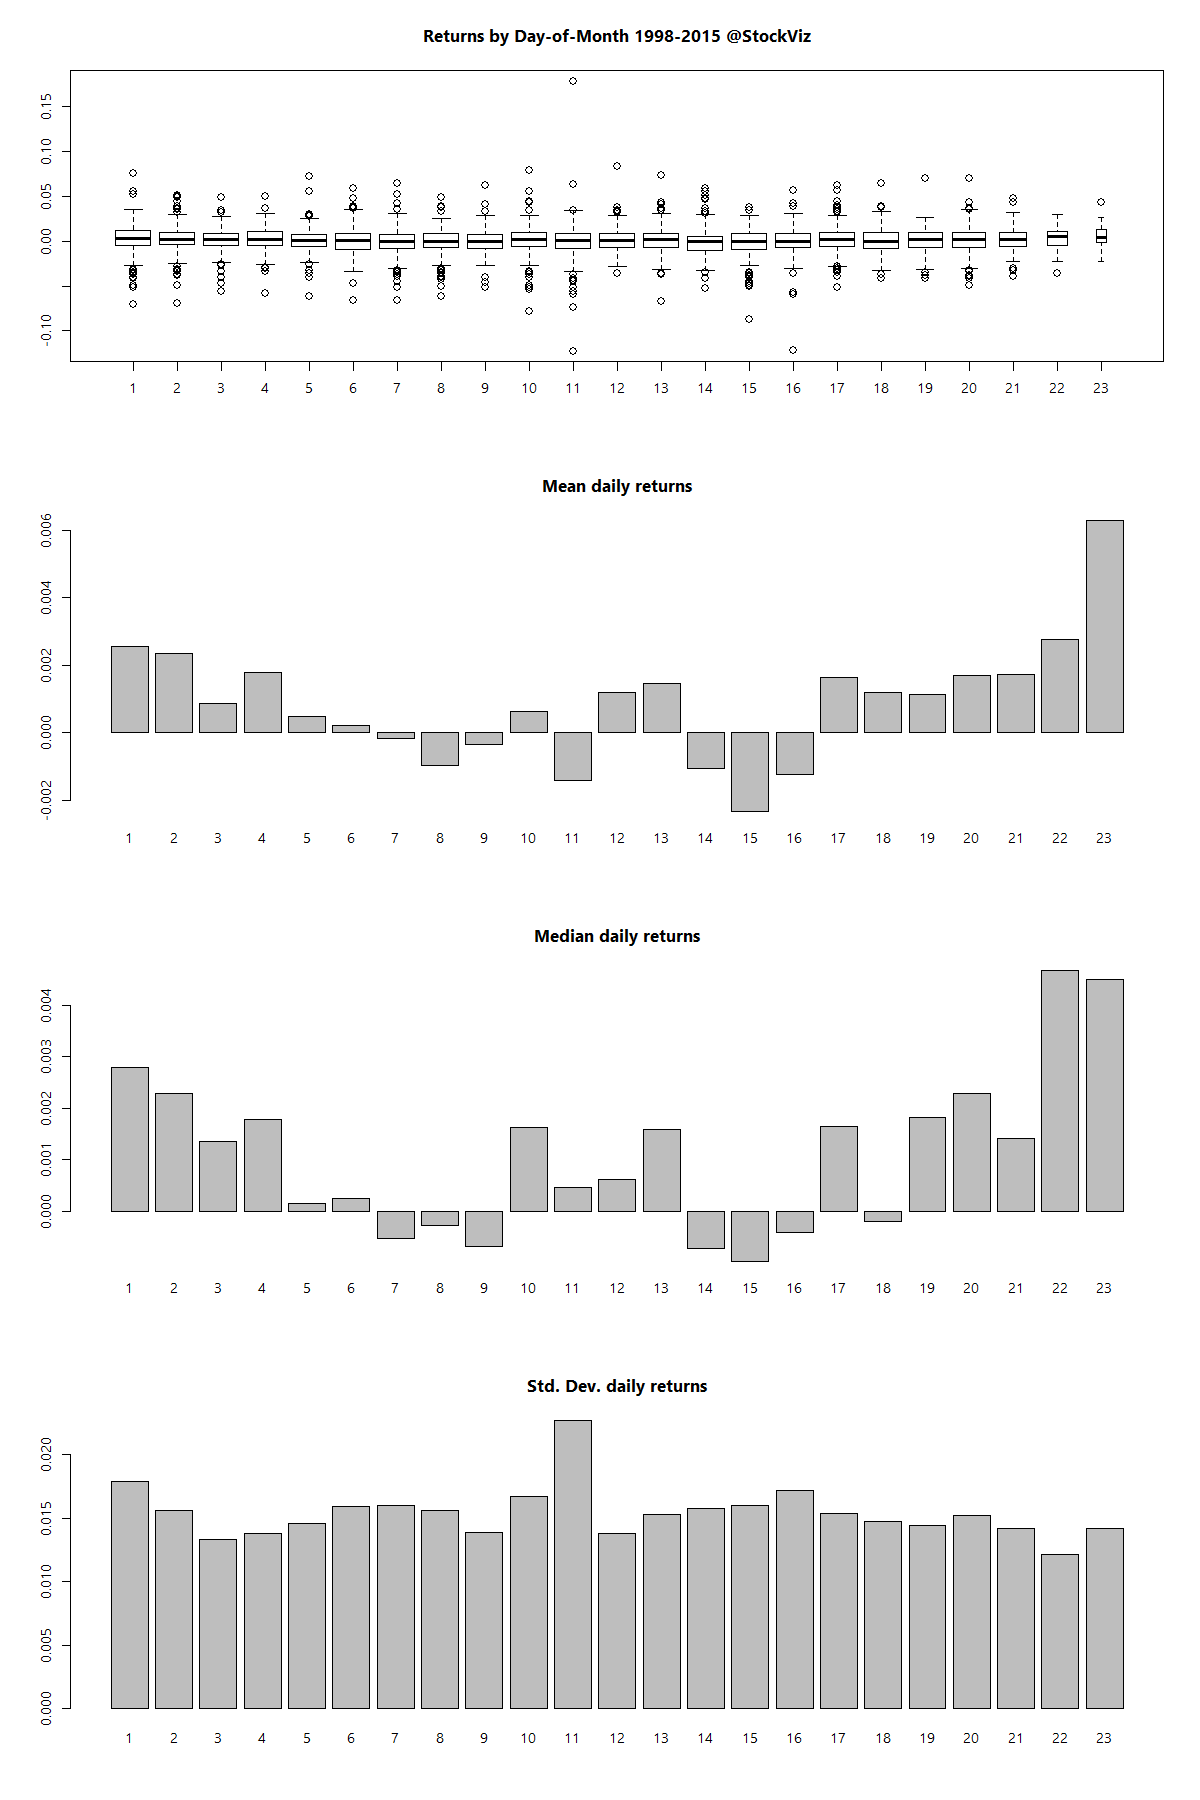
An analysis of daily returns of the NIFTY 50 index between 1998 and 2015 shows that:

  1. The first few and the last few trading days of a month are the best days to be long.
  2. Middle of the month returns are more volatile and, on an average, negative.
  3. Cumulative returns of a strategy that is long on the first 5 and the last 5 days of the month and short the others is 1,112.154% vs. 636.1821% of a buy and hold strategy.

day-of-month

Further reading: An Anatomy of Calendar Effects (SSRN)

NIFTY Volatility, Historical Perspective

Was 2014 an anomaly?

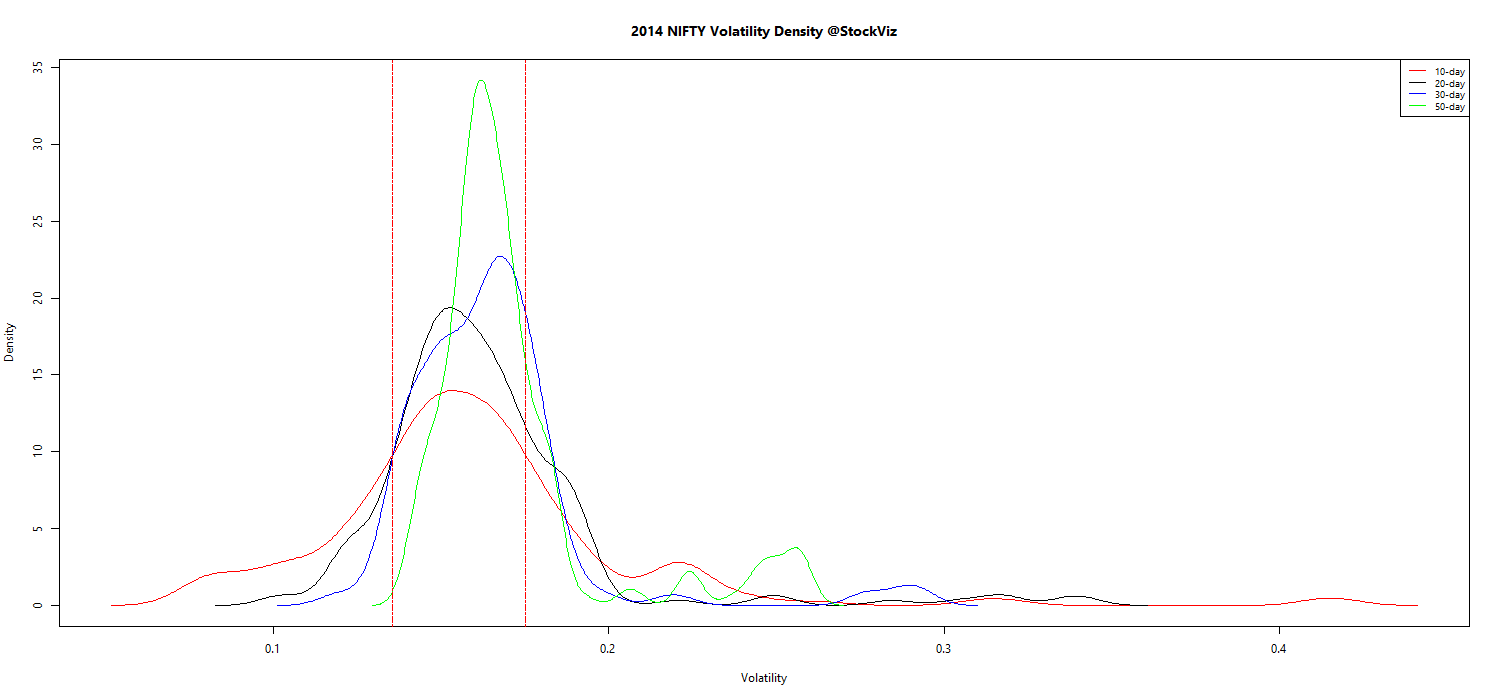
Here’s a density plot of NIFTY volatility across 10-, 20-, 30-, and 50-day periods:

NIFTY.volatility.density.2014

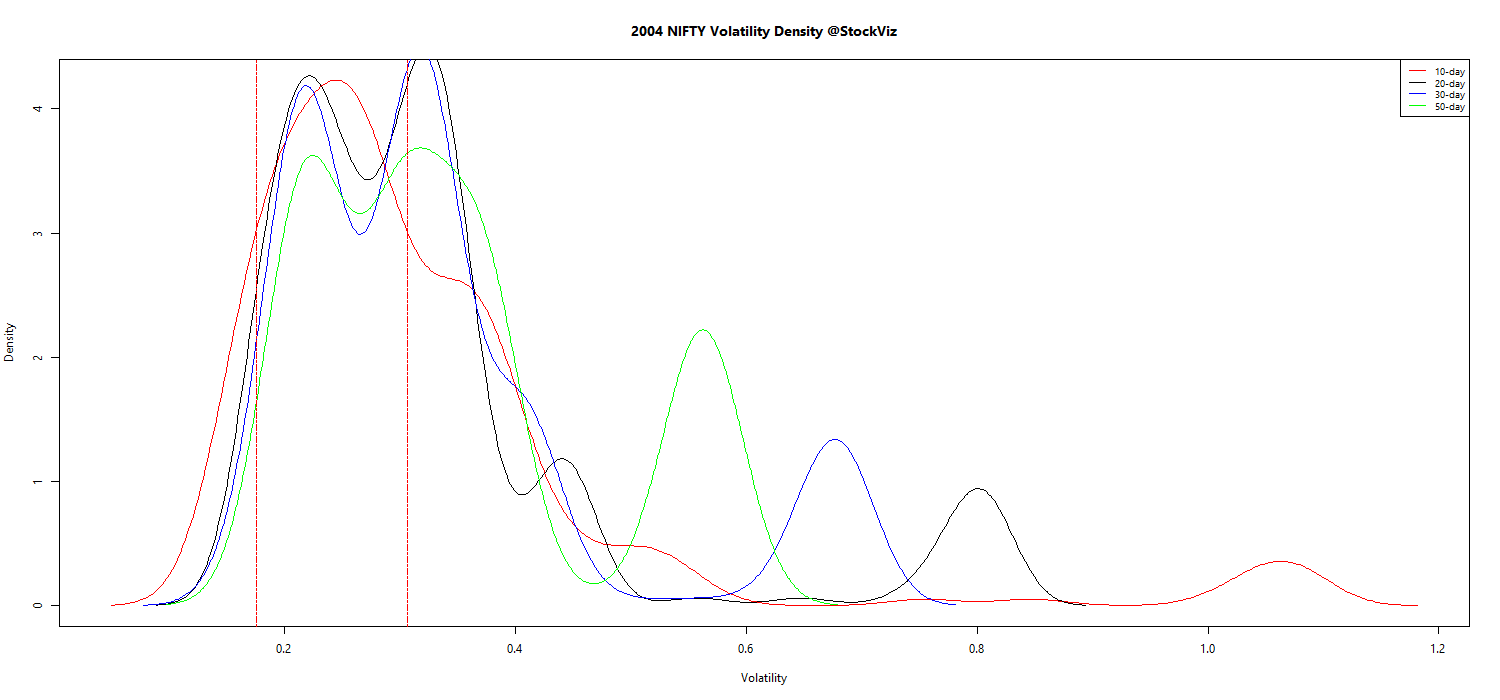
And here’s how it was in 2004 (10-years ago):

NIFTY.volatility.density.2004

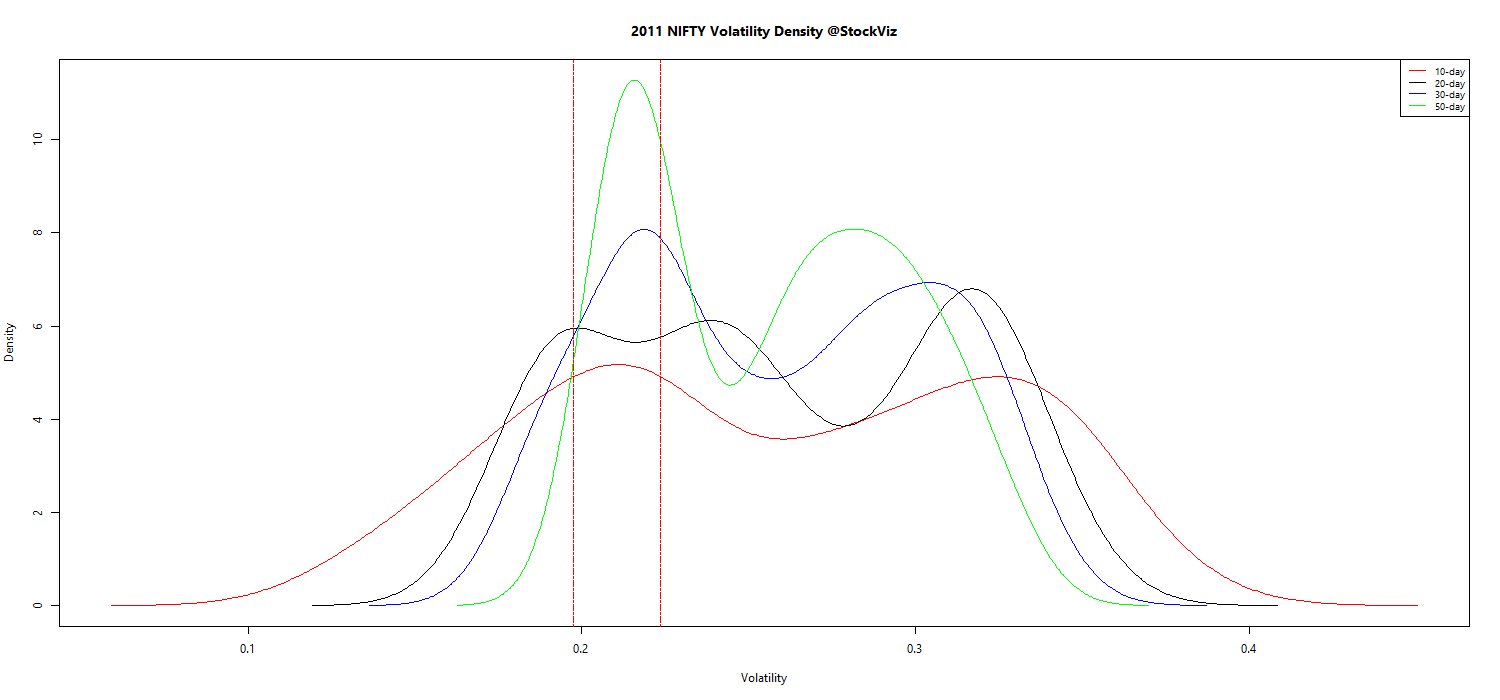
For those of who argue that the introduction of the pre-open auction call in 2010Gaps and the Pre-Open Call Auction skews these results, here’s how 2011 looked like:

NIFTY.volatility.density.2011

The unprecedented absence of a second “hump” in the volatility density plot for 2014 should give pause to investors looking for a repeat of 2014 anytime soon.

Reversion to higher volatility?

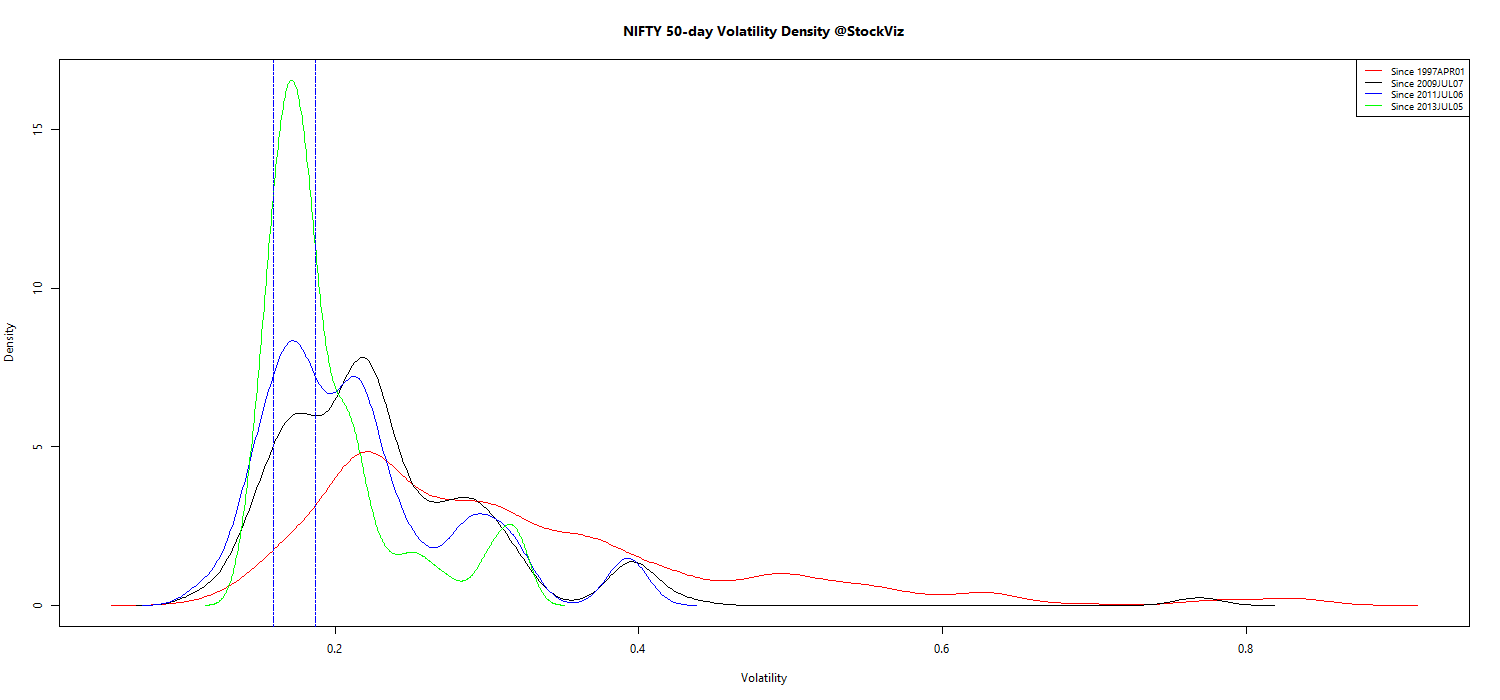
If you look at the 50-day volatility over different time-periods, you can observe how volatile volatility is:

NIFTY.volatility.density.50

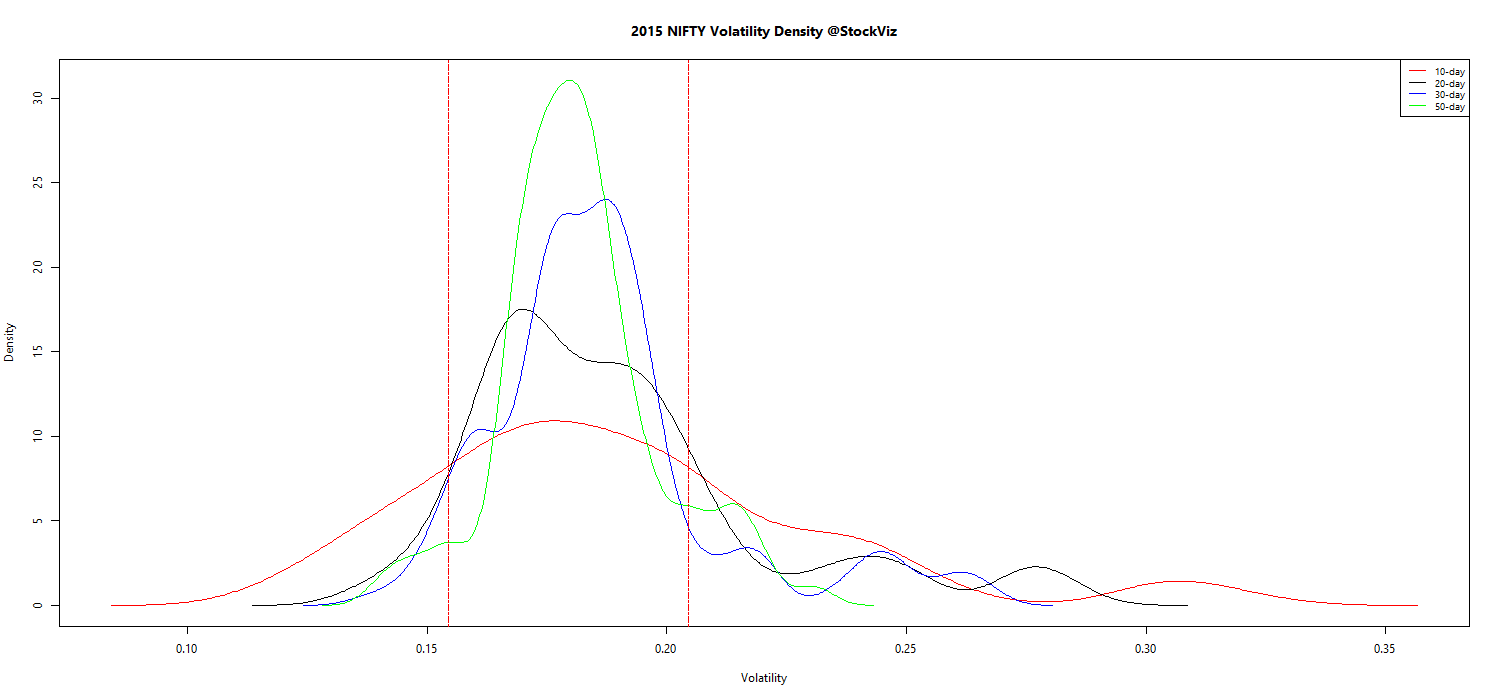
This year’s observed volatility is closer to last-year’s than to its long-term mean. Here’s how 2015 has panned out so far:

NIFTY.volatility.density.2015

We should expect higher volatility as the initial bull-run wears off and volatility reverts. This will have a ripple effect on pretty much every investment/trading strategy.

Appendix

Year-wise NIFTY volatility density plots (pdf)

Ten years is a long time

Yearly Nifty and Defty Returns

nifty.vs.defty.returns

When you look at the last 24 years of returns, the NIFTY gave negative returns for 8 years – 1/3rd of the time.

Holding period matters

The most frequent advice given to new equity investors is that they should at least have a 3-year horizon. The problem with this is that there have been 7 periods where cumulative 3-year returns have been negative or single digits. This sort of advice does nothing to mentally prepare the investor to stay disciplined.

nifty.defty.3.yr.returns

In fact, dollar investors (NRIs, etc.) have had it rougher.

nifty.defty.5.yr.returns

It is only when you look at 7-years and beyond that you start seeing the kind of returns that begin to make sense.

nifty.defty.7.yr.returns

nifty.defty.10.yr.returns

Long-term portfolio but short-term horizon

Very often, advisors set up portfolios looking at this:

nifty.defty.15.yr.returns

Whereas the media is feeding the investor this:

CNX NIFTY.2015-07-15

Long-term investing works if you have the discipline to ignore portfolio returns over very long time horizons. But how many of us have the discipline to stay the course over decades?

Short Butterflies with a Delayed Fuse

Delayed Entry

In our previous post, we saw how a mechanical expiry-to-expiry short-call NIFTY butterfly with a stop-loss significantly outperformed a non-stop-loss strategy. However, the odds that a stop-loss would be triggered was almost 50%.

In our introductory post on butterflies, we had noted how the strategy P&L gets “pulled” as we get closer to expiry. This implies that during the first half of the trade, the position sits idle. However, the underlying NIFTY index could have already made its move out of the wings and could be on its way back to the center. To avoid this, we can delay entry until, say, 10 days have passed since expiry.

Returns with stop-loss and delayed entry

butterfly.returns.SL.10d.NIFTY

short call nifty butterfly 10day delay
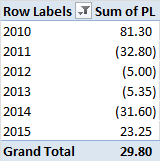
The odds of a stop-loss being hit remained the same. Even though the total return improved, when you look at the yearly rollups, the hit-rates are sub-par.

Conclusion

Although on the face of it, selling butterflies on the NIFTY sounds attractive – NIFTY is a volatile index and a rising NIFTY will make the moves required for a profitable trade lower – a mechanical backtest did not lead to a strategy that could be applied on an on-going basis.